Universidade Fernando Pessoa
Porto, Portugal
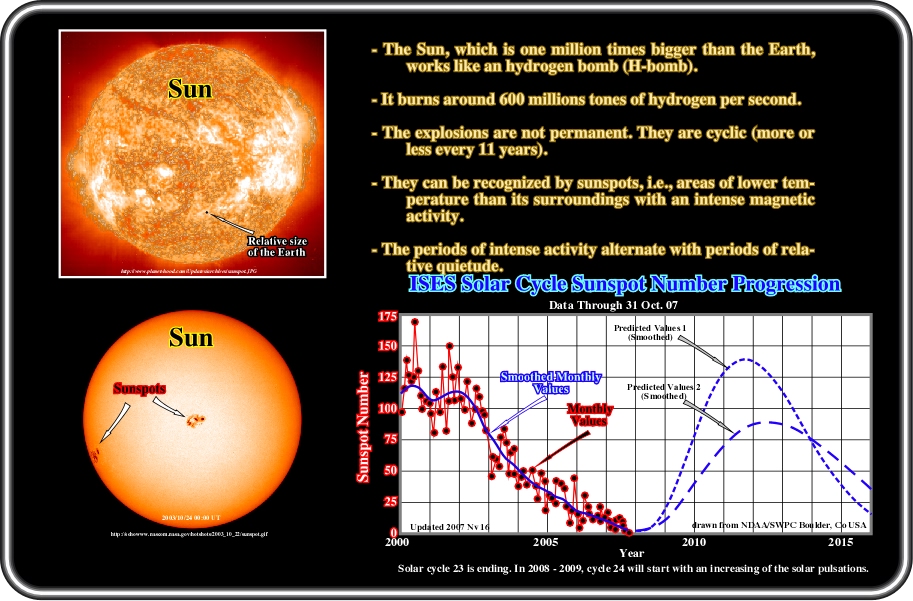
Plate 45- The physical basis of the solar cycle was elucidated in the early 20th century by G. E. Hale and collaborators, who, in 1908, showed that sunspots (formed over periods lasting from days to weeks and lasting for weeks or even months) were strongly magnetized (this was the first detection of magnetic fields outside the Earth). In 1919, they show that the magnetic polarity of sunspot pairs: (i) Is always the same in a given solar hemisphere throughout a given sunspot cycle; (ii) Is opposite across hemispheres throughout a cycle; (iii) Reverses itself in both hemispheres from one sunspot cycle to the next. Hale's observations revealed that the solar cycle is a magnetic cycle with an average duration of 22 years. However, because almost all manifestations of the solar cycle are insensitive to magnetic polarity, it remains common usage to speak of the "11 year solar cycle". Half a century later, H, Babcock and his son showed that: (a) The solar surface is magnetized even outside of sunspots; (b) This weaker magnetic field is to first order a dipole and (c) The dipole also undergoes polarity reversals with the same period as the sunspot cycle. These various observations established that the solar cycle is a spatiotemporal magnetic process unfolding over the sun as a whole. The basic causes of the solar cycle are still under debate, with some researchers suggesting a link with the tidal forces due to the gas giants Jupiter and Saturn. The sun's magnetic field structures its atmosphere and outer layers all the way through the corona and into the solar wind. Its spatiotemporal variations lead to a host of phenomena collectively known as solar activity. All of solar activity is strongly modulated by the solar magnetic cycle, since the latter serves as the energy source and dynamical engine for the former. As illustrated above (ISES Solar Cycle Sunspot Number Progression), the solar cycle 23 is ending. The first sunspot of the cycle 24 became visible on 4th January 2008. Another small sunspot probably of the cycle 24 appeared in the northern hemisphere (with the right magnetic polarity) on 14th April, however, taking into account its size some scientists have hesitated to index it as sunspot n° 990, since several small sunspots of the cycle 23 appeared in beginning of 2008 near the equator. For the majority of the specialists the two small sunspots of the cycle 24 are just precursors, since for the moment there are more sunspots of the cycle 23 than 24. In other words, it seems that we are in the overlapping period between the end of the cycle 23 and the beginning of the cycle 24. The initial ISES Solar Cycle 24 Prediction was released in April, 2007. The panel charged with determining the prediction was unable to agree on a single solution and have so far provided two predictions. Those two predictions are illustrated above, along with an average of the two predictions. The average is currently being used as the official prediction; however, the ISES panel does not consider this to be an adequate solution. All files are available in http://www.swpc.noaa.gov/ftpdir/weekly/README3.
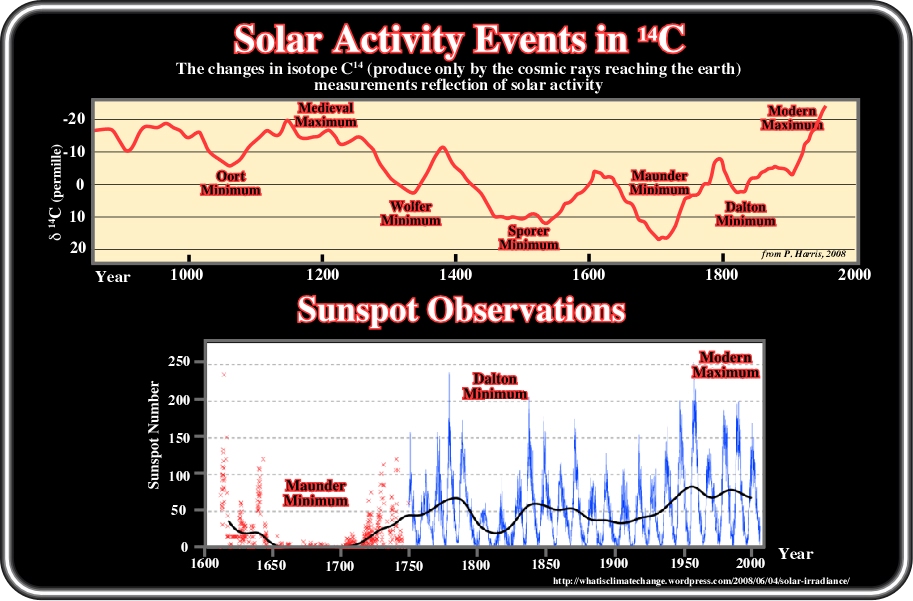
Plate 46- Sunspots not only have a connection to geomagnetic activity at Earth, but they play a role in climate change as well. In the last thousands of years, there have been many periods where there were not many sunspots found on the Sun. The most famous is a period from about 1645 to 1715, called the Maunder Minimum. This period corresponds to the middle of a series of exceptionally cold winters throughout Europe known as the Little Ice Age. Scientists still debate whether decreased solar activity helped cause the Little Ice Age, or if the cold snap happened to occur around the same time as the Maunder Minimum. In contrast, a period called the Medieval Maximum, which lasted from 1100 to 1250, apparently had higher levels of sunspots and associated solar activity. This time coincides (at least partially) with a period of warmer climates on Earth called the Medieval Warm Period. Sunspot counts have been higher than usual since around 1900, which has led some scientists to call the time we are in now the Modern Maximum (http://www.windows. ucar.edu/tour/link=/sun/activitysunspot_history.html). The reconstruction of solar activity from the past, i.e., before people were able to count sunspots using radioisotope analysis, can be made using tree rings to calibrate for date and look at changes in 14C measurements which are understood to be a reflection of solar activity. Changes in the output of energetic particles from the Sun (the solar wind) are believed to modulate the production of 14C in the upper atmosphere. The magnetic properties of the solar wind change with the variation of sunspots, leading in turn to variations in the production of 14C (Stuiver et al., 1991). The effect of the solar wind is such that high 14C production is associated with periods of low sunspot number. From the changes in how 14C responds, one can produce graphs, as above, to look at solar changes over the past 1000 years. However, one would be quick to note that these proxies are not the same thing as the amount of light hitting the earth. That is why they are considered to be a proxy. More sunspots correlates with more solar irradiance, but one do not measure the other directly.
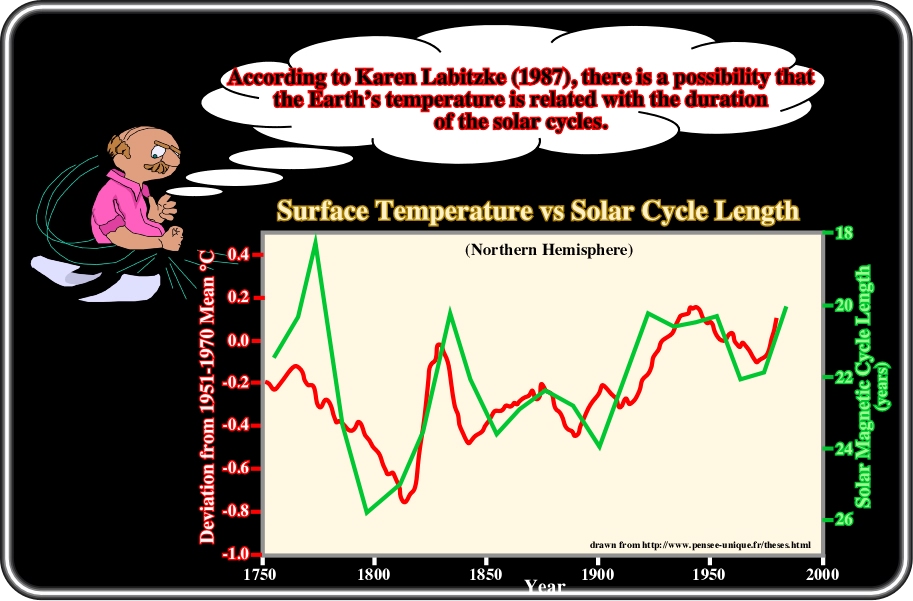
Plate 47- This diagram summarizes how K. Labitzke, in 1987, suggested that there is a strong relation between the Earth's temperature and the cycle solar eruptions. As pointed out in http:www.pensee-unique.fr/theses.html, it is not the correlation of a unique increasing in the temperature with a unique increase of the CO2 concentration (as the "believers" of the greenhouse effect do), but the correlation of several ups and downs of the temperature with several up and downs of the solar cycles' duration from 1750 to 1996. The correlation is much more likely, since the temperature has increased and decreased several times. However, as correlation is not causation, with such a diagram one can just say that the coincidence between the temperatures and the duration of the solar cycles is good and probably it is not accidental. The influence of the solar eruptions on the climate was also advanced to explain the periods of poor agricultural production. In 1801, William Herschel, wrote. "I am now much inclined to believe that openings (i.e., sunspots) with great shallows, ridges, nodules and corrugations, instead of small indentations, may lead us to expect a copious emission of heat, and therefore mild seasons". He thought that the cloud cover was more important when the solar eruptions were less frequent. Several phenological studies (studies of cyclic and seasonal natural phenomena, especially in relation to climate and plant and animal life) corroborate the conjecture that solar activity has a strong influence on climate. The paper of Yasuyuki Aono and Keiko Kazui (http://www3.interscience.wiley.com/journal/ 114298147/abstract) is, on this subject, quite interesting: "Changes in springtime temperature in Kyoto, Japan, since the 9th century were reconstructed, using the phenological data series for cherry tree (Prunus jamasakura), deduced from old diaries and chronicles. Phenological data for 732 years was made available by combining data from previous studies. The full-flowering date of cherry trees fluctuates in accordance with temperature conditions during February and March. Full-flowering dates were closely related to the March mean temperature by means of a temperature accumulation index, in which plant growth is considered to be an exponential function of temperature. Calibration enabled accurate estimation of temperatures in the instrumental period, after 1880; the root mean square error (RMSE) of temperature estimates was determined to be within 0.1 °C, after smoothing by local linear regression over time spans of 31 years. The results suggested the existence of four cold periods, 1330-1350, 1520-1550, 1670-1700, and 1825-1830, during which periods the estimated March mean temperature was 4-5 °C, about 3-4 °C lower than the present normal temperature. These cold periods coincided with the less extreme periods, known as the Wolf, Spoerer, Maunder, and Dalton minima, in the long-term solar variation cycle, which has a periodicity of 150-250 years. The sunspot cycle length, a short-term solar variation cycle, was also compared with the temperature estimates, with the result that a time lag of about 15 years was detected in the climatic temperature response to short-term solar variation".
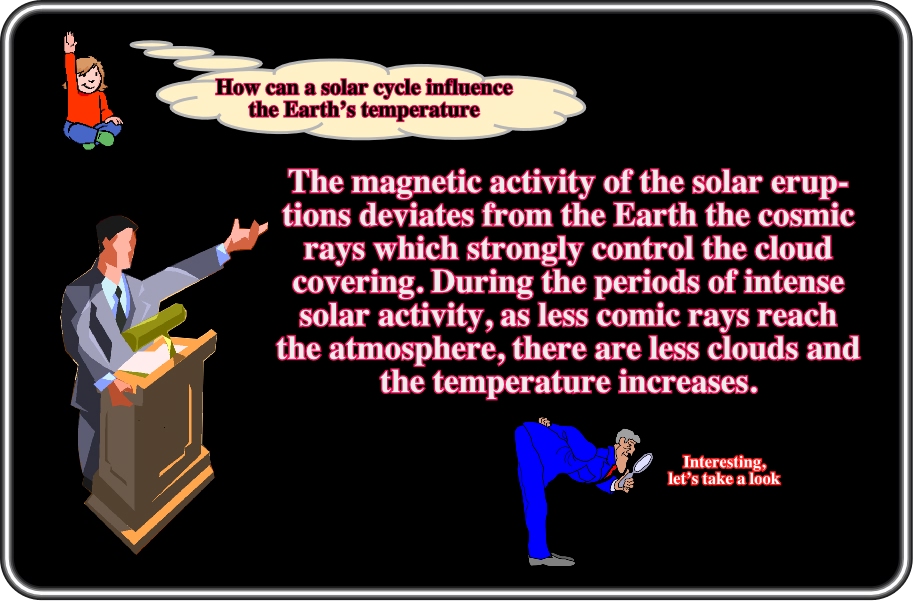
Plate 48- There are several hypotheses explaining how solar variations may affect Earth: (i) Changes in total irradiance; (ii) Changes in ultraviolet irradiance; (iii) Changes in the solar wind and the Sun's magnetic flux and (iv) Effects on clouds. The last one, i.e., the effect on the clouds seems to be the one with a more consequential impact on climate change. In fact, changes in ionization affect the abundance of aerosols (suspensions of fine solid particles or liquid droplets in a gas) that serve as the nuclei of condensation for cloud formation. As a result, ionization levels potentially affect levels of condensation, low clouds, relative humidity and albedo due to clouds. Clouds formed from greater amounts of condensation nuclei are brighter, longer lived, and likely to produce less precipitation. Changes of 3-4% in cloudiness and concurrent changes in cloud top temperatures have been correlated to the 11 and 22 year solar (sunspot) cycles, with increased GCR (Galatic Cosmic Rays) levels during "antiparallel" cycles. Global average cloud cover change has been found to be 1.5-2%. Several studies of GCR and cloud cover variations have found positive correlation at latitudes greater than 50° and negative correlation at lower latitudes. However, not all scientists accept this correlation as statistically significant, and some that do attribute it to other solar variability (e.g. UV or total irradiance variations) rather than directly to GCR changes. Difficulties in interpreting such correlations include the fact that many aspects of solar variability change at similar times, and some climate systems have delayed responses.
Plate 49- A fascinating paper was published online (Proceedings of the Royal Society A, October 3rd, 2006), under the title: "Experimental Evidence for the role of Ions in Particle Nucleation under Atmospheric Conditions". Firstly, this new work is a severe blow to proponents of the enhanced greenhouse hypothesis and advocates of Anthropogenic Global Warming who have worked so hard to deny solar influence on global climate. The more active sun warms the planet directly with increased incident radiation and indirectly both by reducing low cloud and likely by elevating the proportion of gaseous water (the most important greenhouse gas). This is precisely the kind of feedback hypothesized for enhanced greenhouse except this now has a demonstrated physical mechanism and is of such importance we should walk through its function just to be clear (http://www.junkscience.com/Greenhouse/Cosmic_rays_and_ climate.html). Increased solar activity acts directly on the Earth with a small increase in radiation, a small heating effect and an associated increase in evaporation. This same increase in activity suppresses cosmic ray penetration of Earth's atmosphere, thus reducing available low cloud condensation nuclei. This sequence of events increases clear sky and incoming radiation while increasing the already dominant clear sky greenhouse effect from gaseous water vapour. The reverse effect of a more quiescent sun reduces direct solar warming and, by permitting the penetration of cosmic rays, facilitates low cloud formation, which increases reflection of already reduced solar radiation, reduces clear sky, reduces evaporation and simultaneously reduces the availability of the most important greenhouse gas, water vapour, through condensation and precipitation. Thus solar activity has associated positive feedback when more active and negative feedback when less active, dramatically magnifying Earth's thermal response to changes in solar activity and explaining how fractions of Wm-2 change in direct solar radiation translate to many Wm-2 effect between positive and negative phases of relative solar activity. Good cloud data is in short supply and covers only the recent decades but we can derive cosmic ray intensity and deduce there has been a general reduction in cloud cover during the 20th Century. While we are hesitant to extrapolate from very short data series (always a dubious procedure) it is entirely plausible that reduction in low cloud over the period could conservatively be estimated to have increased heating at Earth's surface by 5-10 Wm-2, an amount more than sufficient to account for all the estimated warming over the period. Additionally, the mechanism described by Svensmark et al. (Journal of Atmospheric and Solar-Terrestrial Physics, v. 59, Issue 11, July 1997, pp1225-1232 and http://www.sciencedirect.com/science) explains observed drought response to the recently more active sun and the reduction in cloudiness, probably coupled with snowfield discoloration from dust, soot and other particulates, goes a long way toward explaining a disproportionate Arctic response, one apparently lacking in the Antarctic where such pigments are in relatively short supply, leaving snowfield albedo relatively unchanged. This puts anthropogenic emissions in an interesting light. Since solar effects, both direct and indirect, are more than sufficient to account for net estimated temperature change over the period of significant fossil fuel usage, have humans been warming or cooling the planet? We know there are effects from land use change and we know we have added to atmospheric backscatter of solar radiation from particulates (sulfate aerosols, dust from agriculture...) but we are no longer certain of the net sign of anthropogenic temperature change. The one thing we are reasonably sure of is that twiddling about with emissions of carbon dioxide will have no discernable effect on global mean temperature. If you think the above is really quite significant in the "greenhouse debate" then you are right, which is probably why the mainstream media seem to have completely ignored it. The hazards of excessive investment in the enhanced greenhouse hypothesis, we presume. (http://www.junkscience.com/Greenhouse/Cosmic_rays_and_ climate.html).
Plate 50- On this subject, one can read (http://www.sciencedaily.com/releases /2002/07/020731080631.htm). "A systematic change in global cloud cover will change the atmospheric heating profile, i.e., the cosmic ray-induced global cloud changes could be the long-sought mechanism connecting solar and climate variability. If such hypothesis, is not invalidated, it could also shed light on the Sun's role in global warming. The amount of cosmic rays reaching Earth depends on solar winds, which vary in strength by space-weather conditions. There are indications that Earth's warming have coincided with decreased cosmic ray intensity during the 20th century. Such explanations for natural causes of global warming do not rule out human contributions to temperature change, but present the possibility that humans are not solely responsible for some of the observed temperature increases. Recent satellite data have revealed a correlation between cosmic ray intensity and the fraction of the Earth covered by low clouds. The amount and charge of cosmic ray-generated ions can contribute to the formation of dense clouds by stimulating the production rate of low-atmosphere particles that make the clouds more opaque. In addition, natural and man-made differences in atmospheric chemistry, like greenhouse gas concentrations, can also affect the cosmic rays' influence on clouds. Such height-dependent atmospheric differences can increase the quantity of ambient particles in the lower troposphere and decrease the particles in the upper air, thus affecting the type of cloud cover. High clouds, for example, generally reflect sunlight while lower clouds tend to retain surface energy; both effects are scientifically well established and have a significant effect on global temperatures. The data provides evidence supporting that cosmic ray-induced cloud changes may have warmed the Earth's surface but cooled the lower troposphere, which could provide an explanation of the Earth's varying temperature trends."
Plate 51- Caption 52- Several scientists do not believe that there is a link between cosmic rays and cloud cover. In addition, and more importantly, they claim that there has been no correlation between cosmic rays and global temperatures over the last 30 years of global warming. However, Krivova N.A. and Solanki S.K. (Solar total and spectral irradiance: Modelling and possible impact on climate, in Proc. ISCS 2003 Symposium, Solar Variability as an Input to Earth's Environment) conclude that: "Between 1970 and 1985 the cosmic ray flux, although still behaving similarly to the temperature, in fact lags it and cannot be the cause of its rise. Thus changes in the cosmic ray flux cannot be responsible for more than 15% of the temperature increase". Similarly, Lockwood M. and Frohlich (Recent oppositely directed trends in solar climate forcings and the global mean surface air temperature, in Proc. R. Soc. A., doi:10.1098/rspa.2007) compared neutron monitor measurements, Be10 and C14 isotopes (both proxies for cosmic radiation) as well as several other measures of solar activity and concluded "the observed rapid rise in global mean temperatures seen after 1985 cannot be ascribed to solar variability, whichever of the mechanisms is invoked and no matter how much the solar variation is amplified". The answers for these conjectures can be summarized as follows (http://www.skepticalscience.com/cosmic-rays-and-global-warming.htm): (i) Neither the sun nor CO2 nor the two together make up for the only climate forcing; the arguments are a bit weak by themselves, but even if we assume that all the unexplained difference is due to CO2, that doesn't give as much room for IPCC's +6°C forecast; (iii) If all the differences from Krivova et al graph is attributed to CO2 that means that burning half of our known reserves of oil and gas has yielded us less than 0.3°C in temperature change; the climatic response time would need to be many hundreds of years for that to be possible, which clearly is not the case with total solar irradiance and cosmic ray forcing; (iii) The discussion would be less confusing if we started to define what kind of cosmic rays we are discussing. Indeed, some are using low energy cosmic rays but what Svensmark and others claim is that it is cosmic rays of a certain energy (around 10 GeV) that makes the difference. Only these energies create the secondary particles needed for the ionisation over low altitudes far from land. Sometimes the cosmic rays of high and low energies follow each other, other times they won't; hence we should clearly state what kind of cosmic rays we are referring to.
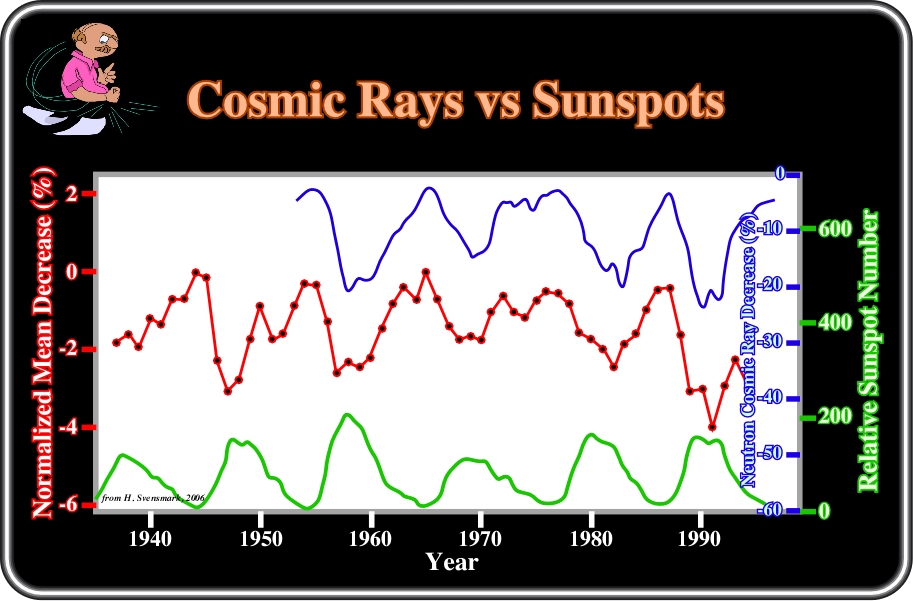
Plate 52- The curves in blue and red represent the number of ionizing particles arriving at Earth's surface in two detection chambers in USA between 1937 and 2000. As depicted, there is a good temporal agreement between the number of ionizing particles and the number of solar eruptions (Relative Sunspot Numbers, curve in green). The maximum number of solar eruptions corresponds to a minimum of ionizing particles. Such a correlation corroborates the conjecture that solar eruptions induce magnetic thunderstorms, which deflect the ionizing particles away from the Earth and that when the solar eruptions are brutal (short duration), the number of ionizing particles arriving on the Earth is minimum. It has been hypothesized that the ionizing particles coming from the space have a strong influence on the cloud cover of the Earth and so on the temperature (see next plate).
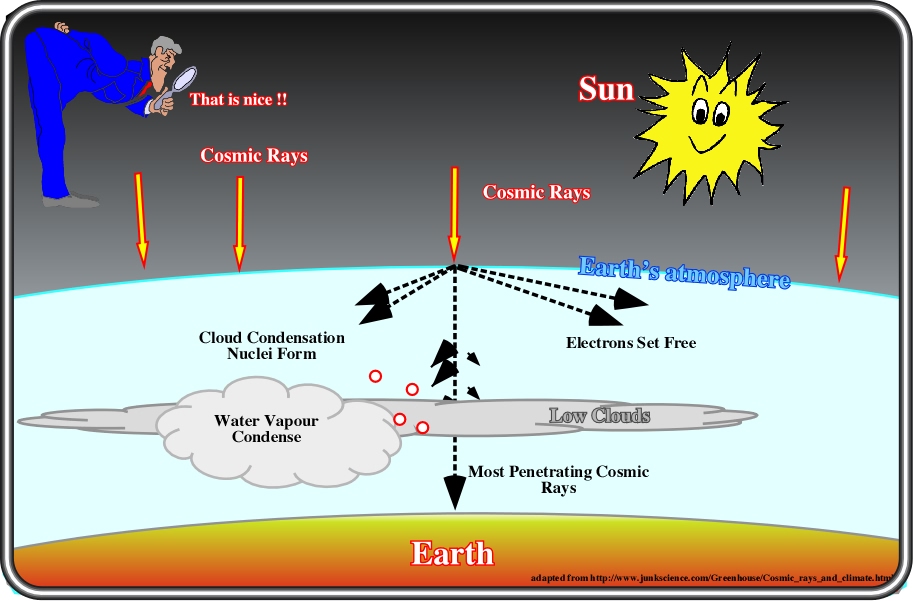
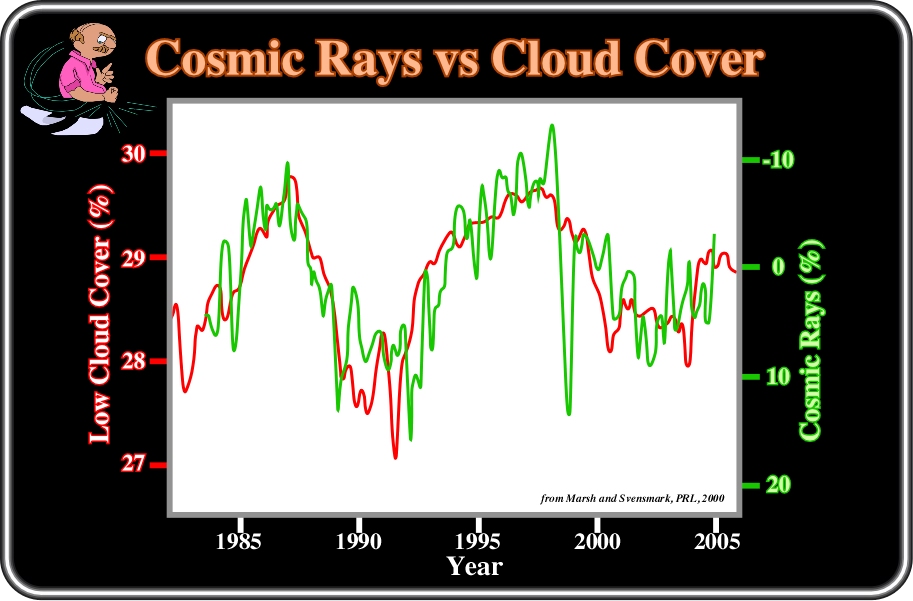
Plate 53- The correlation between these two curves is excellent, but as said before correlation is not causation. Scientists thought that when the solar activity is intense, as it is presently, the associated magnetic thunderstorms deflect a lot of ionizing particles away from the Earth, which should build-up clouds from the water vapour present in the atmosphere. In other words, they think that cosmic rays may influence Earth's climate through the formation of low lying clouds. The cosmic rays ionize the atmosphere and an experiment has suggested that the production of aerosols depends on the amount of ionization. As aerosols (tiny liquid and solid particles suspended in the air, most occur naturally, originating from volcanoes, dust storms, forest and grassland fires, living vegetation, and sea spray) are precursors for the formation of cloud droplets, this indicates that the cosmic rays may influence cloud formation. The process can be summarized as follows: (i) When the cosmic rays of high energy enter into the atmosphere, they are more or less deflected by the magnetic thunderstorms associated with the solar eruptions; (ii) Arriving in the lower part of the atmosphere, the liberated electrons enhance the creation of small cores of water vapour; (iii) Then, when the nuclei of the water vapour are enough, they aggregate forming small packages; (iv) These packages agglutinate by condensing the water vapour present in the atmosphere and forming droplets of water. Likely some clouds are formed due to cosmic particles coming from the space. The variations of the cloud cover is a strong influence on the climate of the Earth – the higher the amount of sunshine hitting the Earth's surface, higher will be the Earth's temperature. However, such hypotheses, which seem to be corroborated by satellite measures, are completely refuted by the "Alarmists", particularly by the president of the IPCC, who qualified the authors of such hypotheses as "naive and irresponsible". We will see who is right, the "Alarmists" or the "Skeptics". In fact, as presently we are at the end of the solar cycle 23, if the Svensmark' theory is exact, the Earth should became cold in the next years.
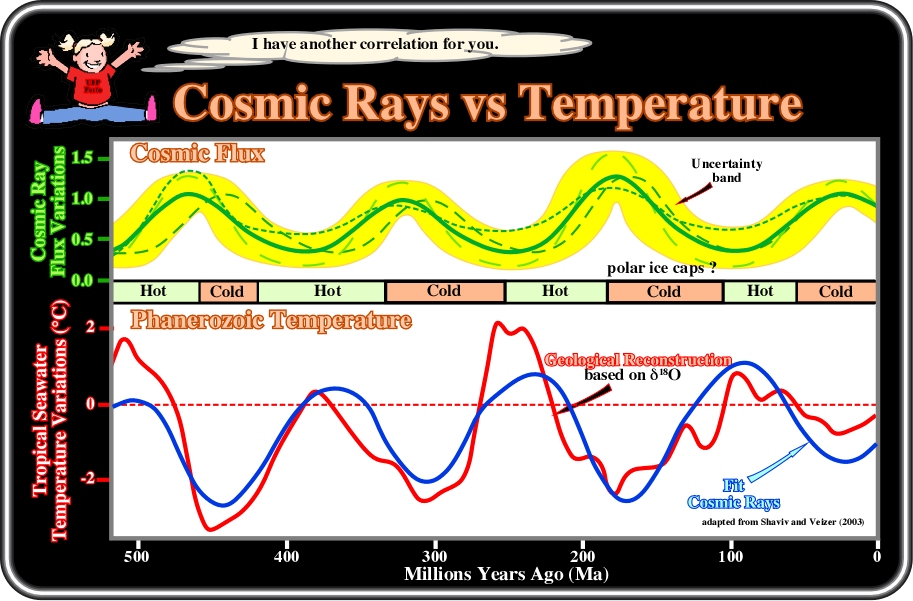
Plate 54- Using the deep cores, Shaviv, N. and Veizer (Celestial driver of Phanerozoic climate? in GSA Today July 2003: 4-10) and Shaviv, show that the proportions of isotopes Be10, Cl36 and C14 gives a good indication of the irradiation of the Earth by the cosmic rays of high energy. On the other hand, the proportion of the isotopes O16-O18 and the variation of the fossils fauna allow a temperature estimation. Indeed, on this plate, it is easy to see the concordance between the temperature variations and the ionizing irradiation. Since the beginning of the Phanerozoic until today four major warm geological periods, with time duration ranging between 50 and 100 My, alternate with four cold periods. The abstract of their paper is clear enough: "Atmospheric levels of CO2 are commonly assumed to be a main driver of global climate. Independent empirical evidence suggests that the galactic cosmic ray flux (CRF) is linked to climate variability. Both drivers are presently discussed in the context of daily to millennial variations, although they should also operate over geological time scales. Here we analyze the reconstructed seawater paleotemperature record for the Phanerozoic (past 545 My), and compare it with the variable CRF reaching Earth and with the reconstructed partial pressure of atmospheric CO2 (pCO2). We find that at least 66% of the variance in the paleotemperature trend could be attributed to CRF variations likely due to solar system passages through the spiral arms of the galaxy. Assuming that the entire residual variance in temperature is due solely to the CO2 greenhouse effect, we propose a tentative upper limit to the long-term "equilibrium" warming effect of CO2, one which is potentially lower than that based on general circulation models". However, and as usually, the "Alarmists" who are sponsored to prove that the global warming is mainly caused by the anthropogenic CO2 concentration, wrote: "Two main conclusions result from our analysis of (Shaviv and Veizer, 2003). The first is that the correlation of cosmic ray flux (CRF) and climate over the past 520 My appears to not hold up under scrutiny. Even if we accept the questionable assumption that meteorite clusters give information on CRF variations, we find that the evidence for a link between CRF and climate amounts to little more than a similarity in the average periods of the CRF variations and a heavily smoothed temperature reconstruction. Phase agreement is poor. The authors applied several adjustments to the data to artificially enhance the correlation. We thus find that the existence of a correlation has not been convincingly demonstrated. Our second conclusion is independent of the first. Whether there is a link of CRF and temperature or not, the authors’ estimate of the effect of a CO2-doubling on climate is highly questionable. It is based on a simple and incomplete regression analysis which implicitly assumes that climate variations on time scales of millions of years, for different configurations of continents and ocean currents, for much higher CO2 levels than at present, and with unaccounted causes and contributing factors, can give direct quantitative information about the effect of rapid CO2 doubling from pre-industrial climate. The complexity and non-linearity of the climate system does not allow such a simple statistical derivation of climate sensitivity without a physical understanding of the key processes and feedbacks. We thus conclude that (Shaviv and Veizer, 2003) provide no cause for revising current estimates of climate sensitivity to carbon dioxide".
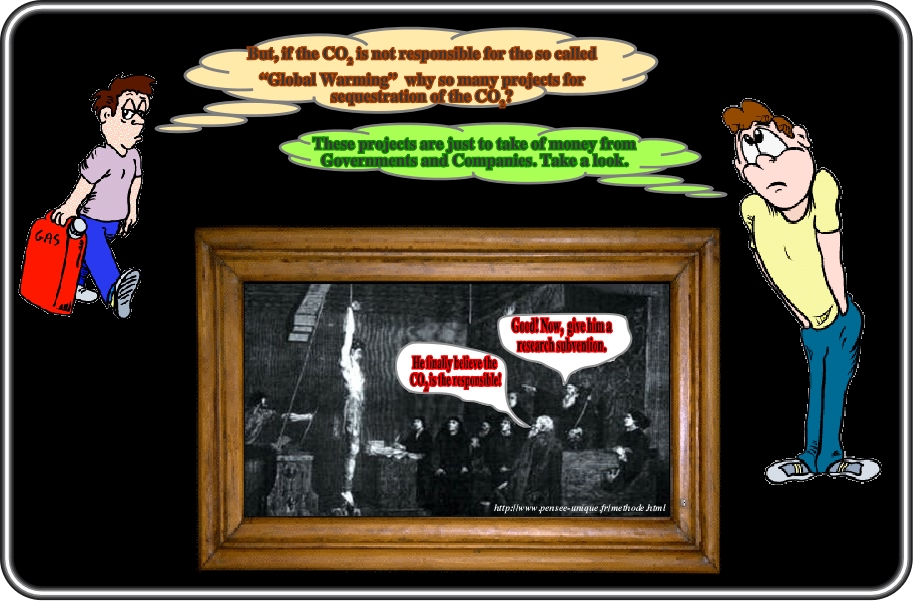
Plate 55- J. Cham, in his PhD, summarized quite well the scientific procedures adopted by the greenhouse effect followers to substantiate their hypotheses. (http://www.phdcomics.com): (i) Advance an hypothesis in accordance with what the money providers want to prove; (ii) Assemble an experiment to suggest that the hypothesis is exact; (iii) Modify the hypothesis to be in accordance with the data; (iv) Publish a paper and label "Theory" the initial conjecture proclaiming you are using a scientific method; (vi) Defend the "Theory" against all contrary evidence. In other words, as expressed by Pilkey, O.. H., and Pilkey-Jarvis (Useless Arithmetic: Why Environmental Scientists Can't Predict the Future, New York, Columbia University Press, 2007): "We are going to make an objective analysis. Give me the objectives and I will make the analysis". Such procedures are not scientific. In science, truth does not exist. All advanced hypotheses must be tested, i.e., criticized by data. If the data refutes an hypothesis, a new one must be advanced and tested again, and so on. The best hypothesis is the more difficult to refute. However, new data can refute it. Those, who are using a flawed validation approach on climate is because they do not want to lose finances or vegetate in a wall cupboard during years. This problem was perfectly summarized by R. Lindzen: "Alarm rather than genuine scientific curiosity, it appears, is essential to maintaining funding. And only the most senior scientists today can stand up against this alarmist gale, and defy the iron triangle of climate scientists, advocates and policy makers".
to continue press
next
![]()
Send E-mail to carloscramez@gmail.com with questions or comments about this conference.
Copyright © 2000 CCramez
Last modification:
August, 2014