Submarine canyons, when not filled-up by sediments, induce important lateral velocity changes due to different properties of water and sediments. Plate 97 shows the pull-down anomaly of the reflections underlying the bottom of the submarine canyon. The geological model is illustrated on the left part of the figure and the more likely seismic response (unmigrated line) on the right part.
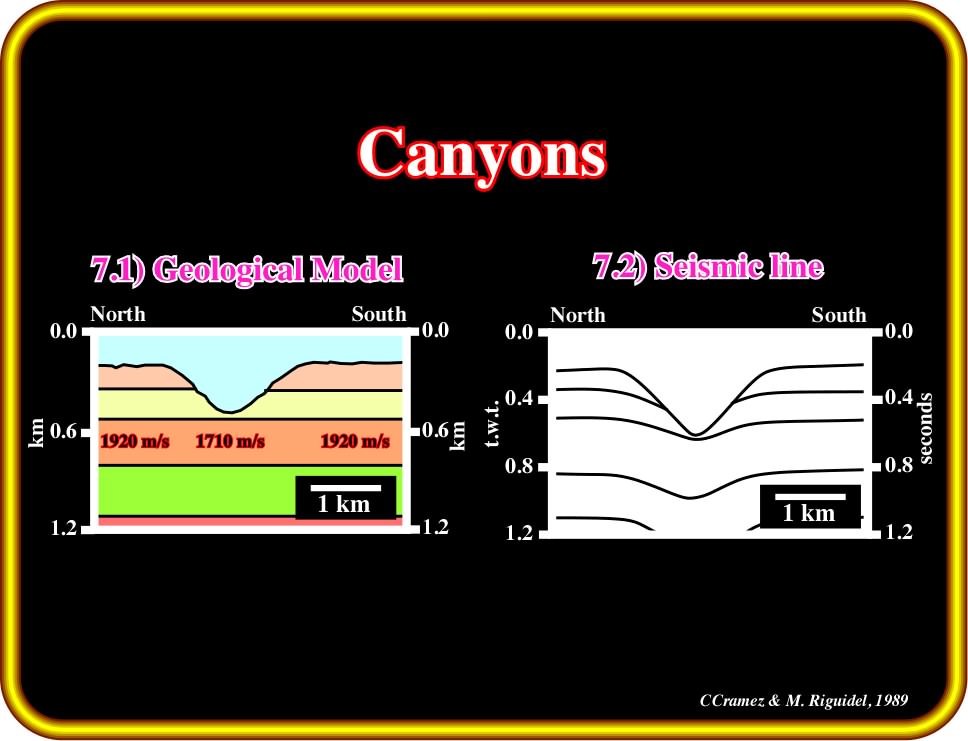
Plate 97- Canyons (submarine valleys) when unfilled by deep water sediments, induce obvious seismic artifacts. In fact, they create sharp lateral changes in the compressional wave velocities (water versus sediments). On a seismic line, when the markers directly below a submarine valley show a synform geometry, the most likely hypothesis is that such a geometry is induced by the lateral velocity change between the water and sediments. Note, the term canyon is often misleading. In Geology, a channel is a linear current mark, larger than a groove, produced on a sedimentary surface parallel to the current, and is often preserved as a channel cast. However, very often, petroleum geologists use the term channel to express its sedimentary filling. Indeed, and particularly, in deep offshore Angola, the filling of turbidite submarine valleys are the most likely prolific reservoir-rocks, explorationists have a tendency to name turbidite channels the onlap filling of the submarine valleys. In fact, the infilling of a submarine valley does not follow the basic principles of the infilling of distributary valleys. The filling of submarine valleys largely postdate the erosional events. On the other hand, the filling corresponds to the stacking of instantaneous but quite time-spaced geological events, i.e. gravity currents.
The velocity model and the seismic response of a geological model, in which a submarine canyon erodes the surrounding sediments is illustrated below (Plate 98). The seismic response, determined using the wave equations software, is illustrated on the right of the Plate 98.
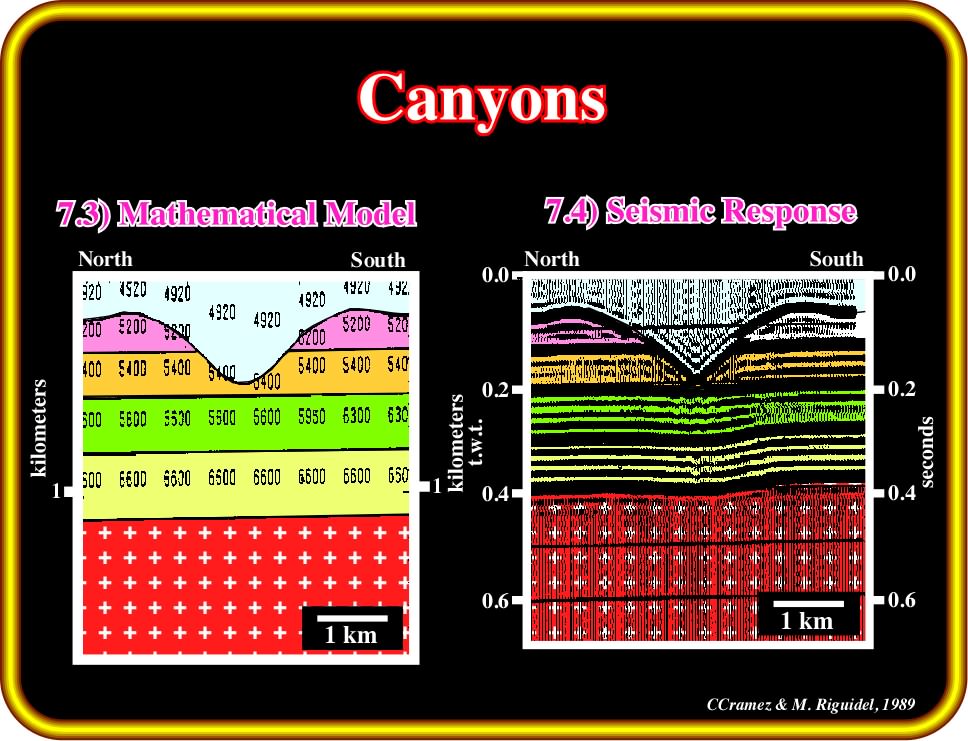
Plate 98- In the velocity model, illustrated above (left part of the figure), there is no lateral changes in the compressional wave velocity. Only the concave geometry of the submarine valley induces local velocity changes, which on the seismic response are represented by the slight pull-down of the seismic reflector underlying the submarine channel. However, as depicted on the seismic line illustrated on Plate 114, the seismic is not so obvious as above, since real undulating seismic reflectors can be pictured, on a time-profile (unmigrated or migrated) as horizontal.
The term canyon is often misleading. In geology, a channel is a linear current mark, larger than a groove, produced on a sedimentary surface parallel to the current, and is often preserved as a channel cast. However, very often, petroleum geologists use the term channel to express its sedimentary infilling. Indeed, and particularly, in deep Angola offshore, the infilling of turbidite submarine valleys are the most likely prolific reservoir-rocks. So, explorationists have a tendency to name turbidite channels the onlap filling of the submarine valleys.
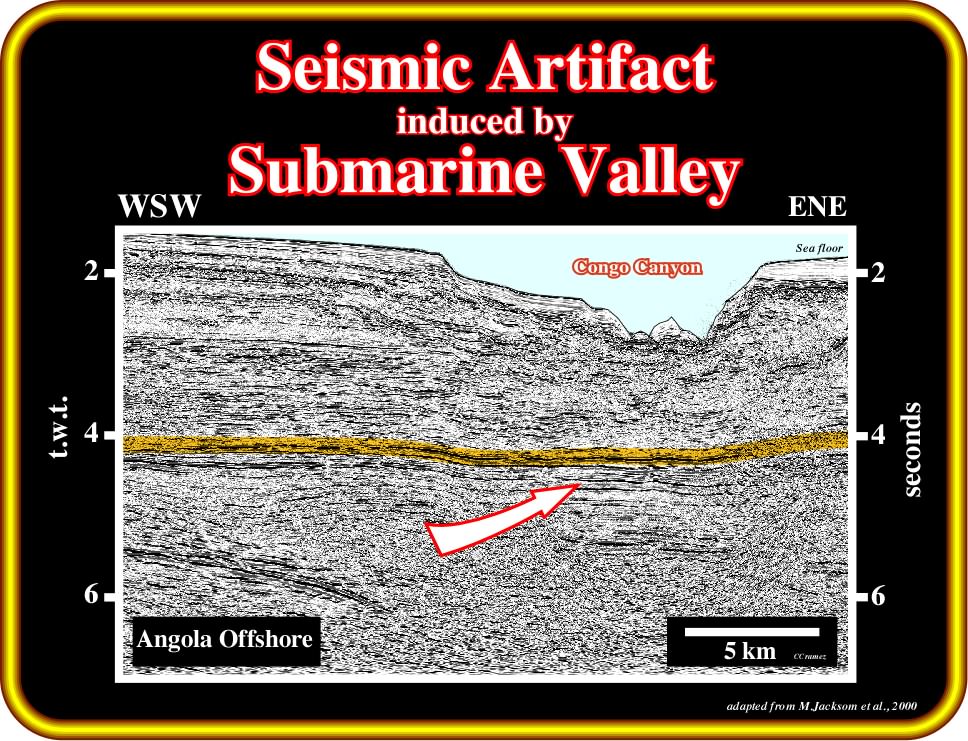
Plate 99- On this seismic line, (deep Angola offshore ) a typical seismic artifact, induced by the lateral change in water depth created by the Congo Canyon, is illustrated by the horizontal geometry of the yellow marker. The horizontal geometry of this marker is apparent. Theoretically, the change in water-depth, induced by the Congo Canyon, delays, locally, the seismic waves, and all seismic markers below it are pulled-down. However, as the yellow marker is horizontal, that means, that in a depth-converted line, its geometry is concave upward, since the delay of the seismic waves is correct. Likely, the yellow marker corresponds to the top of an inverted rift-type basin. In other words, potential structural trap, at the level of the rift-type basin, exists under the Congo canyon.
In addition, as we will see later, the infilling of a submarine valley does not follow the basic principles of the infilling of fluvial distributary valleys. The infilling of submarine valleys largely postdate the erosional events. On the other hand, the infilling corresponds to the stacking of instantaneous but quite time-spaced geological events, i.e. gravity currents.
In very cold areas, as in North Slope (Canada), it is very common to see a quite misleading seismic artifact, often interpreted as compressional tectonic feature. Such a seismic artifact is illustrated in Plate 100.
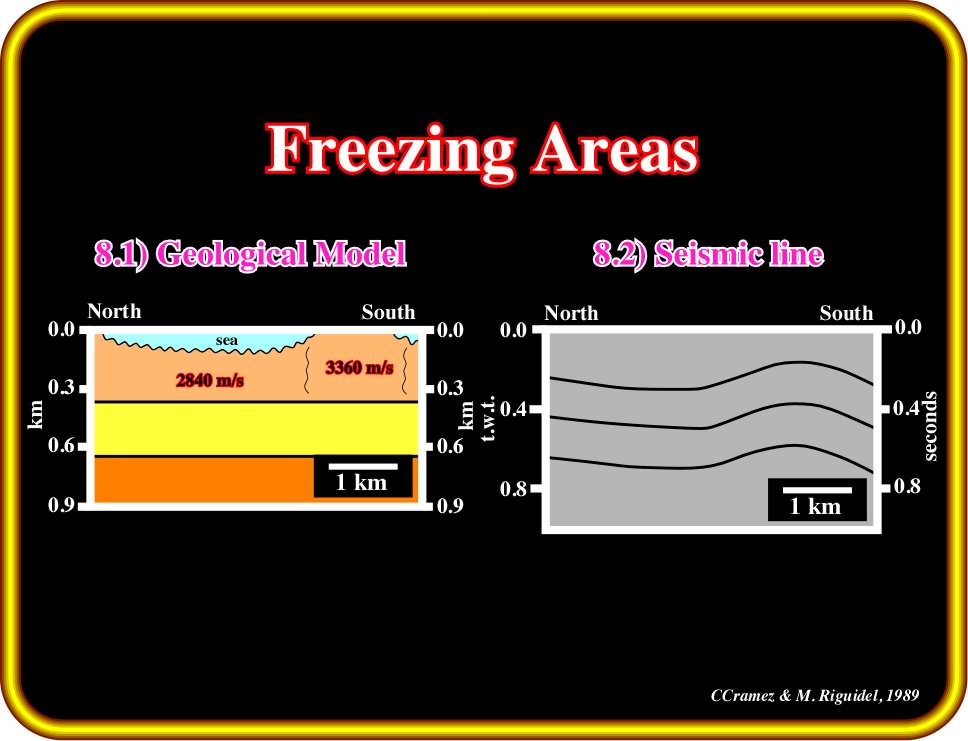
Plate 100- This figure illustrates a typical seismic artifact found very often in permafrost areas, that is to say, in any soil, subsoil, or other superficial deposits, or even bedrock, occurring in arctic, subarctic, and alpine regions, at a variable depth beneath the Earth’s surface, in which a temperature below freezing has existed continuously for a long time. Indeed, in the areas with a freezing temperature, the compressional wave velocity is substantially increased and so, in a seismic response, the associated reflectors will be pulled-up as illustrated above. In the geological model, the change in the compressional wave velocity from 2840 m/s to 3360 m/s is due to the fact that water filling the pores in outcropping sediments is frozen. The thickness of the permafrost can range from over 1000 m in north to 30 cm in the south. Indeed, it underlies about one-fifth of the world’s land area.
The antiform geometry of the reflectors, induced by the higher velocity of the seismic waves through the sub-cropping freezing porous sediments, as depicted above, cannot be interpreted as a classic concentric sedimentary shortening. In fact, in a concentric folding the geometry of the layers change in depth till a detachment surface or a tectonic disharmony, which is not the case in the pitfall induced by permafrost zones.
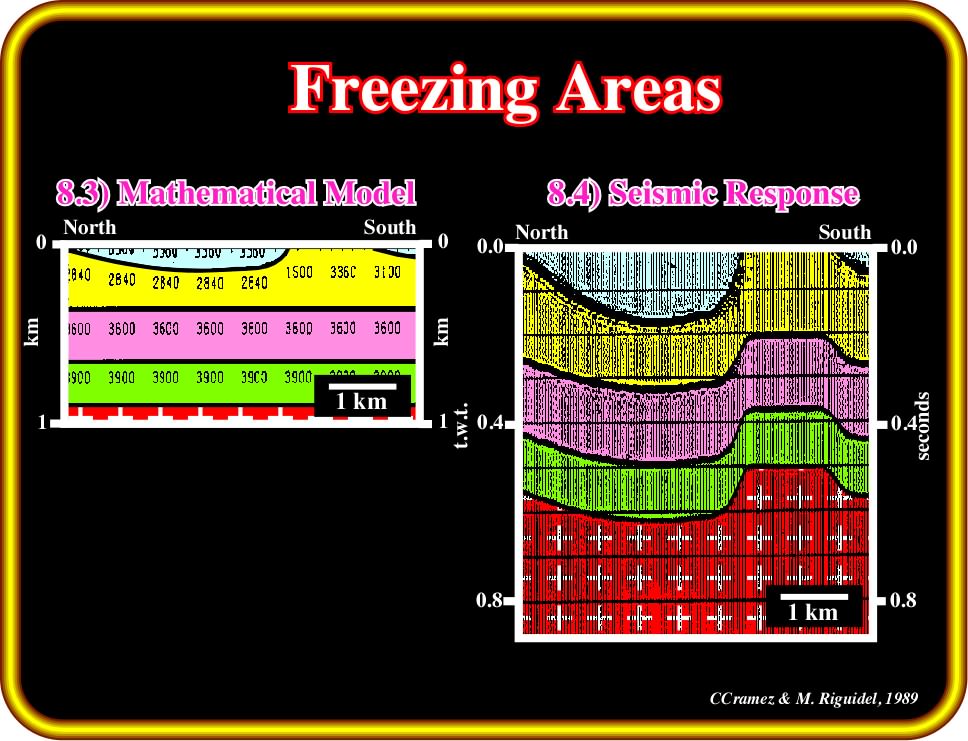
Plate 101- The seismic response of a geological model with freezing areas is more than evident. Actually, this particular seismic artifact is easily recognized by seismic interpreters having a minimum of tectonic knowledge. Indeed, theoretically speaking, a concentric fold (the thickness of strata is constant, when measured perpendicular to the bedding planes) cannot keep the same geometry in depth, since volume problems (Goguel’s law) increase with depth. In other words, when an interpreter recognizes on a seismic line an antiform structure that keeps the same shape in depth, they must suspect a seismic artifact, particularly if the seismic line comes from an area where permafrost is possible.
In order to understand the seismic response of synforms structures with different geometries we will show several velocity models and their associated seismic responses:
(i) Center of the Synform above Ground or Sea Level
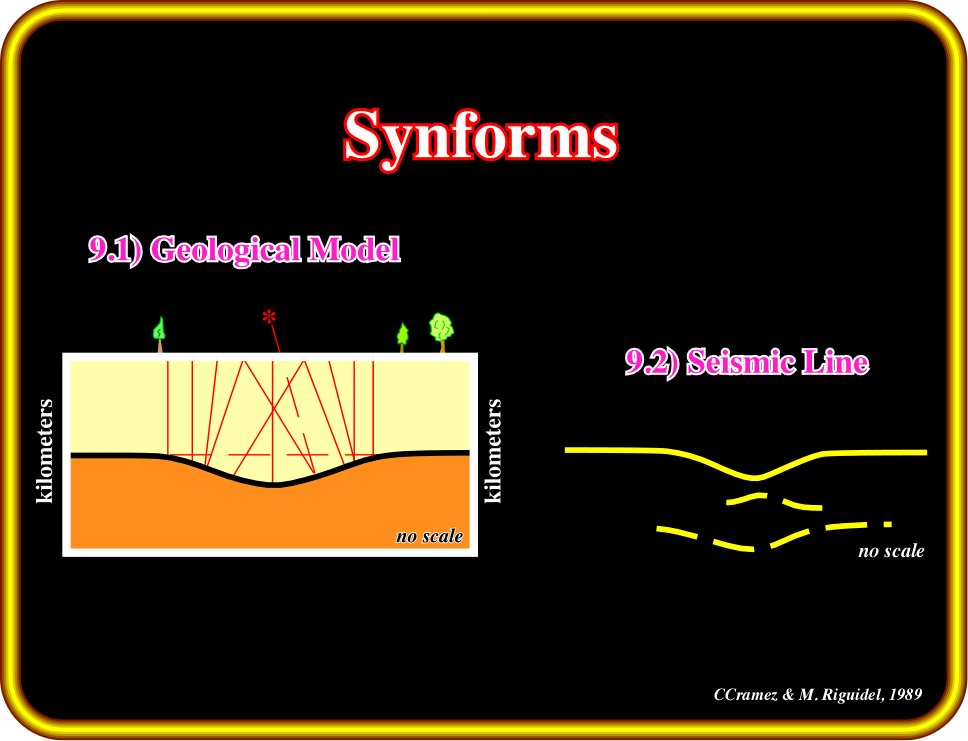
Plate 102- In this figure, on the left one can see a geological model of a synform and, on the right its seismic response on an unmigrated seismic line. In the geological model, the geometry of the synform (assuming the synform corresponds to an arc of circle) suggests that the center of the circle is above the ground.
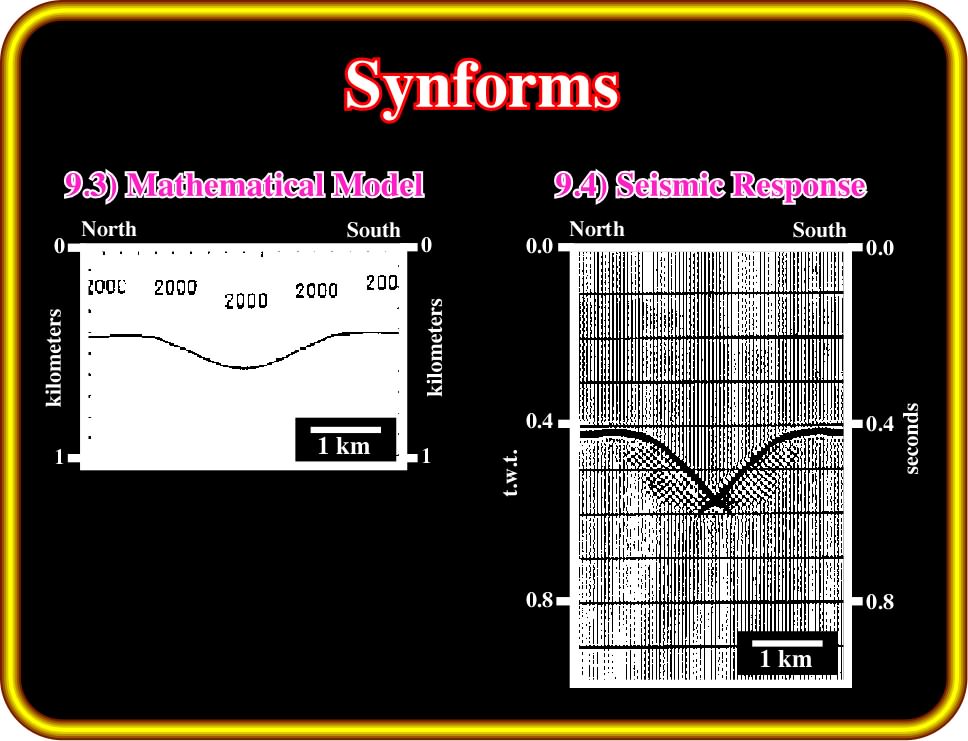
Plate 103- In the mathematical model of the previous geological model (circle centre of synform above the ground) the seismic velocity of the upper interval was assumed to be constant (2000 m/s ). On the seismic answer (unmigrated) the synform marker almost does not have any “moustache”.
(ii) Center of the Synform below Ground or Sea Level
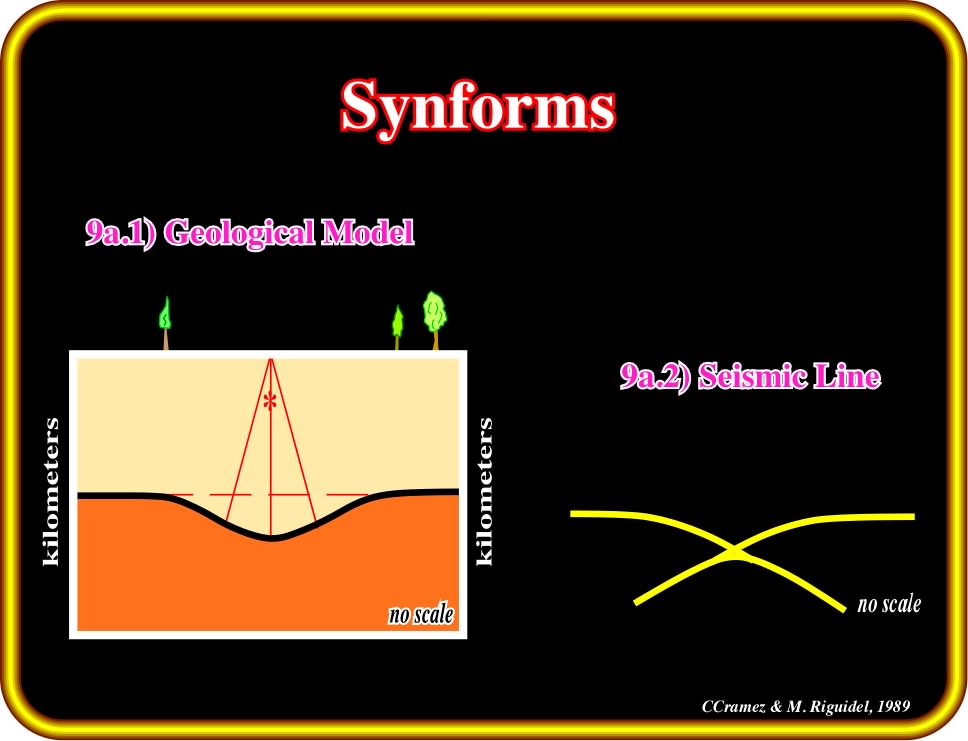
Plate 104- On this geological model, the center of the synform is below the Earth’s surface, near the top of the upper sedimentary package (yellow). Contrariwise of the previous seismic answer, in this case, the reflector associated with the synform interface shows a quite sharp and large “moustache”.
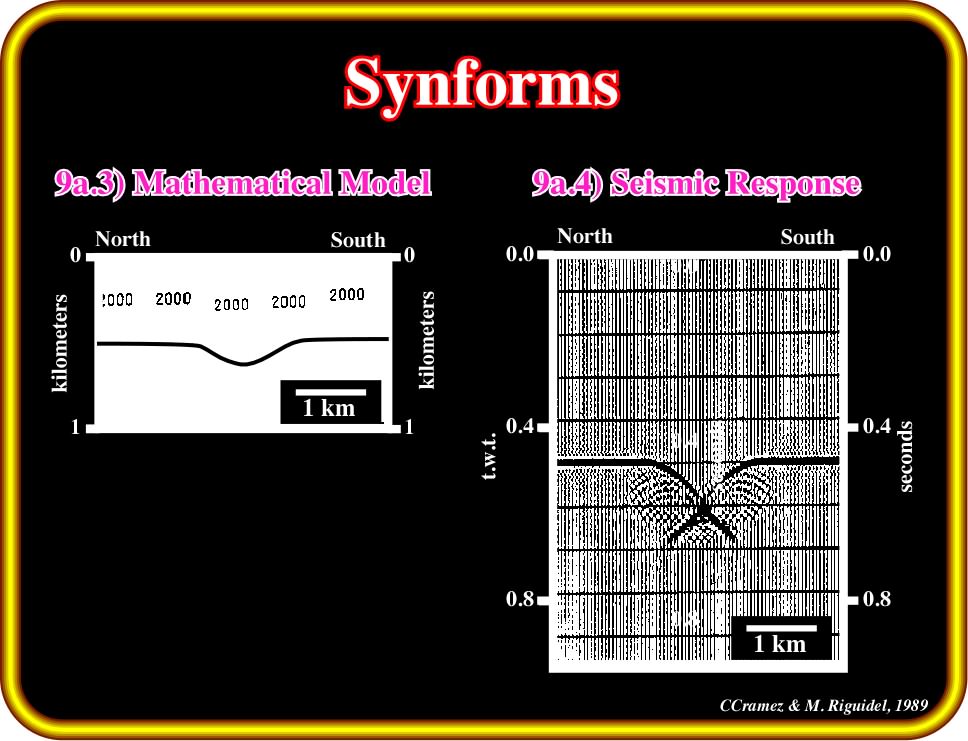
Plate 105- In relation to the previous mathematical model only the curvature of the synform was changed. In this particular instance the curvature center is under the Earth’s surface. The seismic response of the synform interface, on an unmigrated line, strongly suggest a significant “moustache”.
(iii) Center of the Synform at Ground or Sea Level
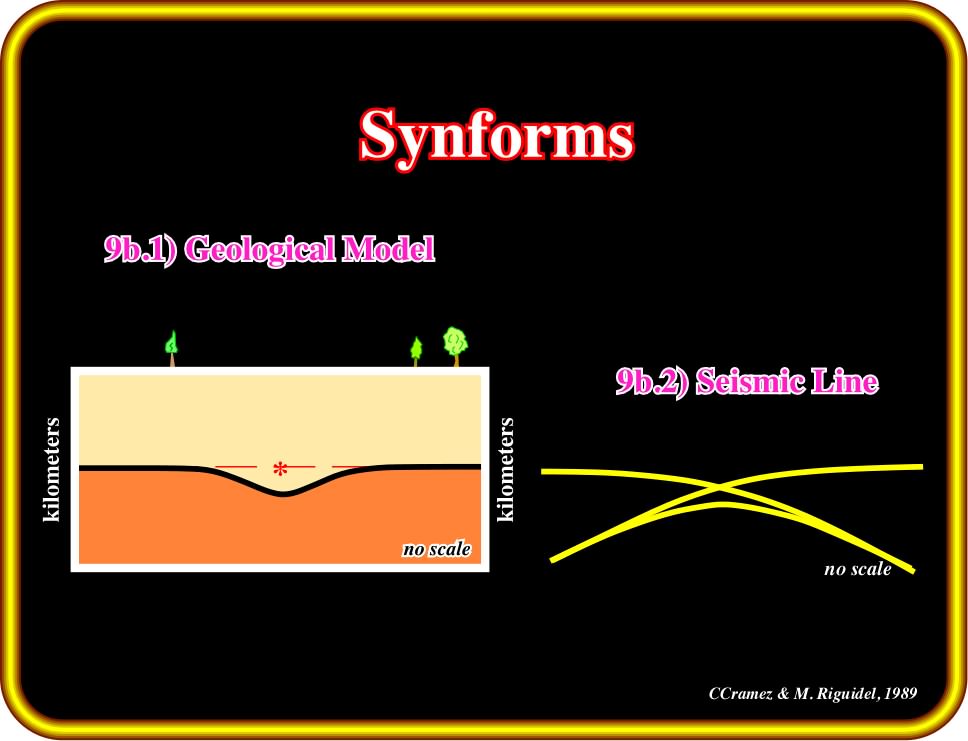
Fig. 106- In this geological model, the curvature centre of the synform is under the Earth’s surface, near the bottom of the upper sedimentary interval, that is to say deeper than in the previous example. The potential seismic answer of the synform interface, as expected, corresponds to a butterfly geometry (large “moustaches”).
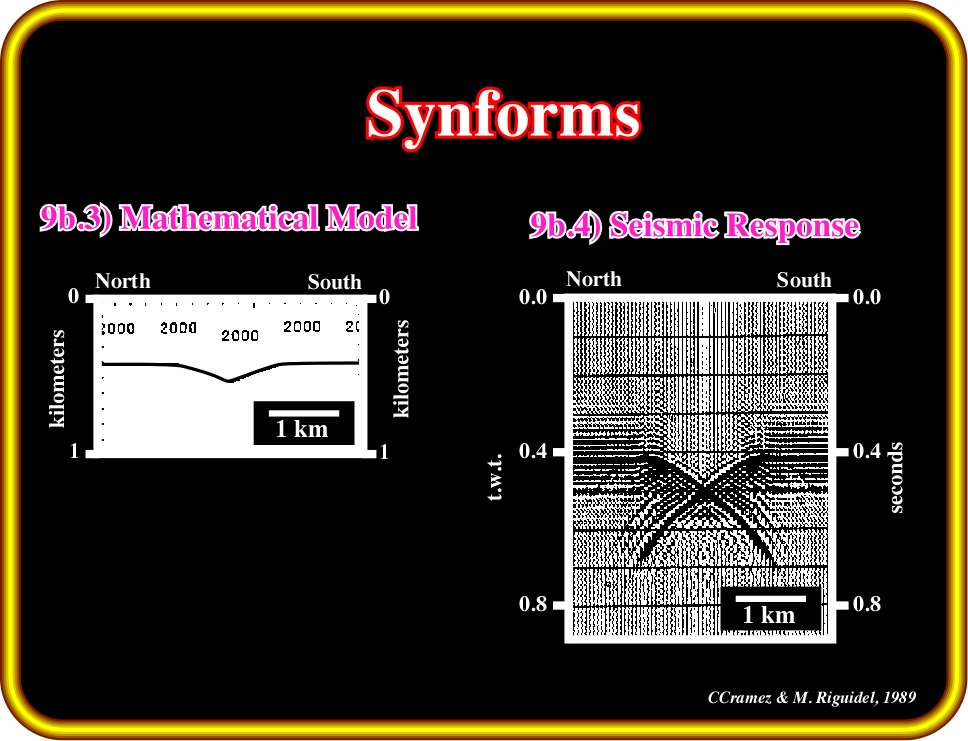
Plate 107- The seismic response to the mathematical model corroborates the previous predicted seismic answer. Indeed, the butterfly geometry is quite easily recognized on the above unmigrated seismic answer.
(iv) Synform with decreasing Curvatures
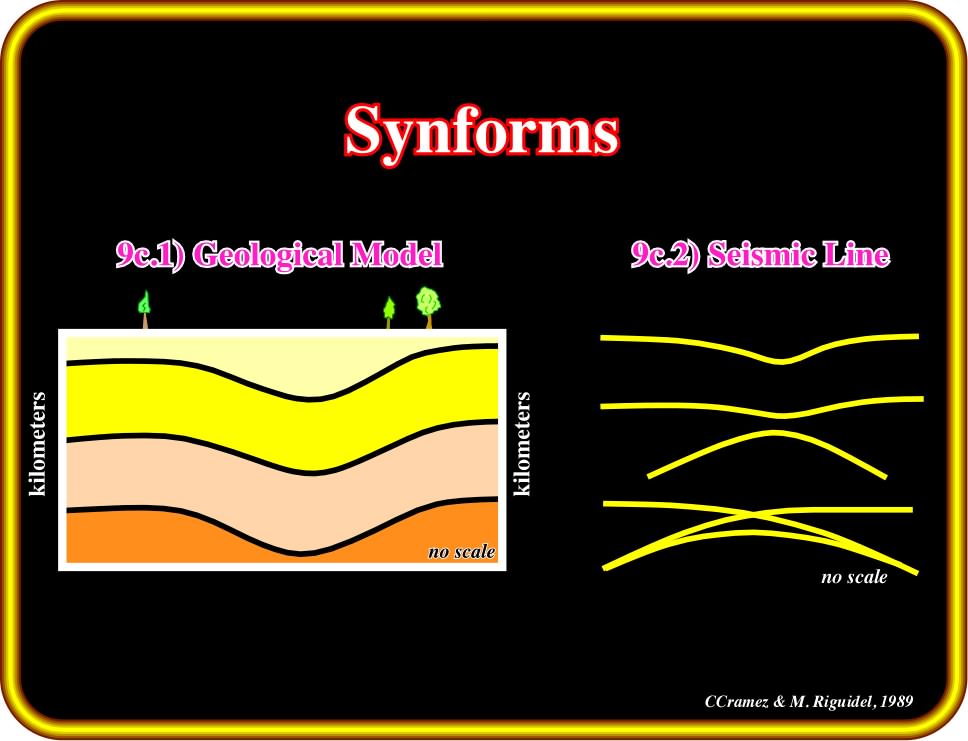
Plate 108- Finally, on this geological model, from bottom to top, there are three major synforms with decreasing curvatures, that is to say, the curvature center of the upper synform is located above the Earth’s surface, while the other are deeper in the ground. The likely seismic answer is, from top to bottom, a synform geometry without “moustaches”, with moustaches and with a butterfly geometry.
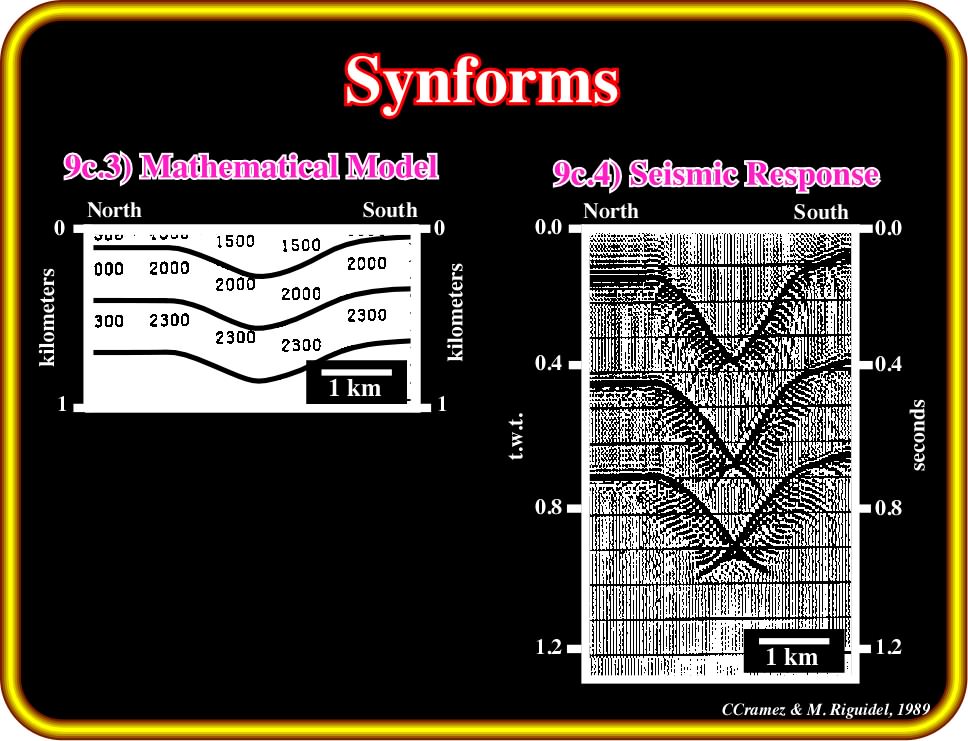
Plate. 109- In the mathematical model the sedimentary intervals have average velocities of 1500, 2000 and 2300 meters per second and decreasing curvatures. The unmigrated seismic response corresponds to the stacking of three synform reflectors. However, from top to bottom, they have different geometries: (i) without “moustaches”, (ii) with “moustaches” and (iii) butterfly like.
In conclusion:
In a unmigrated seismic lines, the presence of moustache or butterfly geometries associated with the apex of a synform can be used to determine the curvature (position center of synform, assuming that it correspond, roughly, to an arc of circle) of the synform:
- No moustaches means large curvature, center of the synform above ground or sea level ;
- Presence of moustaches means medium curvature, that is to say, a center of the synform is at the ground or sea level;
- A butterfly geometry means a small curvature, since the center of the synform is below the ground or sea level.
to continue press
![]()
Send E-mail to carloscramez@gmail.com with questions or comments about these notes (Seismic-Sequential Stratigraphy).
Copyright © 2003 CCramez
Last modification: September, 2014