
Universidade Fernando Pessoa
Porto, Portugal
Seismic-Sequential Stratigraphy

Plate 344 - The geometric relationships between the different chronostratigraphic lines of the final step of the model (step 30, i.e., at 0 ka) are depicted above. Onlap and toplap surfaces define the type I unconformities (red), while downlap surfaces are easily recognized above the slope fans (brown) and lowstand prograding wedge (purple), as well as above the lower sequence-cycle boundary, in the proximal parts of the basin. In a type I unconformity, the relative sea level fall is big enough to put the sea level below the shelf break. A type II unconformity is formed when the relative sea level fall is not big enough to expose all shelf, that is to say, the sea level fall but stays above the shelf break.
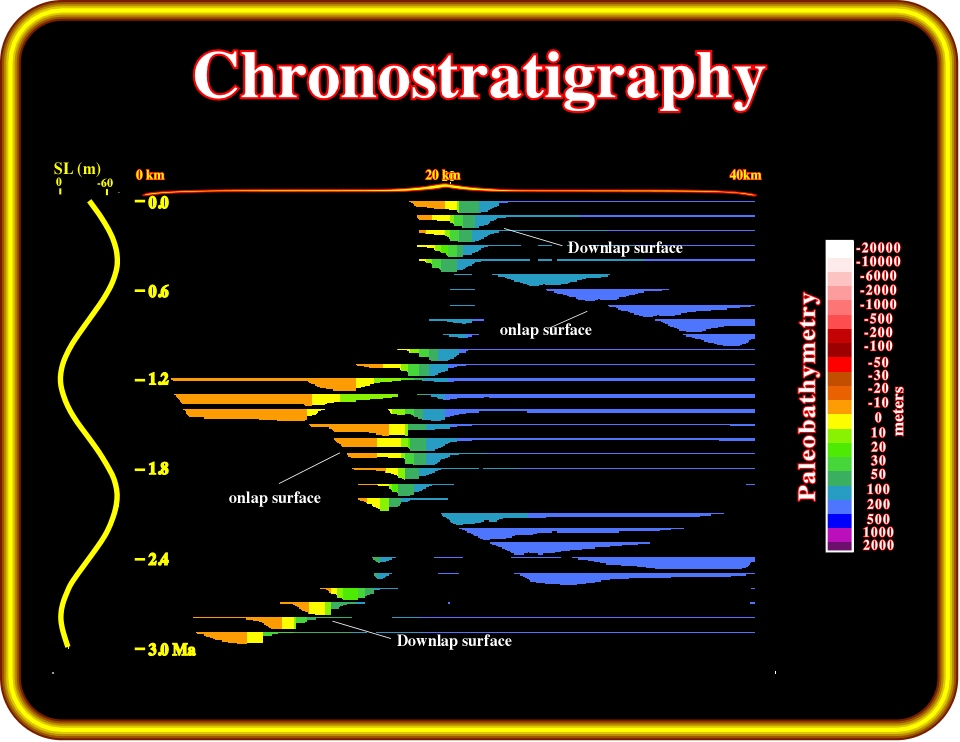
Plate 345 - On this chronostratigraphic chart, the reflection terminations, the hiatus (mainly depositional), as well as, the paleobathymetry of the mathematical model are depicted. The major onlap and downlap surfaces are indicated. The Paleobathymetry increases seaward, subsequently, the deep water onlap surfaces suggest basin or slope fans (BFF or SF).
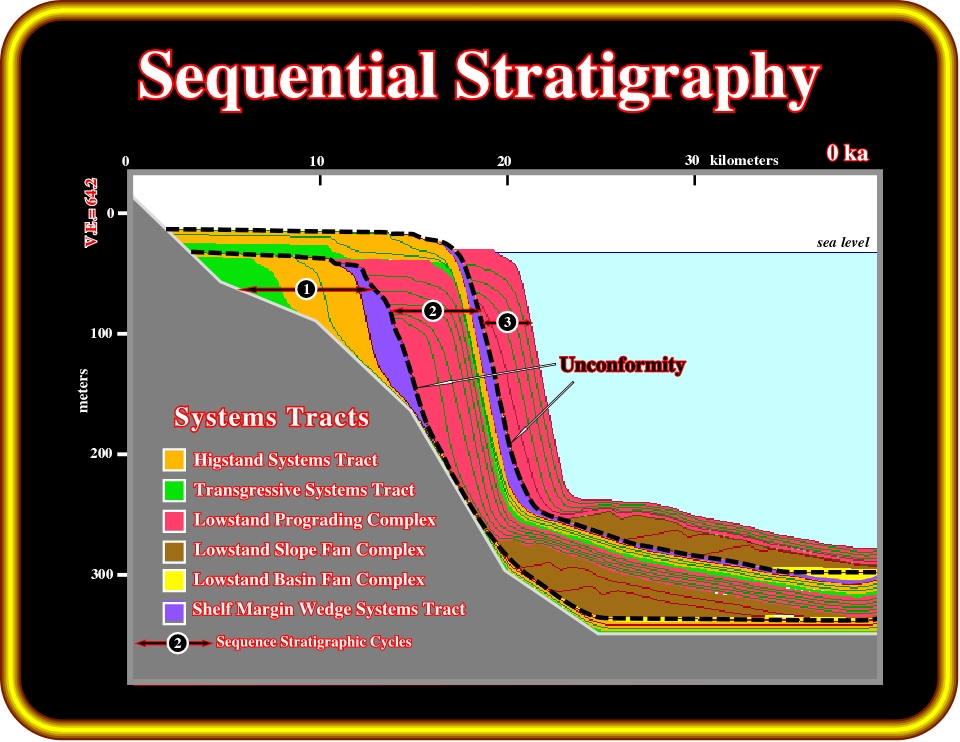
Plate 346 - The sequential stratigraphy of the mathematical model (3.0 - 0.0 Ma) put in evidence three sequence stratigraphic cycles. The oldest (steps 1-4) is incomplete. From bottom to top, a TST, a HST and a SMW compose it. The second sequence-cycle (steps 5-20) is complete. It is composed of a LST (BFF+SF+LPW), a TST and a HST. The third (21-30), which is not yet finished, is just represented by a LST.
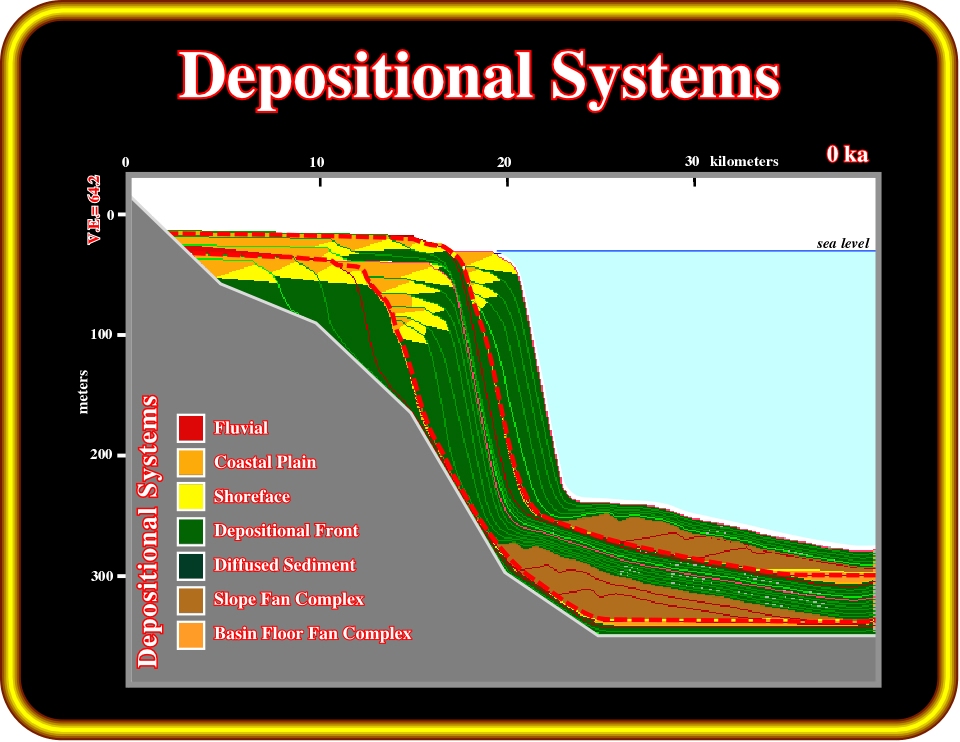
Plate 347- As each systems tract corresponds to a lateral linkage of coeval depositional systems, i.e., coeval facies, environmental and lithological predictions can be advanced. AS illustrated, in this sand-shale mathematical model, the following depositional environments can be predicted: (i) fluvial, (ii) coastal plain, (iii) shoreface, (iv) depositional front (slope) and (v) deep water (turbiditic deposits).
Plate 348- Systems tracts are composed of lateral assemblages of depositional systems, which are characterized by typical lithologies and depositional environments. On seismic data, and particularly in absence of amplitude and sedimentary anomalies, the recognition of sequence-cycles and associated systems tracts, is the best way to hypothesize the most likely location of potential reservoir-rocks.
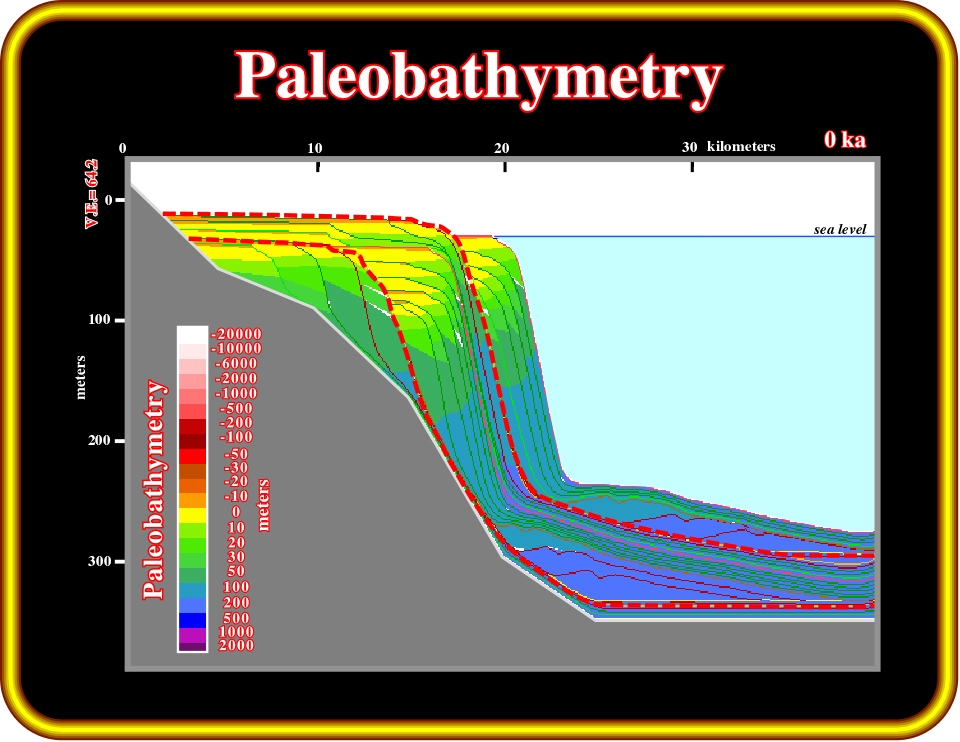
Plate 349- The paleobathymetry, i.e, the depositional water depth can be easily calculated. Assuming that landward of the depositional coastal break, the paleo-water depth is zero, the coastal plain can be taken as a datum plane. Therefore, at a given point, the depositional water depth corresponds to the depth of the point in relation to the coastal plain.
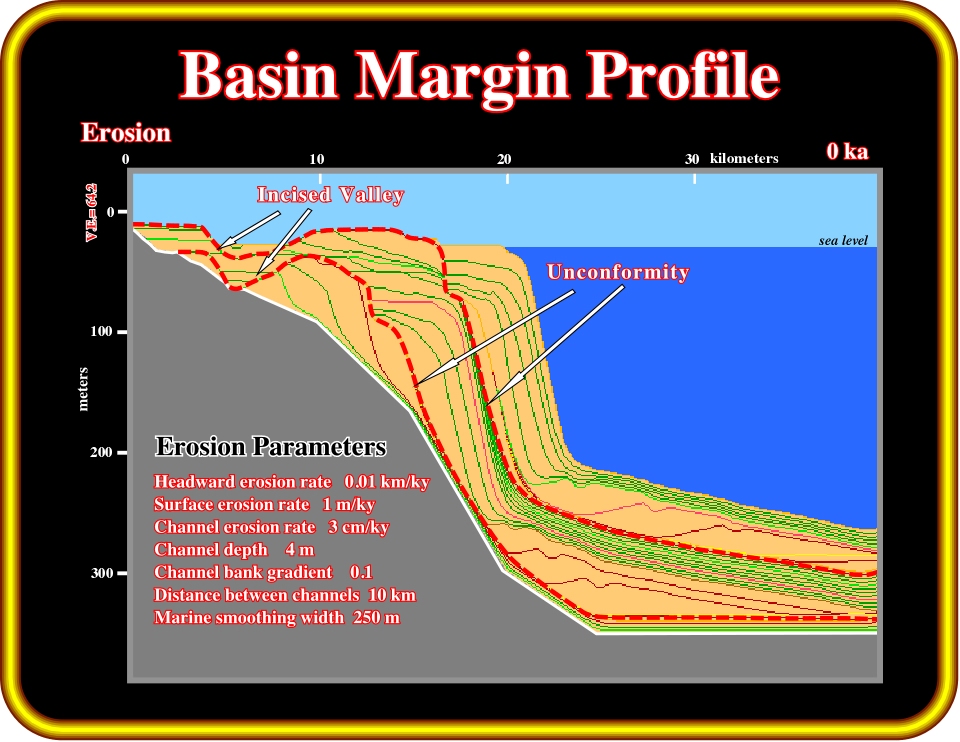
Plate 350 - In the previous mathematical model, erosion was ignored. Contrariwise, above, erosion was taken into account. Obviously, the picking of unconformities, particularly landward of the shelf break, is easier due to the presence of incised valleys (IV), which are mainly filled with LPW sediments. Seaward of the shelf break, where erosion is meaningless, there are no significant changes.
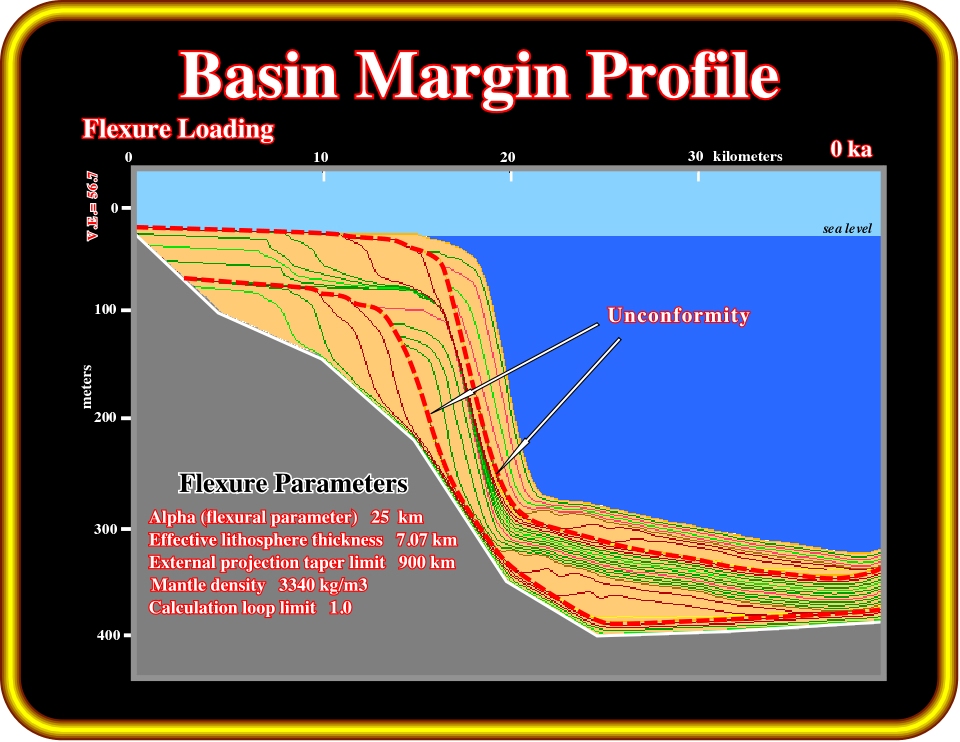
Plate 351 - In relation to the initial model, in which erosion was not taken into account, we have to introduce a flexure loading (see flexure parameters), i.e., the flexure of the substratum induced by the weight of the sediments, which changes the total subsidence. Relative to the initial model, the LST are less developed. Contrariwise, TST and HST, as illustrated in the next plates, are more developed.
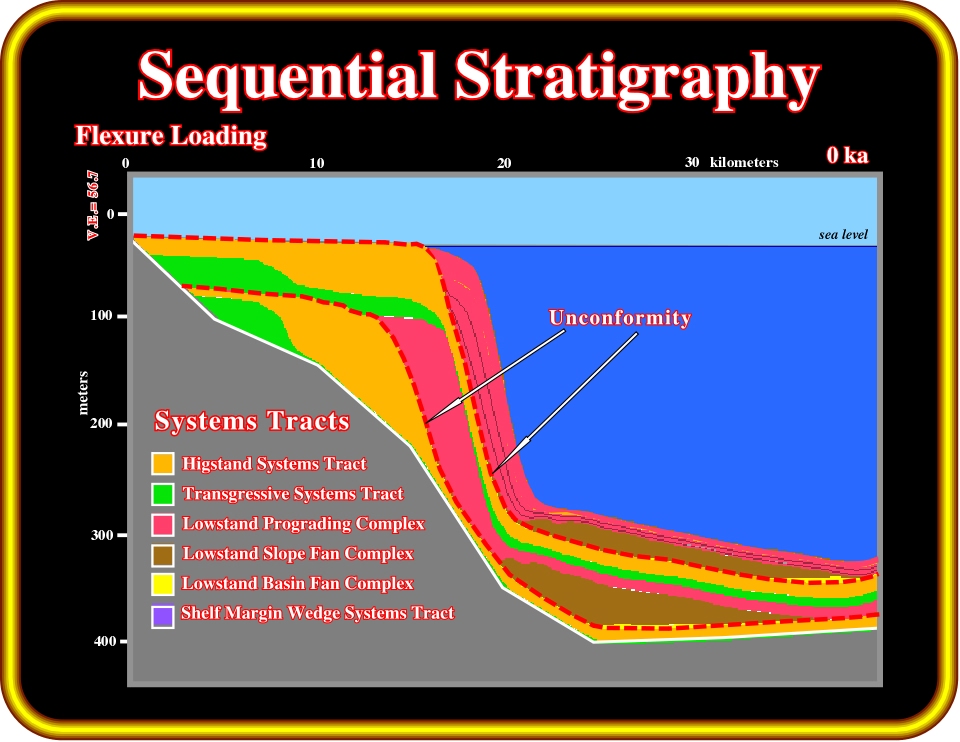
Plate 352- In relation to the initial model, the introduction of flexure loading slightly reduces the development of the lowstand systems tracts (LST). In the contrary, the transgressive (TST) and highstand systems tracts (HST) are better developed. Additionally, the backstepping geometry of the transgressive systems tract, particularly in the second sequence-cycle, is sharper.
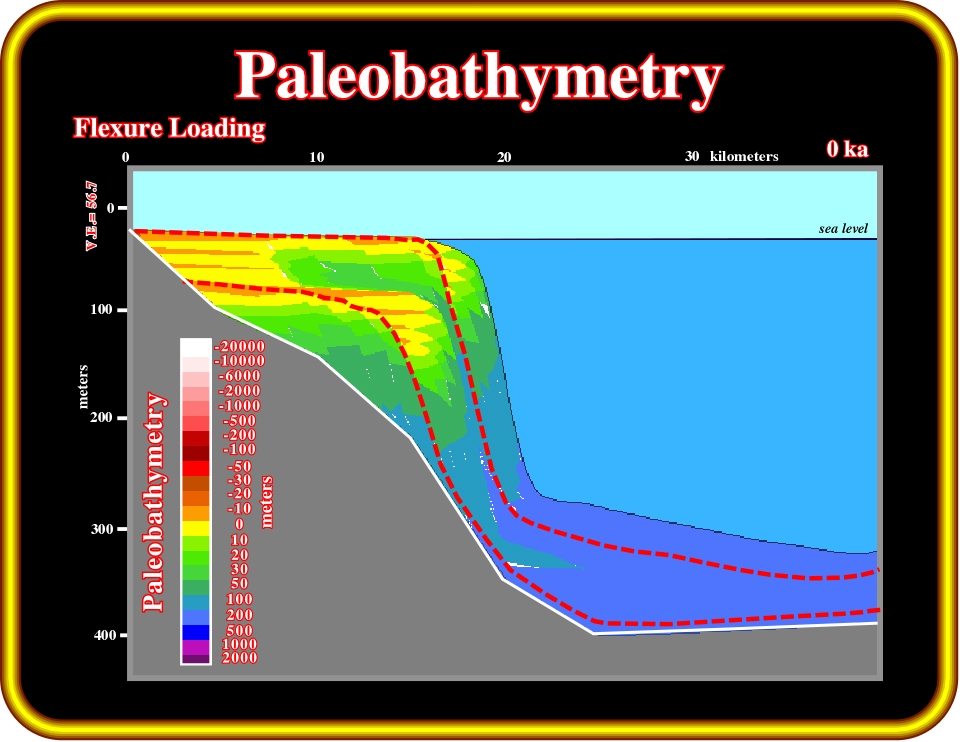
Plate 353 - The introduction of flexure loading in the initial model changes the paleobathymetry significantly. In relation to the paleobathymetry depicted in Plate 349 (no flexure loading), shallow water (coastal plain) deposits seem thicker. Also, shallow marine intervals look more developed. In the deep environments, there are no major changes.
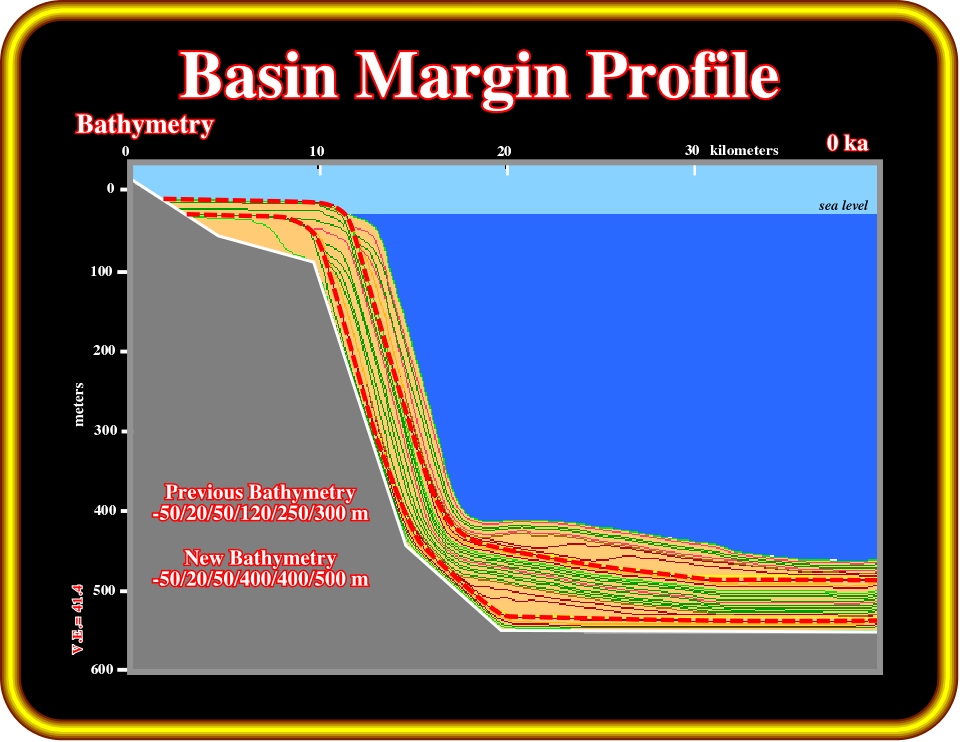
Plate 354 - As illustrated above, in this model, in relation to the initial model, we have changed the original bathymetry. The consequences of such a change are quite evident. In spite of the fact that we were obliged to change the vertical scale, it is important to notice that the outbuilding (around 13 km) is much smaller than in the original model (around 20 km, see Plate 349).
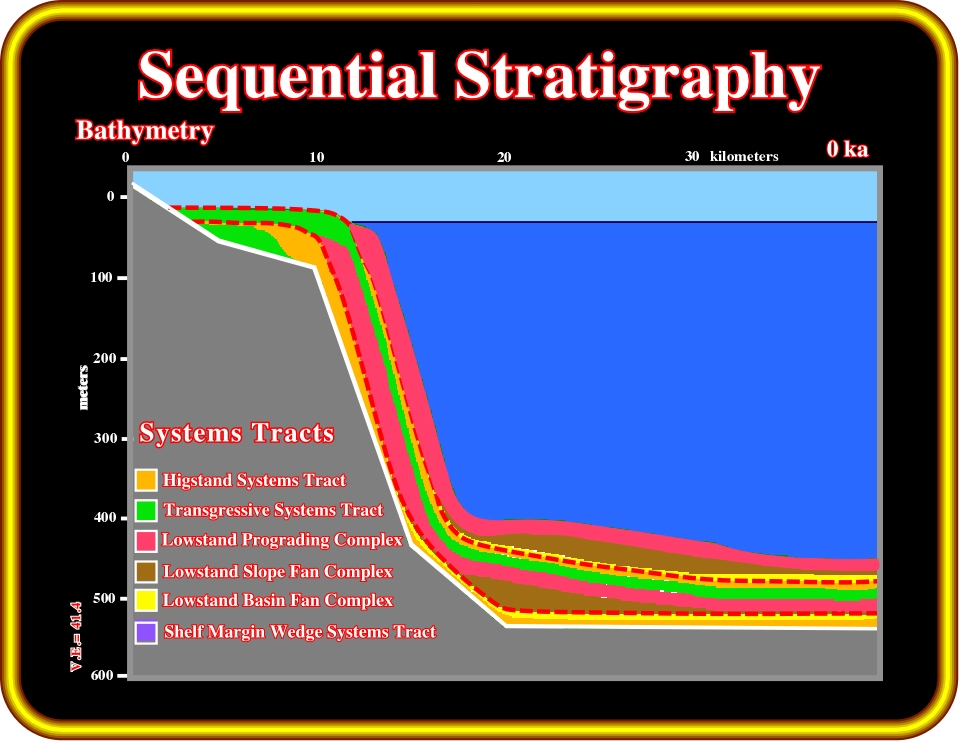
Plate 355 - In relation to the sequential stratigraphy of the initial model, changing the original bathymetry significantly modifies the position of the sequence boundaries as well as the development of the different systems tracts. It is interesting to notice that the highstand systems tracts (HST) are quite reduced.
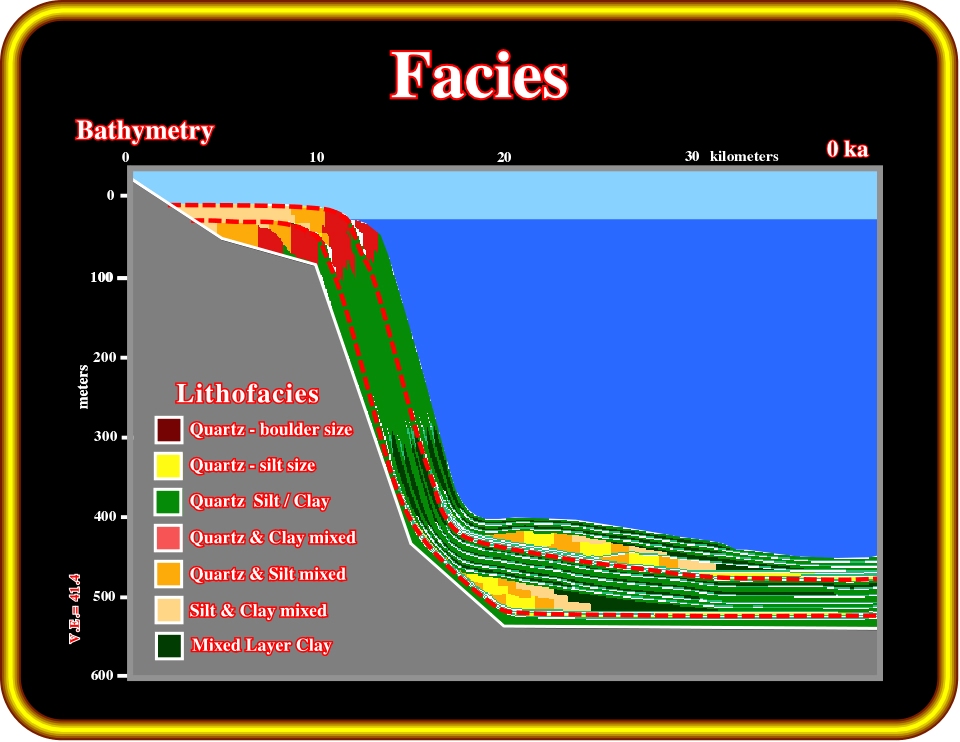
Plate 356 - The facies distribution follows the changes of the sequential stratigraphy depicted on Plate 355. The shallow water sediments are more restricted than in the original model. Contrariwise, the sandprone deep water sediments, and particular the basin floor fans, are more developed which balance the shallow water deficit. Note that in both models, the terrigeneous influx is the same.
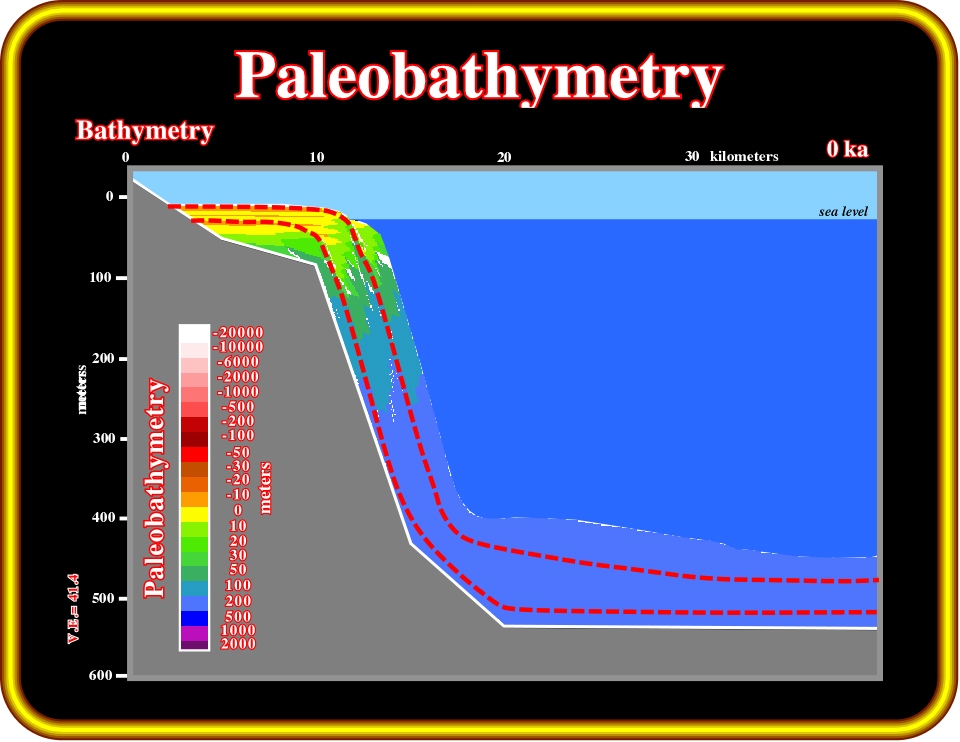
Plate 357 - The changing in the original bathymetry changed the depositional water depth. Taking into account the vertical scale, it is evident that shallow water sediments are much less developed than in the original model.
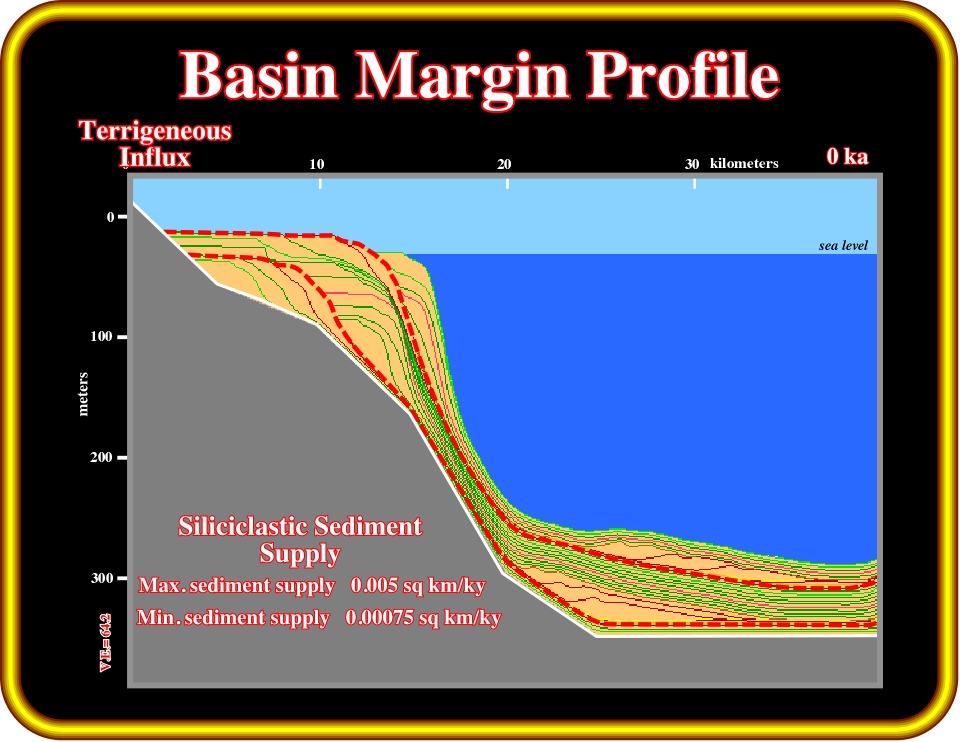
Plate 358 - On this model, the siliciclastic sediment supply was reduced to 50% in relation to the initial model. Comparing both models (see Plate 349), the changes are quite evident. Fundamentally, the outbuilding of the shallow water sediments is here more reduced, as well as the upbuilding of the deep-water sediments. The geometry of unconformities and systems tracts is roughly the same.
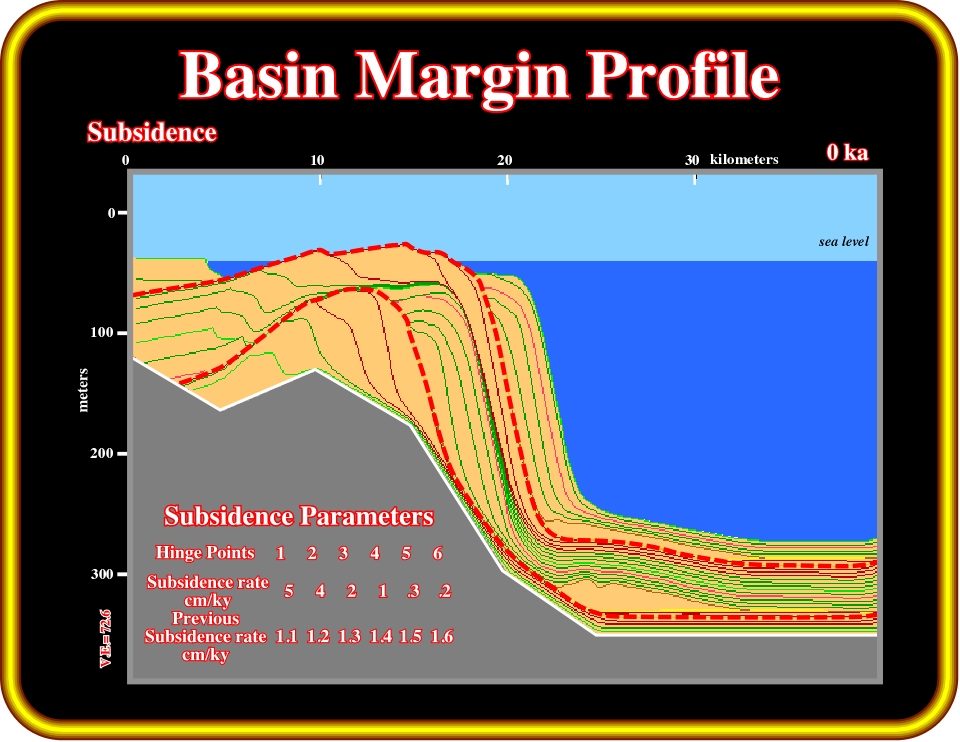
Plate 359 - On this model, we have changed the subsidence. As indicated, we have introduced a seaward decreasing subsidence (5 / 4 / 2 / 1 / 0.3 / 0.2). The consequences of such changes are more than obvious. The geometry of the sequence boundaries is quite different as the sequential stratigraphy (see next plates). Notice that several type II unconformities can be recognized.
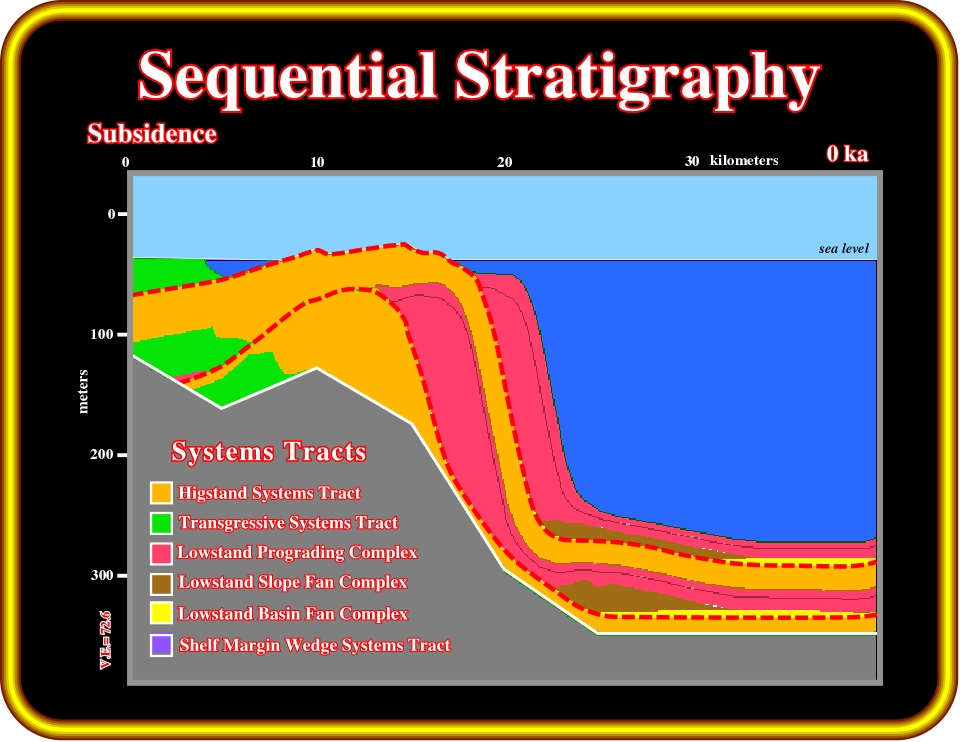
Plate 360- From the previous Plate, where the geometry of the chronostratigraphic lines is depicted, the above sequential stratigraphy can be deducted. The development of the transgressive (TST) and highstand systems tracts (HST), particularly in the proximal parts of the basin, where the subsidence is higher.
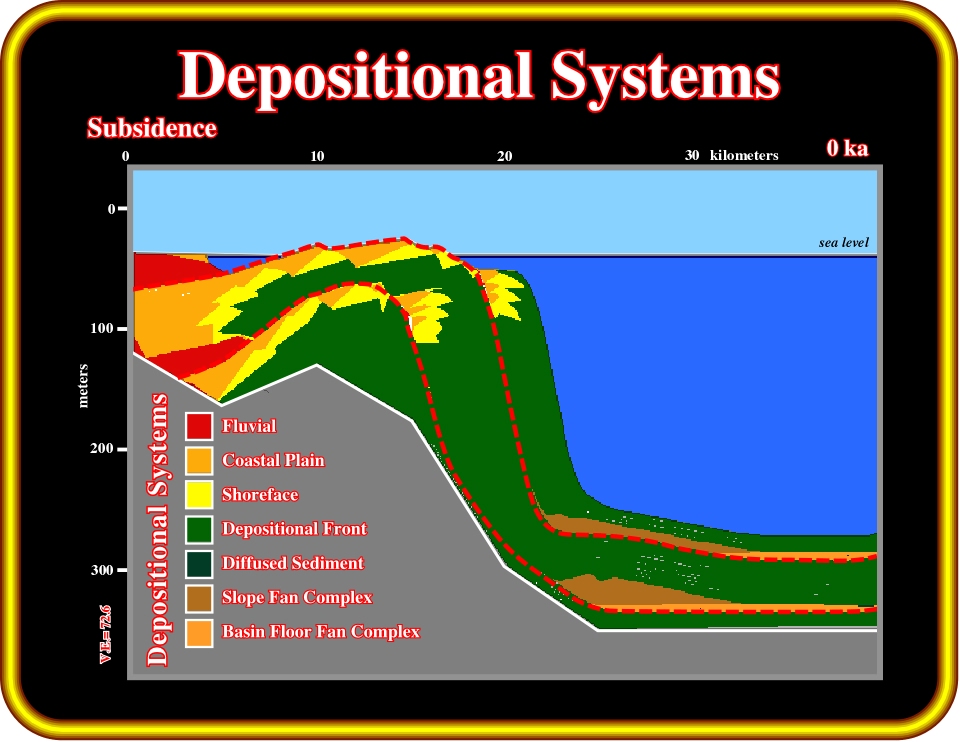
Plate 361- The depositional environments illustrated on this plate can be easily deducted from the sequential stratigraphy shown in Plate 360, taking into account that the paleo-water depth, which can be calculated relative to the coastal plain, where the paleo-water depth is assumed to be zero (see Plate 362).
to continue press![]()
![]()