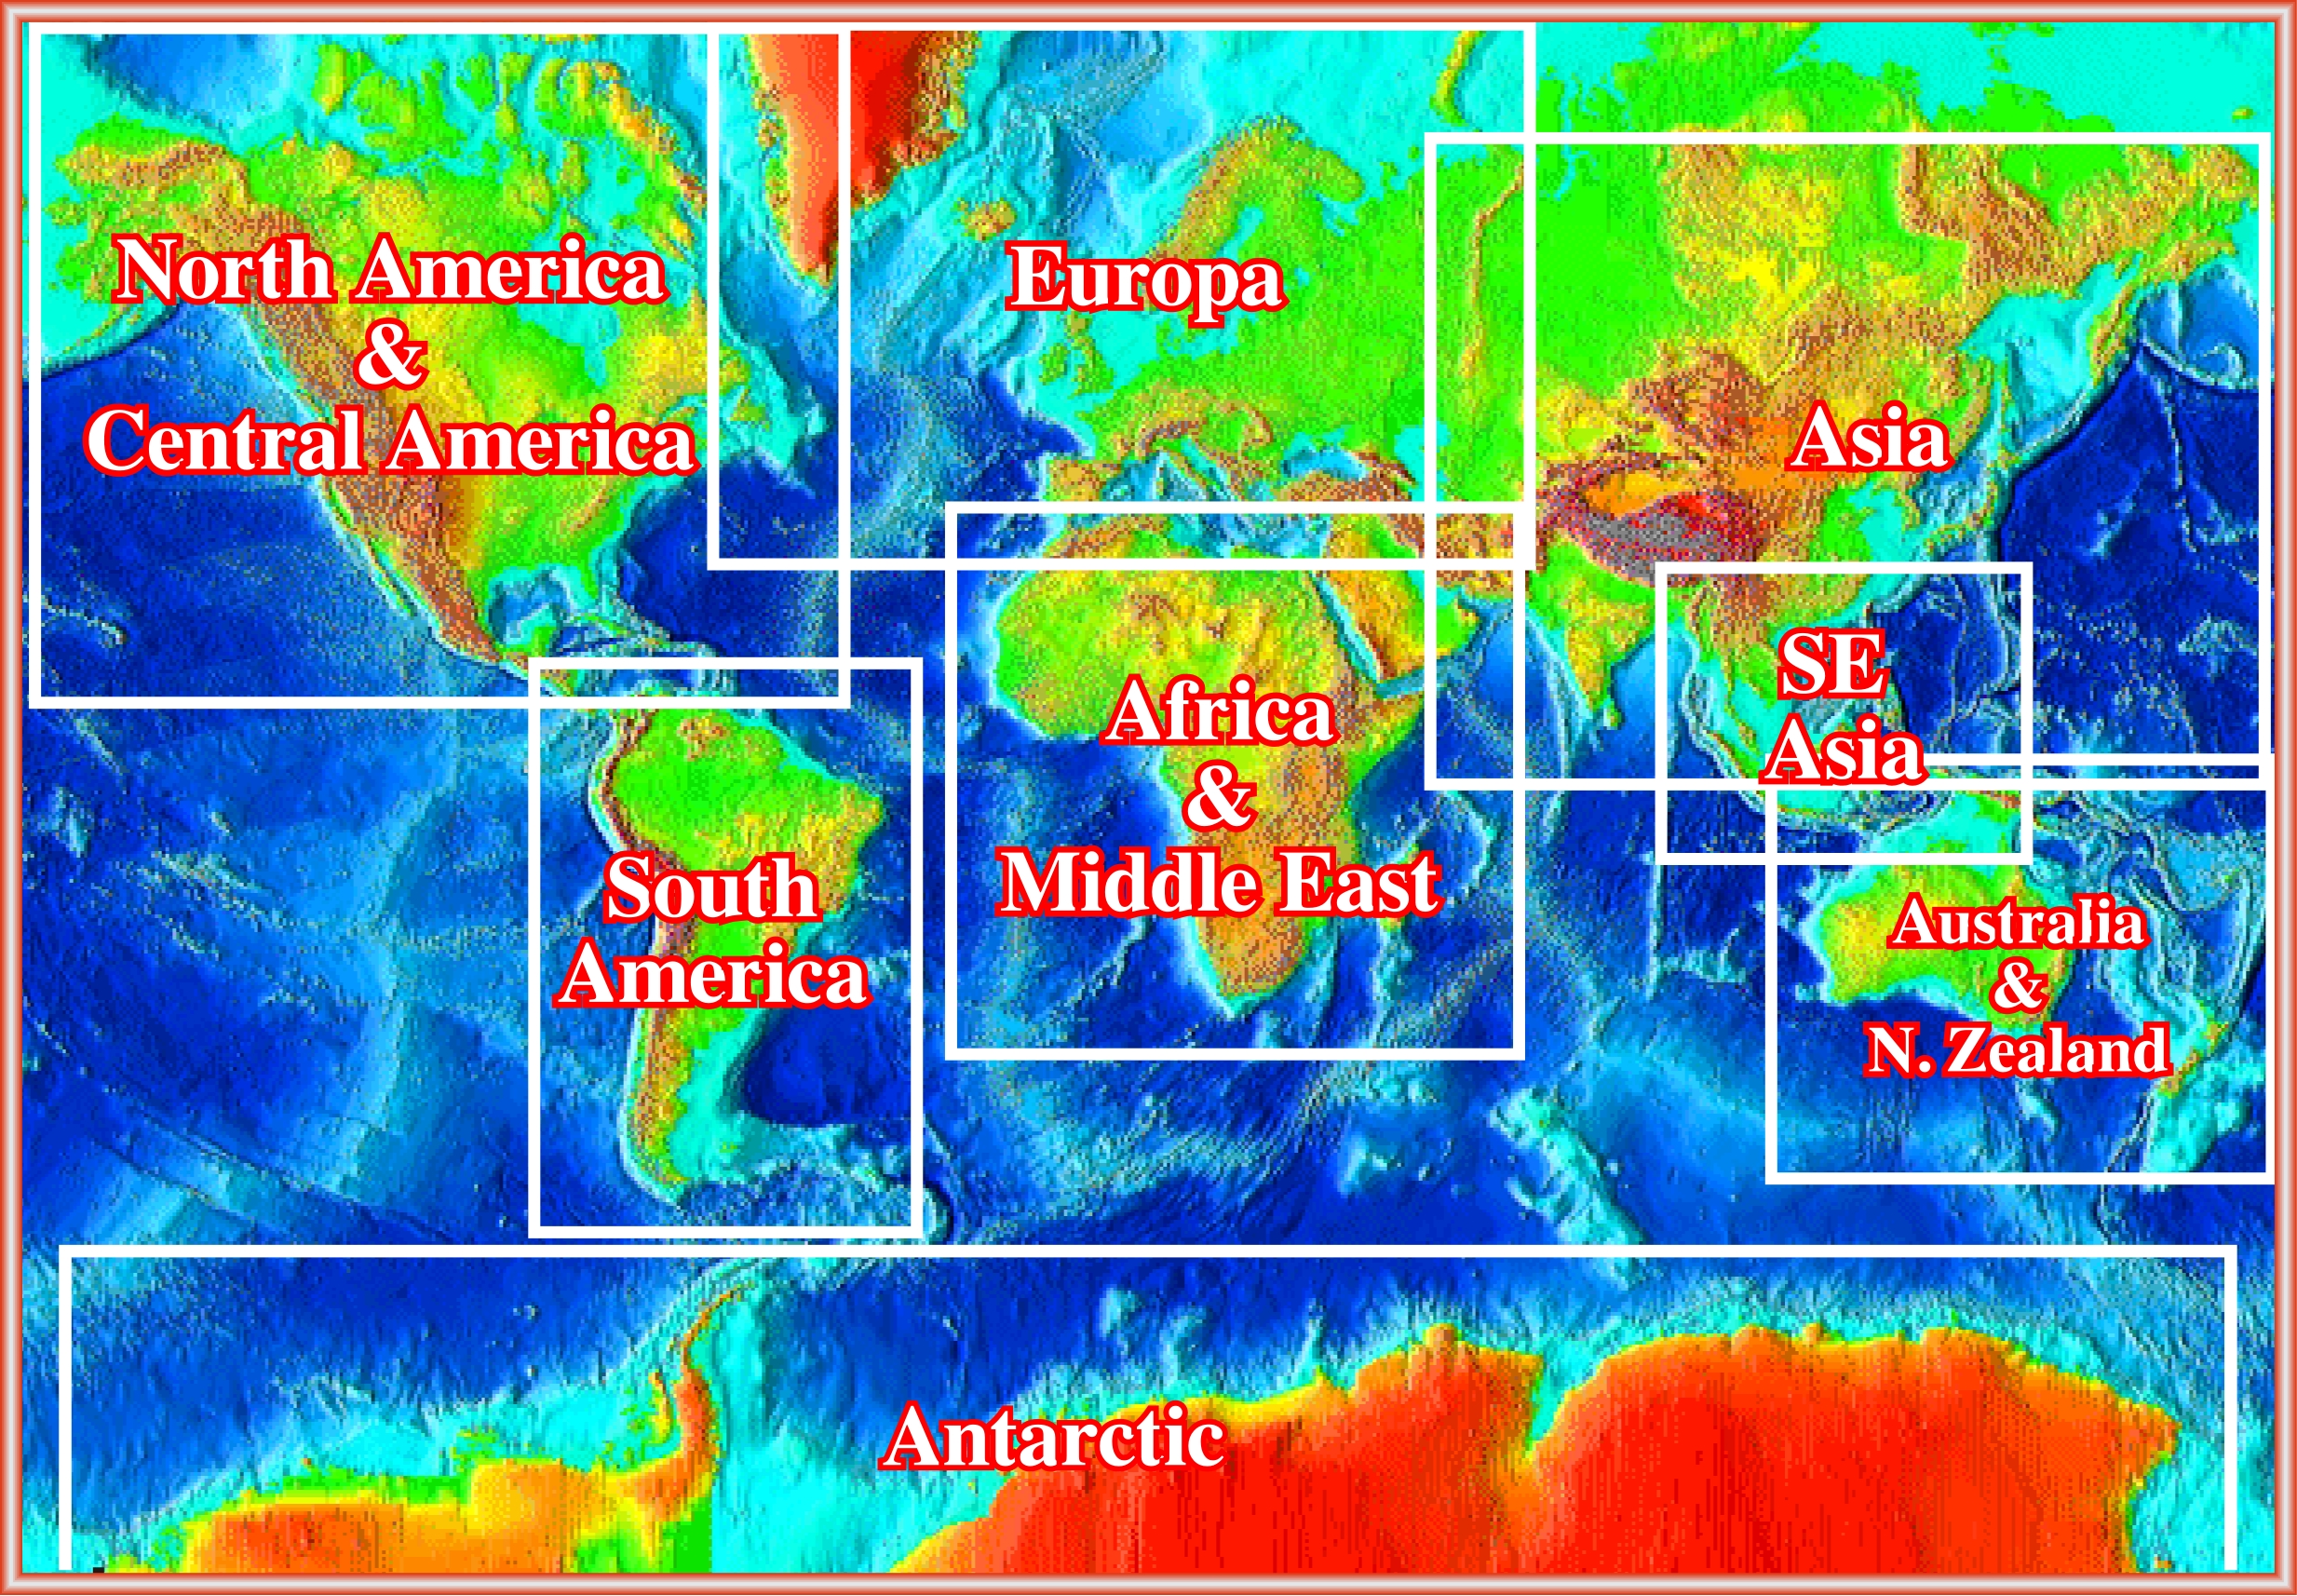
Click on the area in which you are interested to see, mainly, Canvas autotraces of the principal available, deepwater seismic lines . A detailed map with the location and autotraces will be opened.
Different projections are needed to create maps. All the projections distort, more or less, the surface that is wanted to represent. Function of map purpose, some distortions are acceptable and others are not. That is why there are different projections in order to preserve certain properties of the projected surface to the detriment of others. In this seismic atlas, we have used Google Maps, which is a Mercator projection based on a spherical datum (in the ESRI parlance, datum = “Geographic Coordinate System ; GCS”), i.e., a modification of the WGS84 datum (global geodetic system composed of a coordinate system, a reference ellipsoid, a geoid, which used GPS satellite positioning system) to show the approximative locations of geological cross-section and Canvas autotrace tentative geological interpretations. Remind, a Mercator projection, i.e., representation of the spatial coordinates relative to the three dimensions of the terrestrial globe in a two-dimensional planisphere (even if markedly deformed such projection is an unfolding at the level of the terrestrial equator, of the longitude scales integrated into its latitudes).
![]()
Send E-mails to carlos.cramez@bluewin.ch with comments and suggestions to improve this atlas.
Copyright © 2001 CCramez
Last update:
2022
![]()