

5) Geometrical Relations & Seismic Surfaces
The geometrical relationships between seismic reflectors and seismic surfaces defined, by reflections terminations, have a geological meaning just in its original depositional position.
Three major geometrical relationships (figure 021) between stratal surfaces or associated seismic reflections, can be recognized :
(i) Onlap ;
(ii) Toplap and
(iii) Downlap.
Onlap can be defined as a base-discordant relation, in which initially horizontal strata (at deposition time) terminate, progressively, against an initially inclined surface or in which initially inclined strata terminate, progressively, updip against a surface of greater initial inclination. Onlapping can be :
a) Proximal, when it corresponds to a landward onlap ;
b) Coastal, when it concerns coastal plain sediments ;
c) Marine, when it concerns marine sediments ;
d) Mechanical, when it is induced by tectonics (e.g.: faulting).Sedimentary onlapping is characterized by:
1) Aggradation, which corresponds to the vertical component between two consecutive onlaps and
2) Encroachment, which corresponds to the horizontal component between two consecutive onlap.
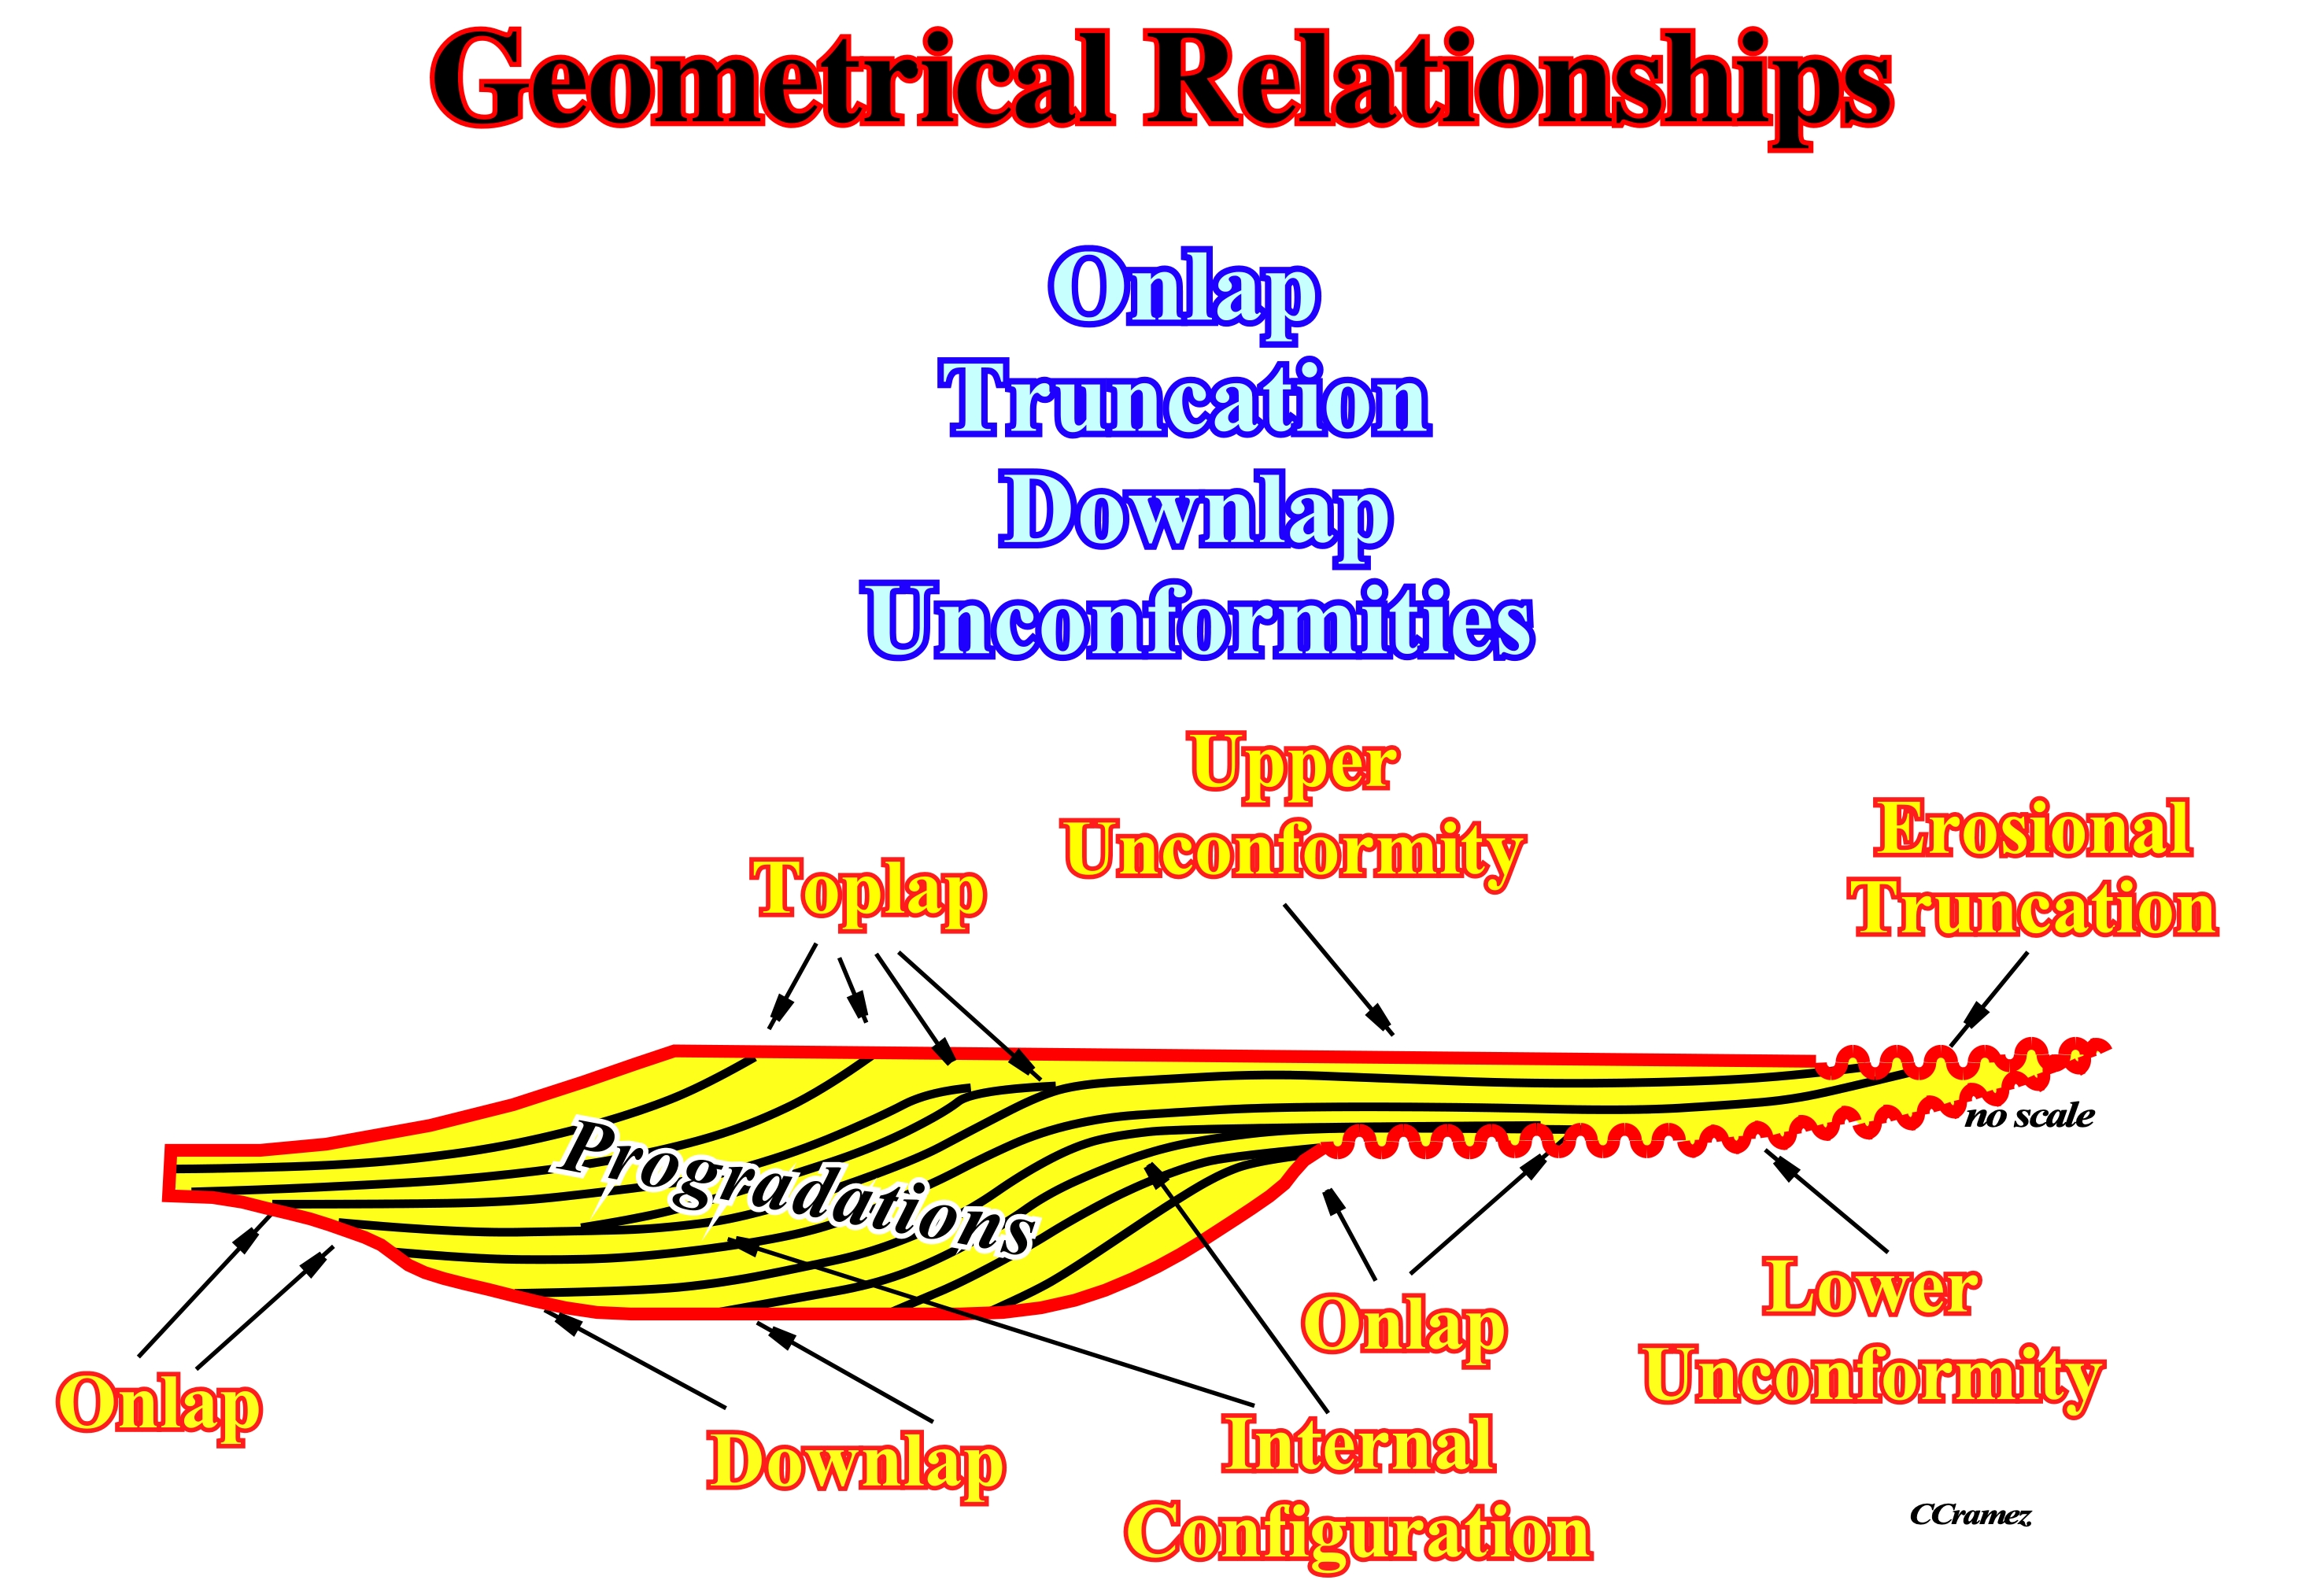
Figure 021- On this theoretical geological sketch, which is supposed to represent a continental encroachment subcycle bounded by two unconformities, i.e., bounded by two erosional surfaces induced by two relative sea levels falls, all geometrical relationships between stratal set or between the associated seismic horizons, at the depositional time, are illustrated. Onlaps, which can be proximal or distal are evident on the lower boundary of the stratigraphic cycle, as well as, downlaps, while toplaps are associated with the upper boundary. The seismic surface defined by successive onlaps is a onlapping surface. Similarly downlap and toplap surfaces may be considered. Truncation can be just associated with the unconformities bounding the stratigraphic interval, since they are erosional surfaces. The internal configuration, i.e., the geometry of the infilling, which can be parallel, sigmoidal or oblique, is here a combination of sigmoidal time lines (upbuilding and outbuilding) and oblique time lines (outbuilding without upbuilding).
A Toplap is a termination of strata against an overlying surface. Toplaps occur along the upper interval boundary. The term toplap is used when it results of non-depositional process (sedimentary bypass) with only minor erosion. Downdip of a toplap there is always a downlap or an apparent downlap. Toplap is mainly associated with coastal deposits (coastal toplaps). When a toplap is induced by erosion it is called truncation. Truncation corresponds to a termination of strata or seismic reflection, interpreted as strata, along an unconformity surface due to post-depositional erosional. Truncation, as toplapping, occurs along the upper interval boundary. Truncation implies deposition of strata and their subsequent removal to form an unconformity surface.
A Downlap is a base discordant relation in which initially inclined strata terminated downdip against an, initially, horizontal or inclined surface. A downlap geometrical relationship indicates the direction away from the source of terrigeneous supply. A seismic downlap is a downlap interpreted on a seismic section, i.e., a relation in which a seismic reflection, interpreted as initially inclined strata, terminates downdip against a reflection discontinuity interpreted as an initially inclined or horizontal sedimentary discontinuity, which can be : (i) A flooding surface ; (ii) A complex transgressive backstepping surface ; (iii) An unconformity or (iv) A paraconformity (conformity with an important hiatus).
There are two kind of apparent downlaps :
(i) Those created by tectonics (particularly by halokinesis and shalokinesis), which correspond, very often, to tilted onlaps due the salt or shale flowage and
(ii) Those induced by seismic resolution, i.e., seismic reflections, representing units of inclined or tangential strata, can terminate downdip, but the strata themselves, actually, flatten and continue as units, which are so thin that they fall below the seismic resolution.
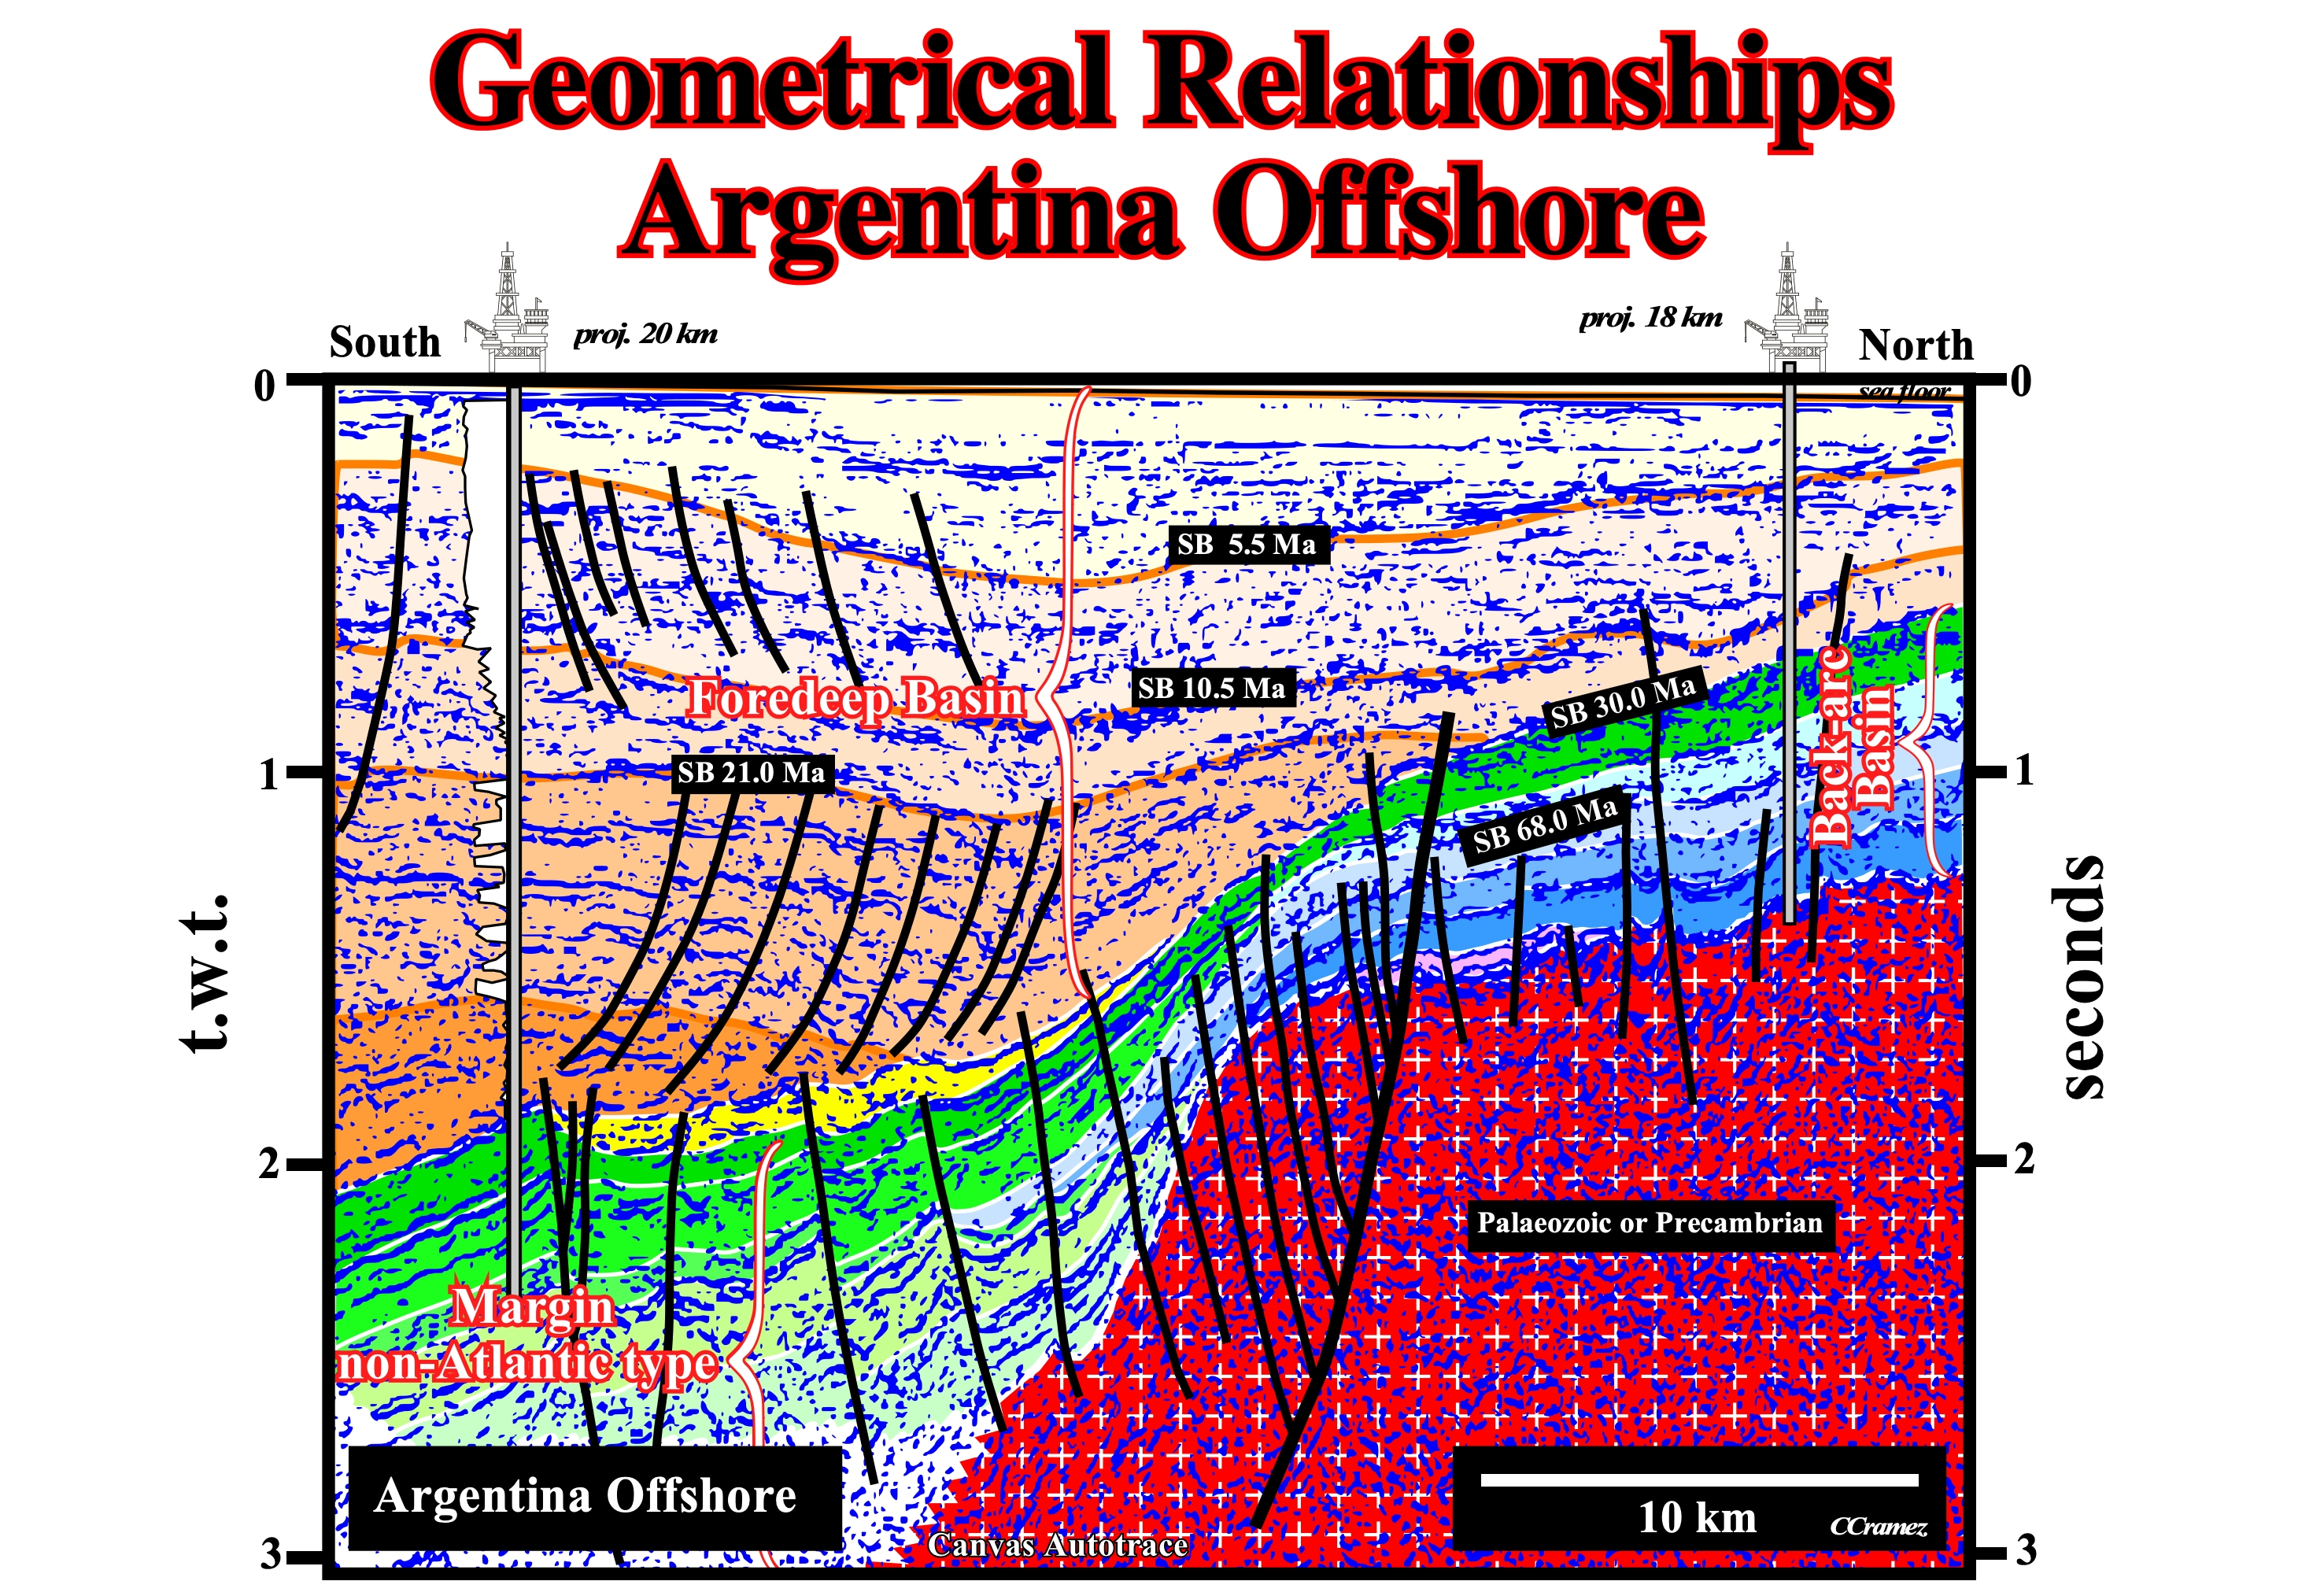
Figure 022- On this tentative geological interpretation of a seismic line from the South Argentina offshore, in which the different sedimentary basins, forming this offshore, are, easily, recognized. From bottom to top, they are: (i) Paleozoic or Precambrian folded belt ; (ii) Backarc basin ; (iii) Divergent margin non-Atlantic type developed in association with the oceanization of a marginal sea, and (iv) a Foredeep. All geometrical relationships between the seismic reflectors are true. They are, almost, undeformed, so, they have, roughly, the same geometry that at depositional time. Consequently, on this tentative interpretation, one can say successive onlaps indicate a positive aggradation, while a seaward displacement of the coastal onlaps indicate a negative aggradation or, in other words, an unconformity induced by a relative sea level fall. By the same token, downlaps indicate, generally, the direction and provenance of the terrigeneous influx, while toplaps and, particularly, erosional truncations emphasize, usually, the boundaries of the stratigraphic cycles.
A stratigraphic surface can be considered as a continuous physical boundary. At least four major groups of stratigraphic surfaces can be observed in the field or on seismic data:
(i) Stratal Surfaces, as bedding planes and chronostratigraphic seismic reflectors. A seismic reflector represents a, more or less, thick sedimentary interval ; the thickness of such interval depends on seismic resolution, which ranges between 10 and 50 m.
(ii) Discontinuity Surfaces, which are physical surfaces caused by erosion or by non-deposition. In the discontinuity surfaces are included :
a) Unconformities, caused by erosion (relative sea level fall) ;
b) Paraconformities, which separated parallel layers with a hiatus of non-deposition and
c) Depositional hiatuses, which can be defined by :- A Toplap / Downlap interface indicates, respectively, a subaerial environment over a subaqueous depositional environment ;
- A Downlap / Apparent Truncation interface indicates, respectively, a subaqueous over a subaqueous depositional environments and
- An Onlap / Conformable interface indicates two a subaqueous , which separates depositional environments.(iii) Diachronous Surface, which separates rocks of significantly different environments or lithology. Such surfaces step across stratal surface. They include retrogradational transgressive surfaces (backstepping) and, on seismic data, the reflectors associated with gas / oil-water plane contact (“brightspots").
(iv) Synchronous surface, which separate rocks of significantly different environments or lithology but parallel to stratal surfaces.
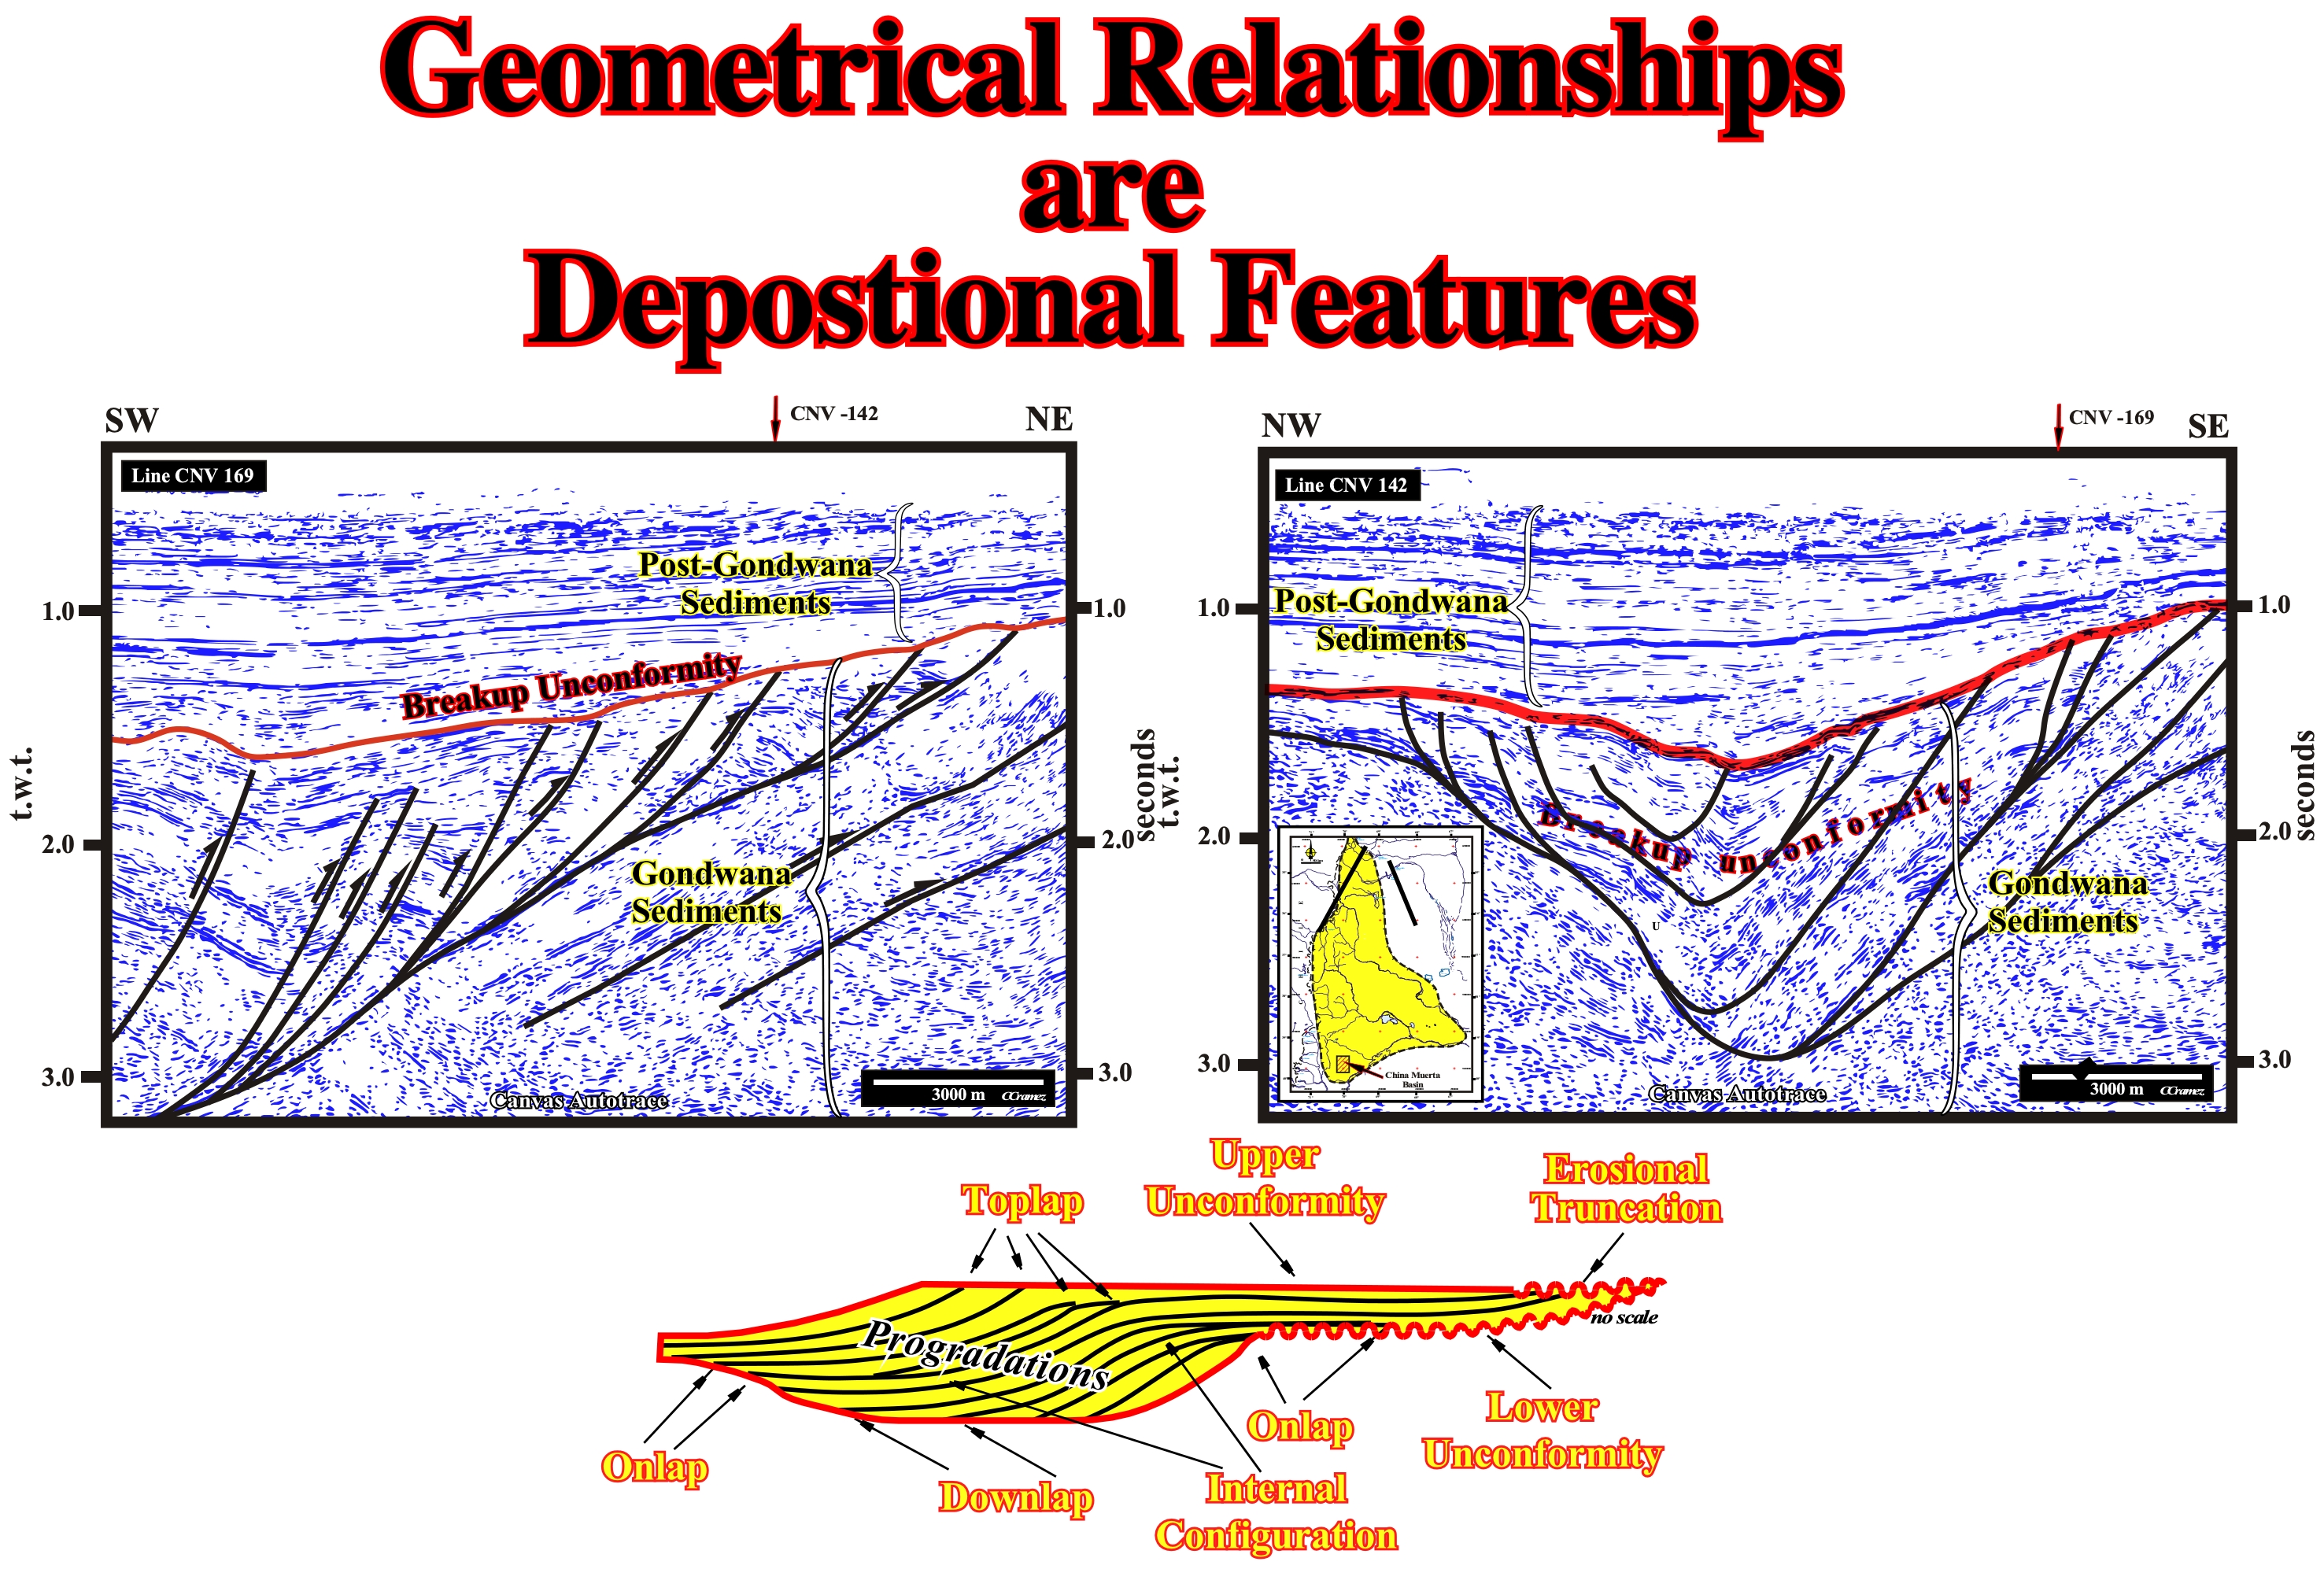
Figure 023- On these preliminary tentative geological interpretation of two, more or less, orthogonal Canvas autotraces of two seismic lines of the geographic China Muerta basin (Argentina onshore), the geometrical relationships between the seismic reflectors have a geological meaning just within the post-Gondwana sediments, i.e., above the breakup unconformity, here tectonically enhanced (angular unconformity). Below the breakup unconformity, the shortening of the Gondwana sediments deformed, completely, the pristine geometrical relations, making difficult their use in sequential stratigraphy, particularly on the identification and picking of the unconformities (stratigraphic cycle boundaries). In fact, the same happens when sediments are lengthened by halokinesis or shalokinesis, where original high structural points becoming low structural points and vice versa. Consequently, onlaps become tilted exhibiting the same geometry than downlaps, i.e., they become apparent downlaps. Only the pristine or undeformed geometrical relationships have a geological meaning.
The recognition on the seismic lines of the different geometrical relationships is fundamental in sequential stratigraphy and in petroleum exploration. All potential clastic reservoir-rocks (sand-prone basin-floor fans, sand-prone slope fans, transgressive sandstones, coastal plain sandstones, etc.) terminate by onlapping against the unconformities (underlined by onlap and toplap seismic surfaces). Similarly, downlap surfaces, as we will see later, emphasis the peak of transgressive episodes suggesting the more likely location the potential marine source-rocks. Accordingly, it is very difficult to understand why certain geoscientists use, always, work-station flattened seismic lines to perform sequential interpretation and evaluate the remnant petroleum potential, since the automatic flattening mechanism destroy or strong mask the onlap and downlap seismic surfaces as illustrated on figure below.
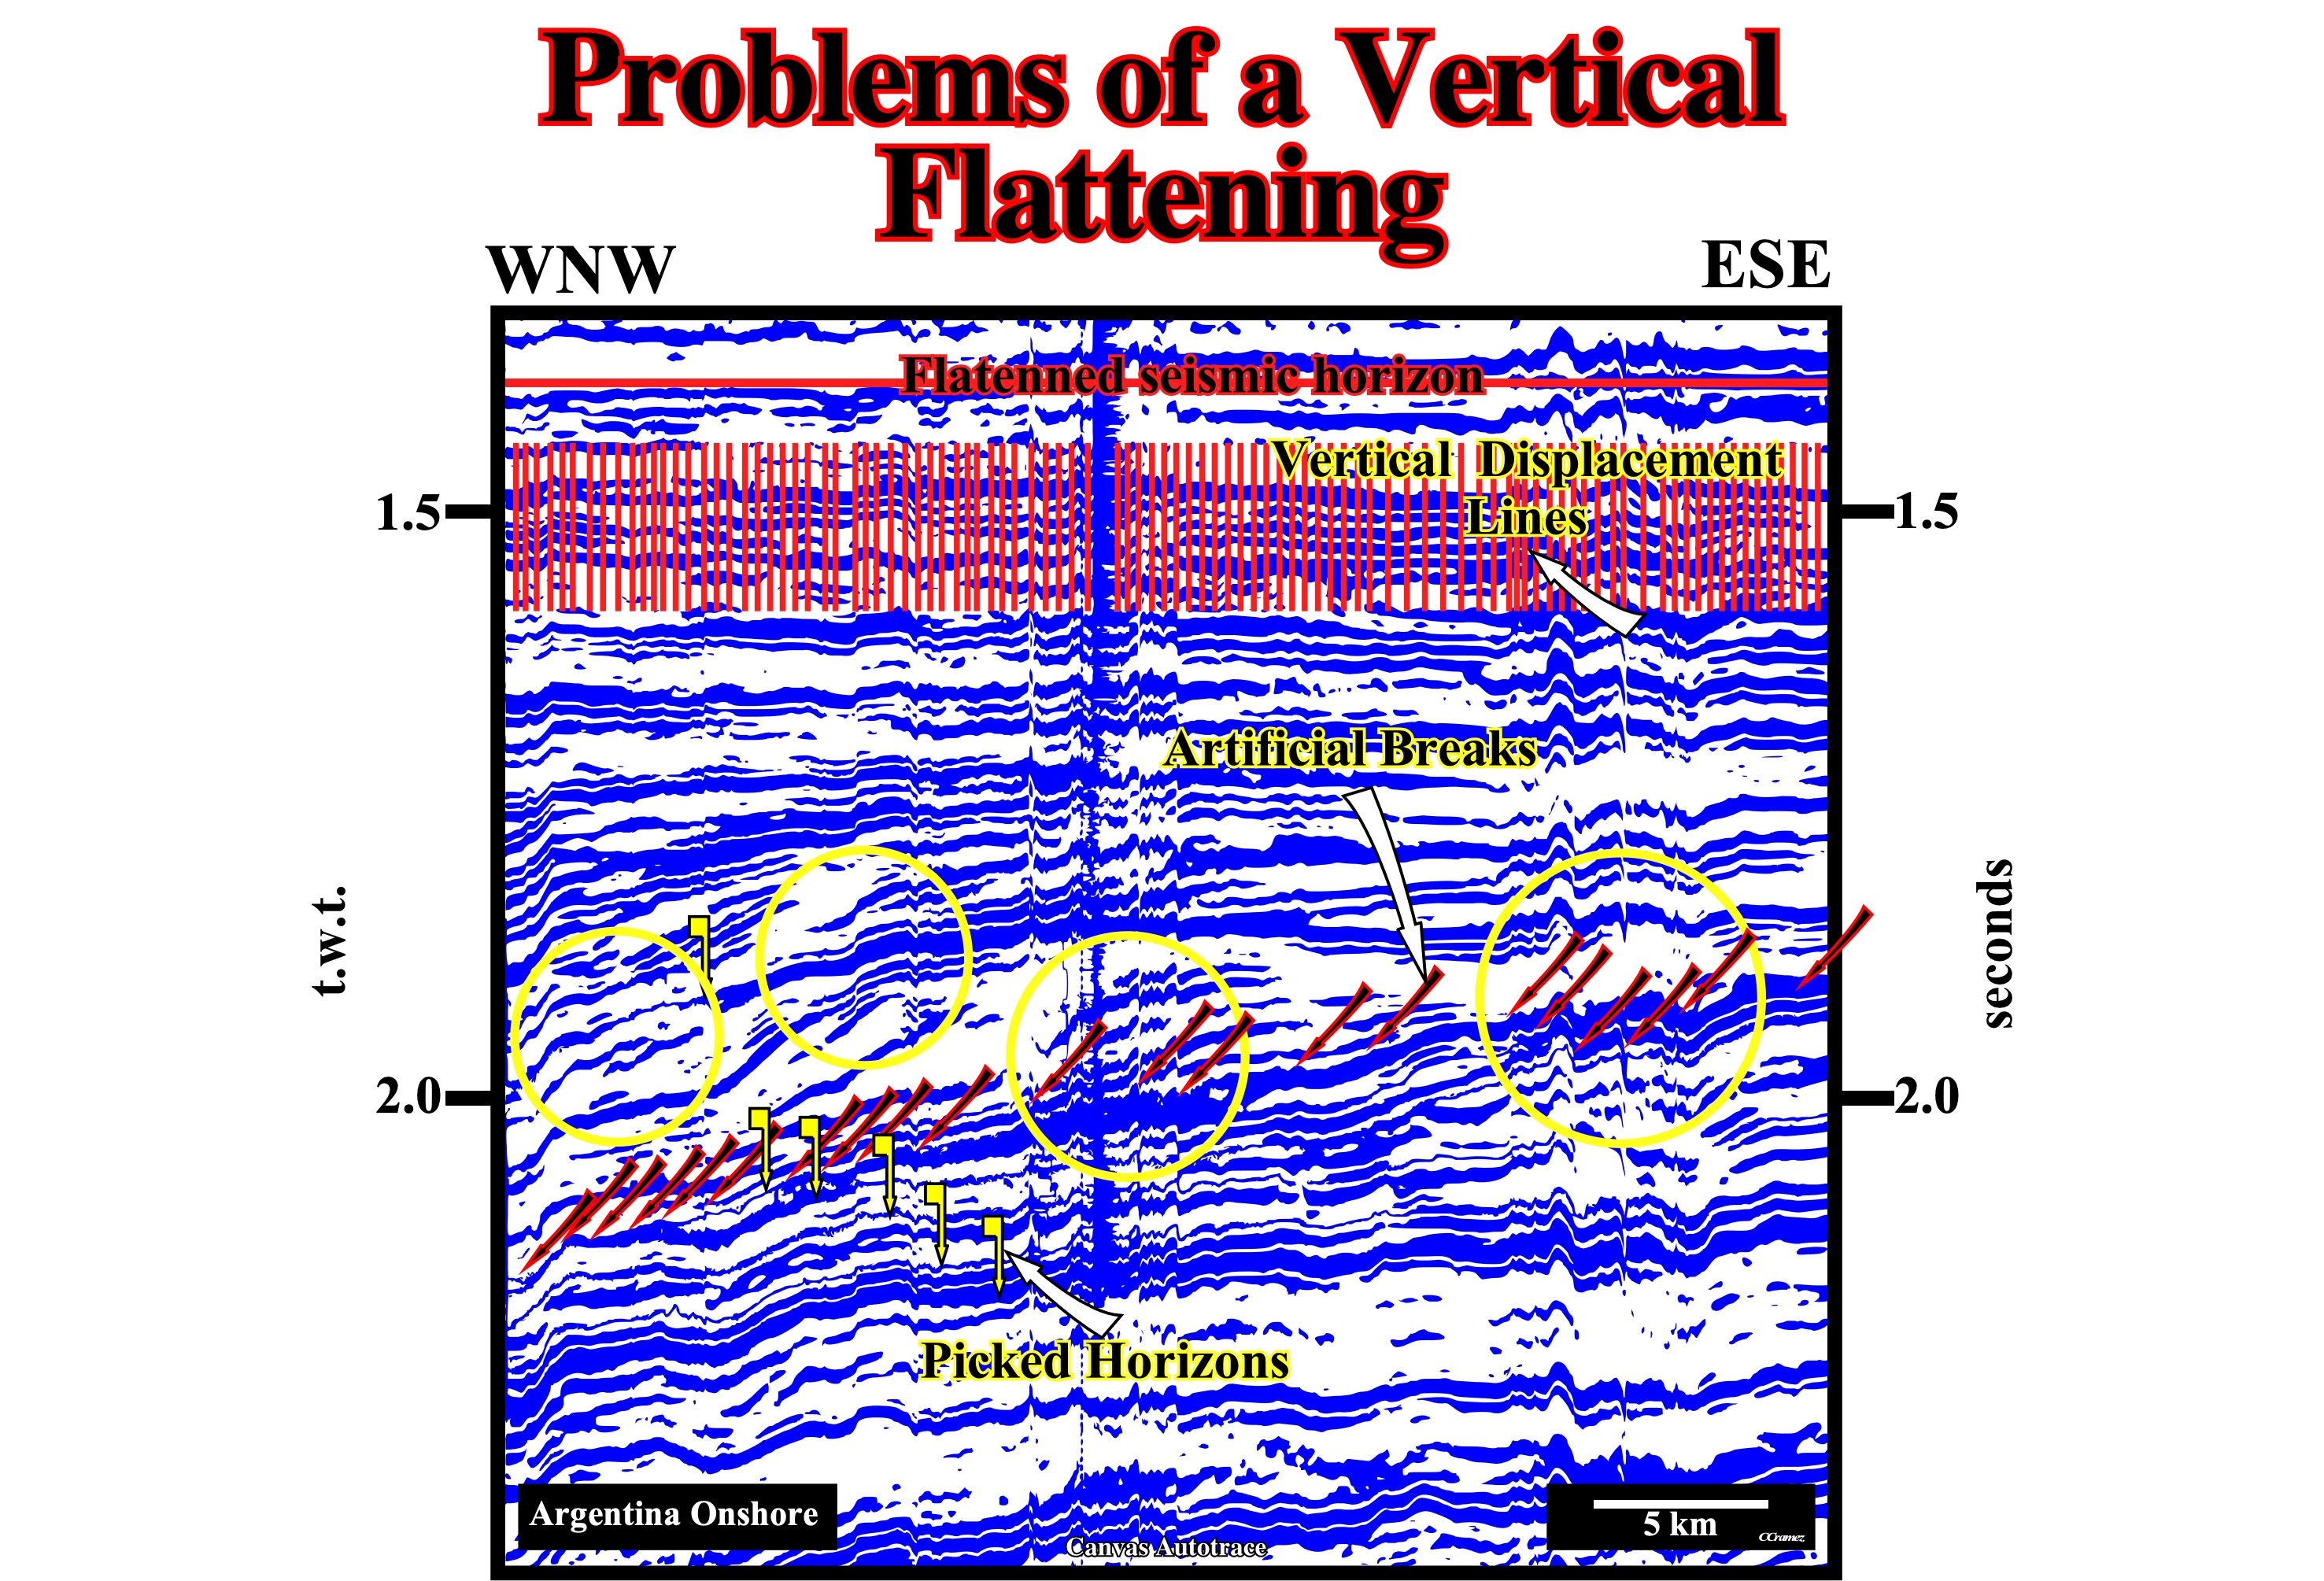
Figure 024- A simple glance at this flattened Canvas autotrace of a seismic line from the Neuquén geographic basin is sufficient enough to understand why certain geoscientists become mad when, in an exploration meeting, the speaker try to explain the remnant petroleum potential of a given area using flattened seismic lines, particularly, when the area was shortened by a regional tectonic regime. In fact, on flattened seismic lines, all syndepositional geometrical relationships (occurring at deposition time) are disturbed by the vertical displacements, which not only partially destroy the pristine geometrical relations, but create new ones, without any geological meaning, as illustrated above. Similarly, such vertical displacements are responsible for the nervous semi-automatic picks of the seismic horizons. On the above autotrace, several horizons were picked automatically. They created false antiform and synform structures, which can be recognized, easily, because they are visible from the top to the bottom of the autotrace (see white circles). The red vertical lines, in the top of the autotrace, emphasis the more evident gliding planes used in the flattening. In addition, the amount of vertical displacement to put horizontal the seismic horizon taken as datum is variable, since it is dependent of the lengthening (extension) or shortening (compression) undergone by the strata responsible for the seismic reflection. On the other hand, as illustrated on this autotrace, all geometrical relationships of the seismic reflectors flattened in this way (just by vertical displacement) have any geometrical meaning.
It is important to keep mind that in a compressional tectonic regime (σ1 horizontal), as it is the case in geographic Neuquén basin, the sediments were shortened by folding and / or reverse faulting. Apart from the few exception (compaction, dissolution, etc.), during deformation the volume of sediments stays more or less constant (see later : Volume Problems, Goguel’s Law).
Similarly, in an extensional tectonic regime (σ1 vertical), sediments are lengthened by normal faulting with volume preservation. From these geological conjectures, it is obvious that a compressional regime postdates, always, an extensional tectonic regime. Indeed, it is impossible to short sediments before their deposition11. The geological events following compression or extension are, completely, different. Therefore, geologists must avoid to take a shortening as a lengthening or vice versa. On the other hand, it is important to notice that both sequences of geological events :
Compression ⇒ Shortening ⇒ Uplift ⇒ Relative Sea Level Fall ⇒ Erosion … Unconformity and
Extension ⇒ Lengthening ⇒ Subsidence ⇒ Relative Sea Level Rise ⇒ Sedimentation,
are used to falsify the tentative geological solutions (see later).
11In the Neuquén geographic basin, one can say the backarc basin (rifting phase + cratonic phase) was deposited during an extension tectonic regime (lengthening), while the overlying foredeep basin is associated with a regional compressional tectonic regime (shortening), which shortened also the backarc basin sediments. When the maximum effective stress σ1is horizontal, the sediments are shortened, which implies uplift and subsequently : (i) a relative sea level fall ; (ii) erosion and (iii) an unconformity. Contrariwise, when σ1 is vertical, sediments are lengthened, which implies subsidence and subsequently : (a) a relative sea level rise and (b) sedimentation.
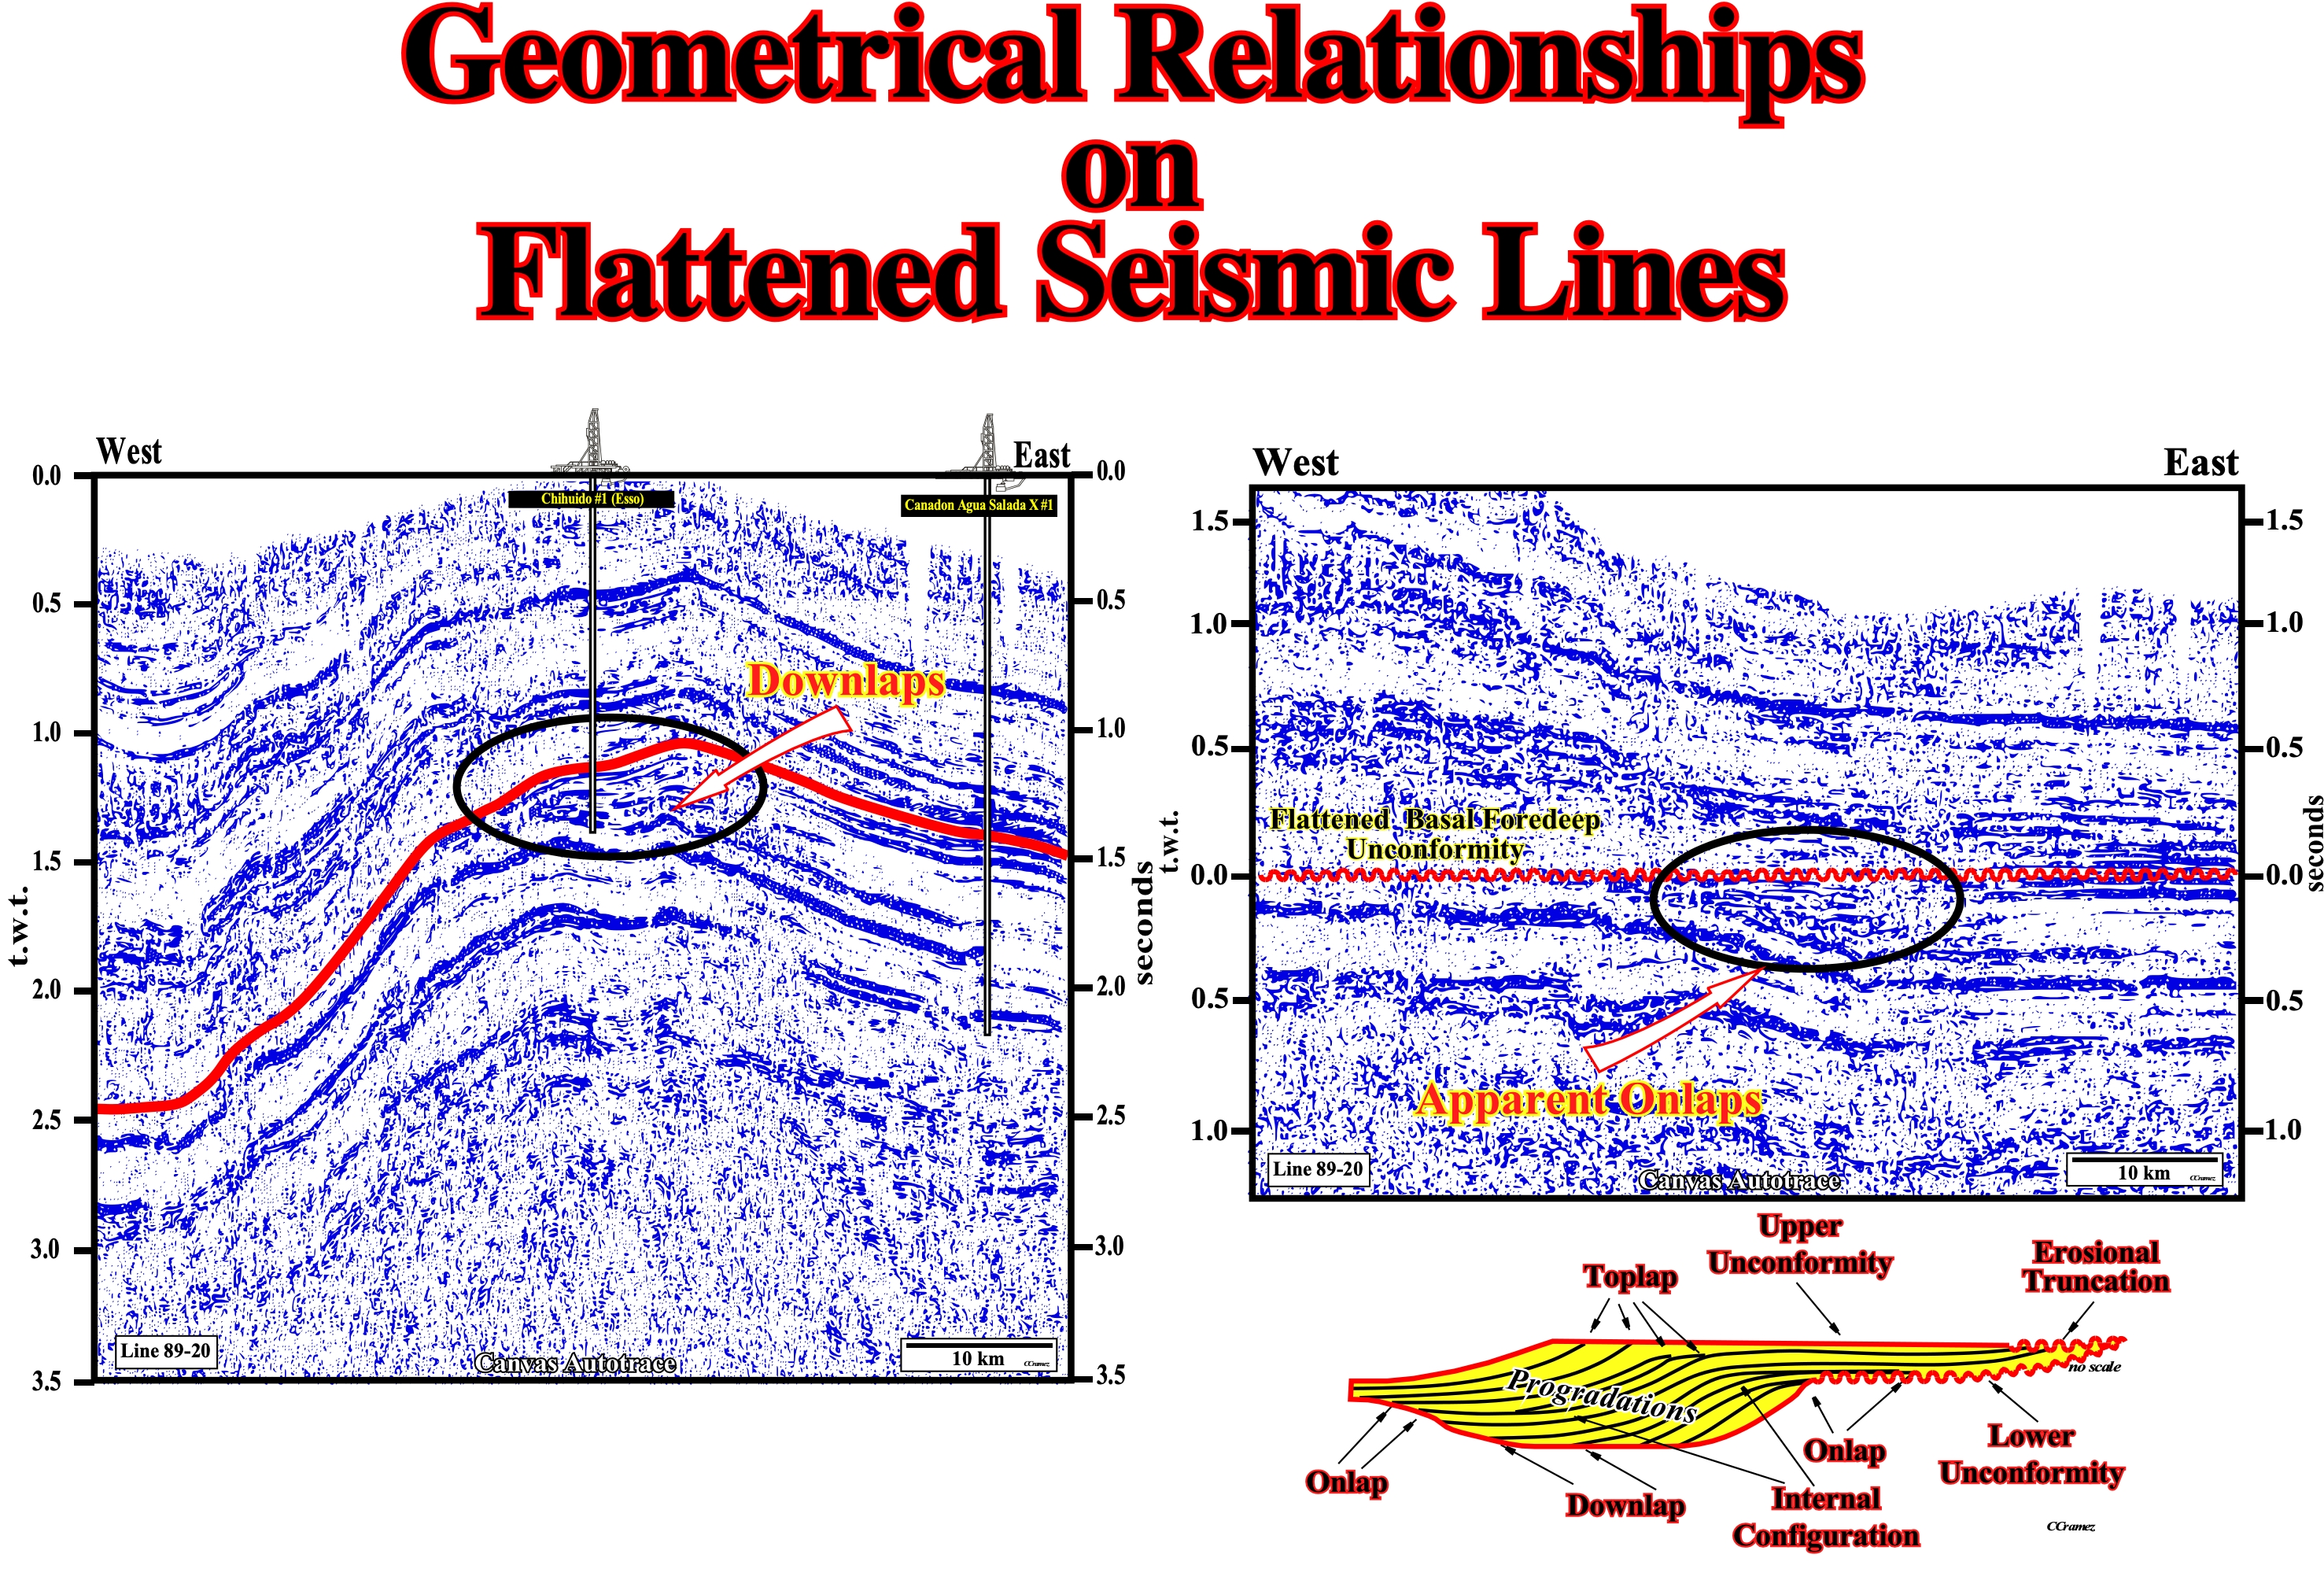
Figure 025- A seismic line from the geographic Neuquén basin, is represented here by a Canvas autotrace in the left part of this figure. A Canvas autotrace on the right illustrates the flattening (vertical displacement) of the same line taking as horizontal datum the more likely basal unconformity of the foredeep basin. An important shortening and uplift of the sediments is obvious on the left autotrace. Likewise the downlap geometrical relationships below unconformity (in red) on the apex of the Chihuido anticlinorium are quite evident. In the autotrace of the flattened seismic line, illustrated in the right part of the figure, it is interesting to notice the original downlaps became onlaps (apparent onlaps) just due to the flattening mechanism. As said previously, an automatic flattened seismic line is created by shifting samples in the original line up or down. This means parts of the original image are stretched, in some areas, and squeezed, in others, to flatten the features in the image. Obviously, the flanks of the anticlinorium were squeezed (shifting up), while the crest area was stretched (shifting down).
Let's see an example.
Suppose that a geoscientist working in petroleum exploration, must solve the following problem:
In the given geographic basin, and particularly, in an area covered by seismic, what are the expected traps ?
The geoscientist, after advancing the more likely tentative solutions, using the global and regional geological settings of the area and his past experience, is going to falsify them using the seismic data. Knowing the problem that he must solve it, he can start to observe the seismic data in order to exclude the tentative solutions, easily, refuted, but the first step of observation is crucial:
He must start to decide whether the sediments (in this case seismic reflectors) were lengthened or shortened.
If he makes a mistake in this first step, the sequence of geological events that he must look for is, completely, different and for sure the answer to question will be wrong. In fact, it is quite frequent see antiforms (extensional structures) interpreted as anticlines (compressional structures) and morphological traps by juxtaposition interpreted as structural traps, etc. The result of an initial mistake is always the same, i.e., dry wells, excepted when oil is found by serendipity, but this is another story (quite common, by the way).
It is evident that the geoscientist is going to make tentative geological interpretation using normal seismic lines and not flattened lines, because he knows or must known that a flattened seismic line (using the workstation) is not a palinspathic section12 as illustrated in figure 026.
12Showing the previous location of geological features, correcting for any intervening crustal movements. The length of the palinspathic section must be equal to the length of the section of the undeformed sediments. In other words, if the sediments were shortened 15% by a compressional tectonic regime, the palinspathic section must be 15% longer than the shortened section. If the sediments were 15% lengthened, the palinspathic section must be 15% shortened.
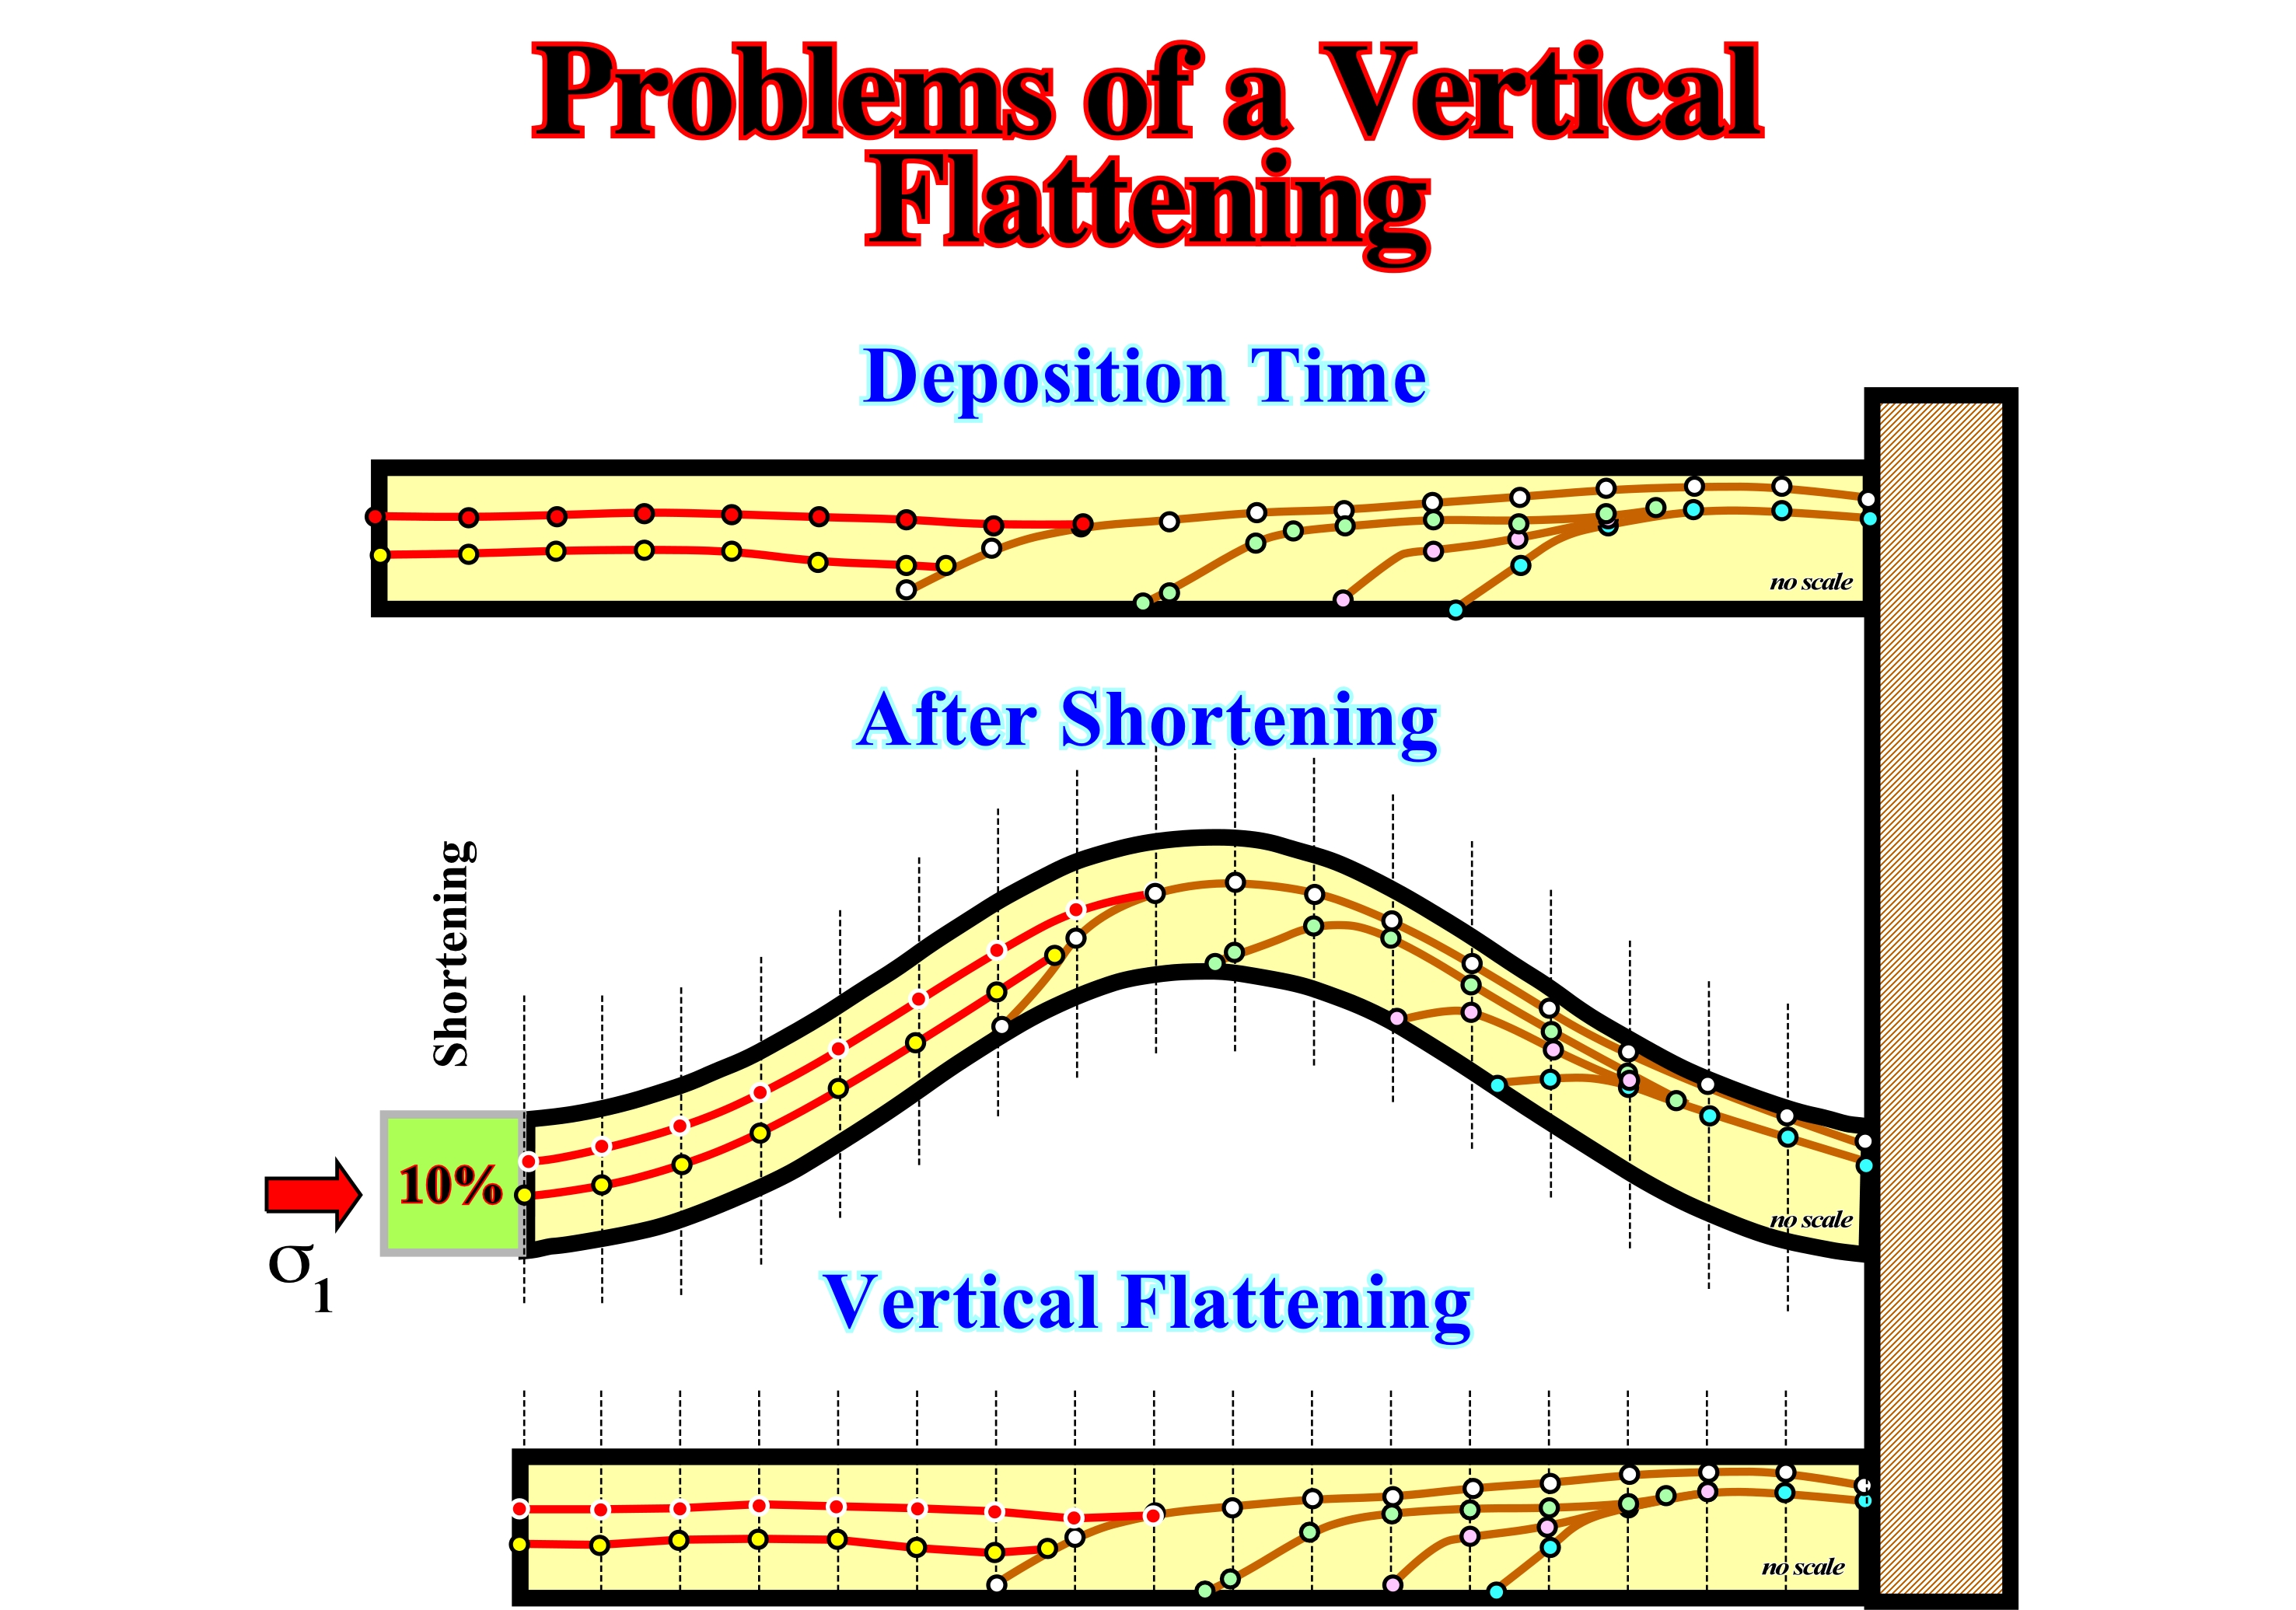
Figure 026- In the top of this figure is illustrated a given geological interval, in which several stratigraphic sequence-cycles can be recognized. In fact, not only onlaps are, easily, identified, but downlaps as well. Under the influence of a compressional tectonic regime, the sediments were shortened by folding with formation of anticline and syncline structures. In relation to the original deposition, the sediments were shortened 10%. A seismic reflexion survey was shot over one anticline structures. A tentative geological interpretation of the characteristic seismic line testing the anticline structure, i.e., the seismic line shot perpendicularly to the axial direction of the anticline, is illustrated in the middle of figure. Taking into account the horizontal scale of this seismic line, one can see, the length of this line is 10% smaller that the length of the undeformed section. The original geometrical relationships were deformed. Few of the original downlaps became apparent onlaps, while few of the original onlaps became apparent downlaps. However, the original geometrical relationships can be, easily, recognized. A automatic flattened version of the characteristic seismic line is schematized in the lower part of this figure. The original geometrical relationships are obviously, but the length of the section does not correspond to the original undeformed, i.e., the sediments exhibit a shortening of 10%, but without uplift. The central part of the seismic line was squeezed upward, while the flanks were stretched down.
Seismic image flattening attempts to reverse the effects of geologic processes by removing all of the geologic structure present in the image and thereby transforming the image into layers as they were deposited in geologic time, i.e., flattening transforms a seismic image to make the structural features in the image flat. Stratigraphic features such as channels are easier to recognized after flattening because an interpreter is able to view an entire geologic interface at once. Typically, a flattened seismic image is created by shifting samples in the original image up or down. This means that parts of the original image are stretched in some areas and squeezed in others to flatten the features in the image.
Summing up : Avoid tentative geological interpretations of flattened seismic lines (conventional automatic workstation flattening). In the areas were the sediments were shortened or lengthened, the majority of the geometrical relationships and seismic surface are deformed and quite difficult to interpret in geological terms.