
As there are two great families of infra-salt sediments, one pre-dating and another post-dating the breakup of the lithosphere, to evaluate their generating petroleum potential, it is important specify if they are rift-type basin sediments (pre-dating the breakup unconformity) or if they area margin infra-salt sediments, which post-date the breakup unconformity.
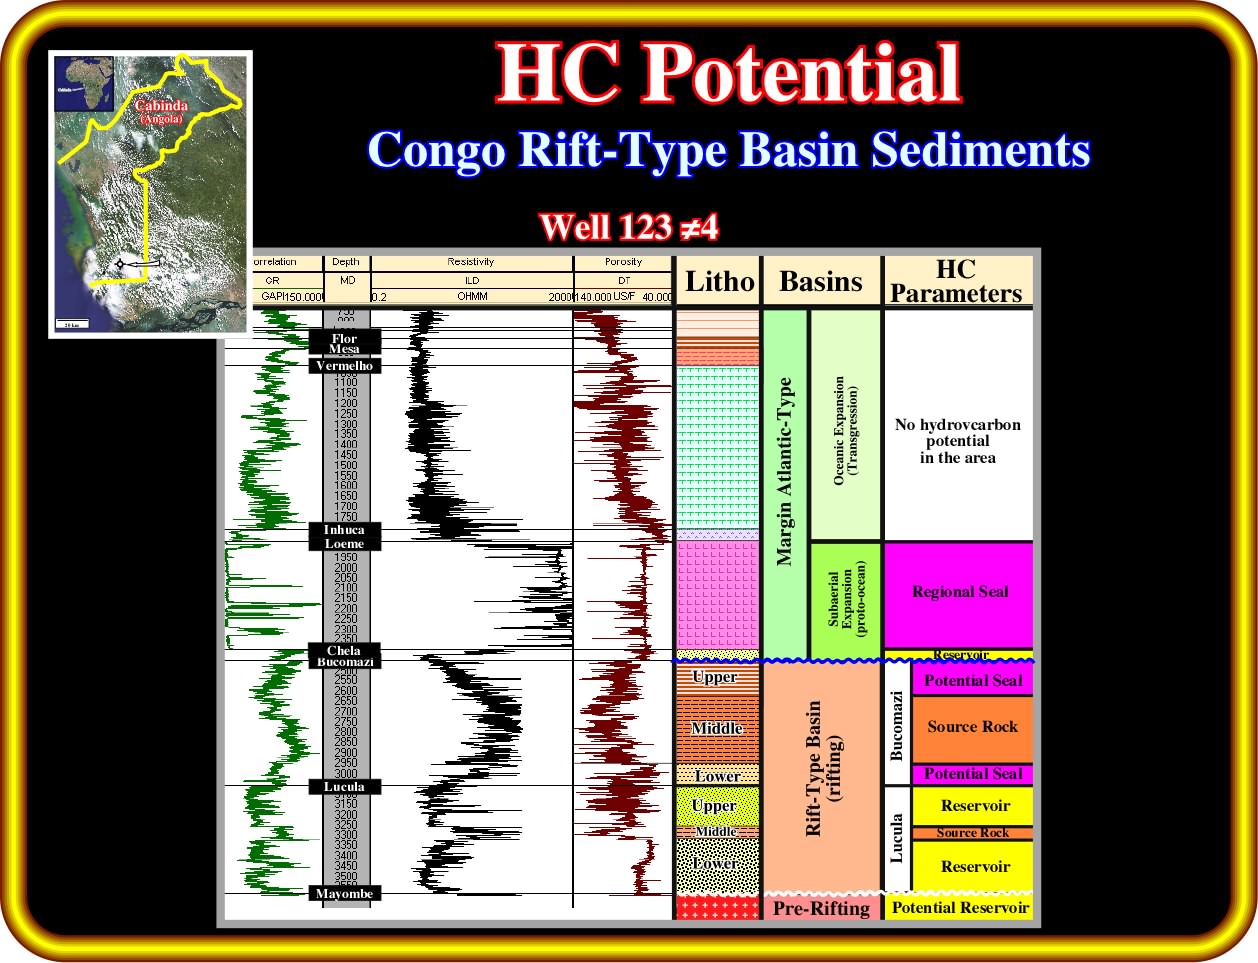
As illustrated in this plate, in which are depicted the electric logs of the 123 ≠ 4 located in onshore Cabinda, below the salt layer (Loeme salt), which when in continuity, that is to say, in the absence of salt welds is an excellent regional seal, two level of potential source rocks in the Bucomazi formation and one in the Lucula formation are evident. They are characterized by a high gamma ray, high resistivity and a relative low porosity. If these intervals were buried enough and the organic matter of the potential source-rocks reach maturation, they become real source-rocks, which can be predicted also by the analysis of the electrical logs as illustrated in next plate.
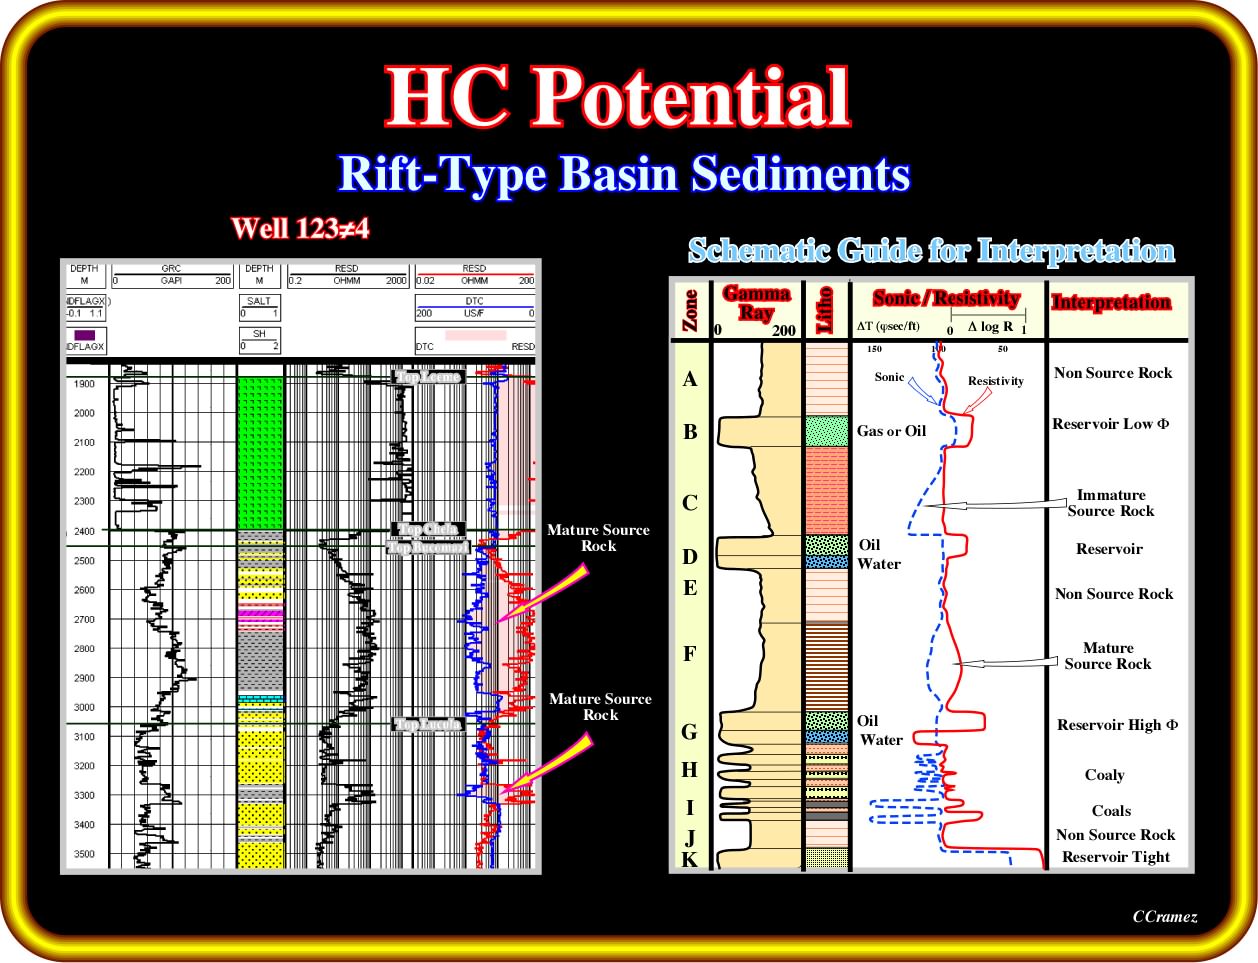
In this plate, on the left, are represented the gamma ray, resistivity and sonic logs of the salt and infra-salt strata of the well 123≠4 (same well than in previous plate). As illustrated the infra-salt strata is composed by a thin margin infra-salt sediments(Chela formation) and a thick rift-type basin interval (Bucomazi and Lucula formation). The analyses of the electrical logs strongly suggests that the organic matter of the organic rich intervals reached maturation. In fact, as said previously using the gamma ray, sonic and resistivity logs (the sonic is aligned on the top of the logarithmic scale resistivity log, so that the sonic curve lies on top of the low resistivity shales), anyone can recognize the more likely source and reservoirs-rocks. Remember : (i) Low resistivity shales are considered to be no source-rocks and are unlikely to be gas shales ; (ii) Shales or silts with generating potential show considerable cross over between the sonic and resistivity curve ; (iii) When GR (Gamma Ray) deflects to the left, the zone is clean and might be a reservoir quality rock ; (iv) When GR deflects to the right, the zone is usually shale (not a reservoir quality rock) ; (v) Porosity logs are scaled to show higher porosity to the left and lower porosity to the right (clean and porous is good, so compare the GR to the porosity log) ; (vi) Resistivity logs are scaled to show higher resistivity toward the right ; (vii) Higher resistivities mean hydrocarbons or low porosity ; (viii) Low resistivity means shale or water zones. In other words, intervals clean, porous and wit high resistivity are good.
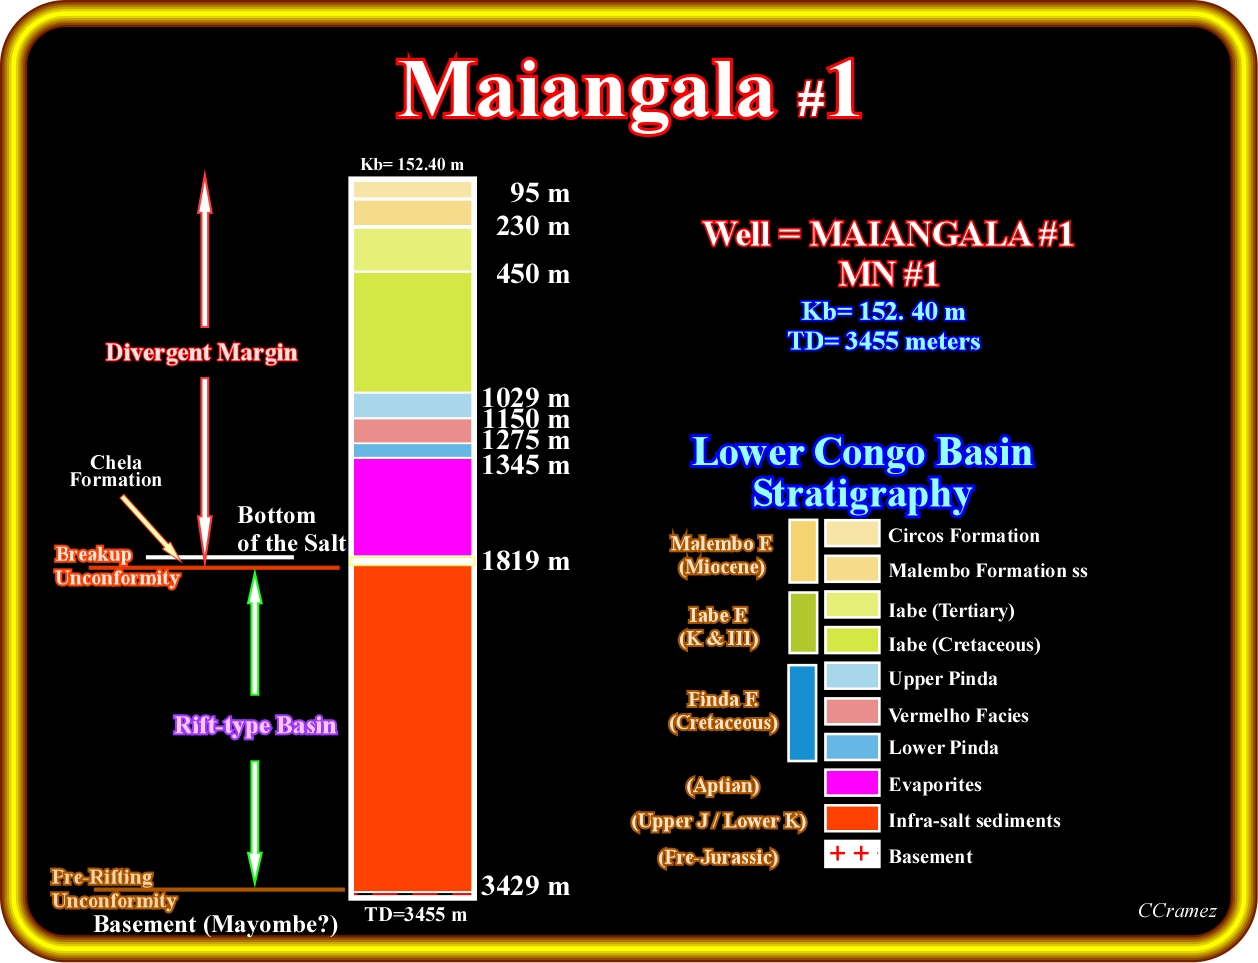
One of the more interesting exploration well in South Congo offshore is Maiangala ≠1, since it recognized more than 1500 meters of infra-salt strata. Few meters of these strata (thickness under seismic resolution) were margin infra-salt sediments (Chela formation). In fact the large majority of the strata were rift-type basin sediments, in which organic rich intervals were considered as the source-rocks of the hypothetical petroleum system found in this onshore. Do not forget than an hypothetical petroleum system (.), according to Magoon, means an absence of petroleum-source rock correlation, that is to say, that there just a geochemical evidence indicating the origin of the oil and gas. However, as said previously, one cannot exclude that some of the South Congo onshore are associated with an offshore generating petroleum sub-systems located within the margin supra-salt sediments.
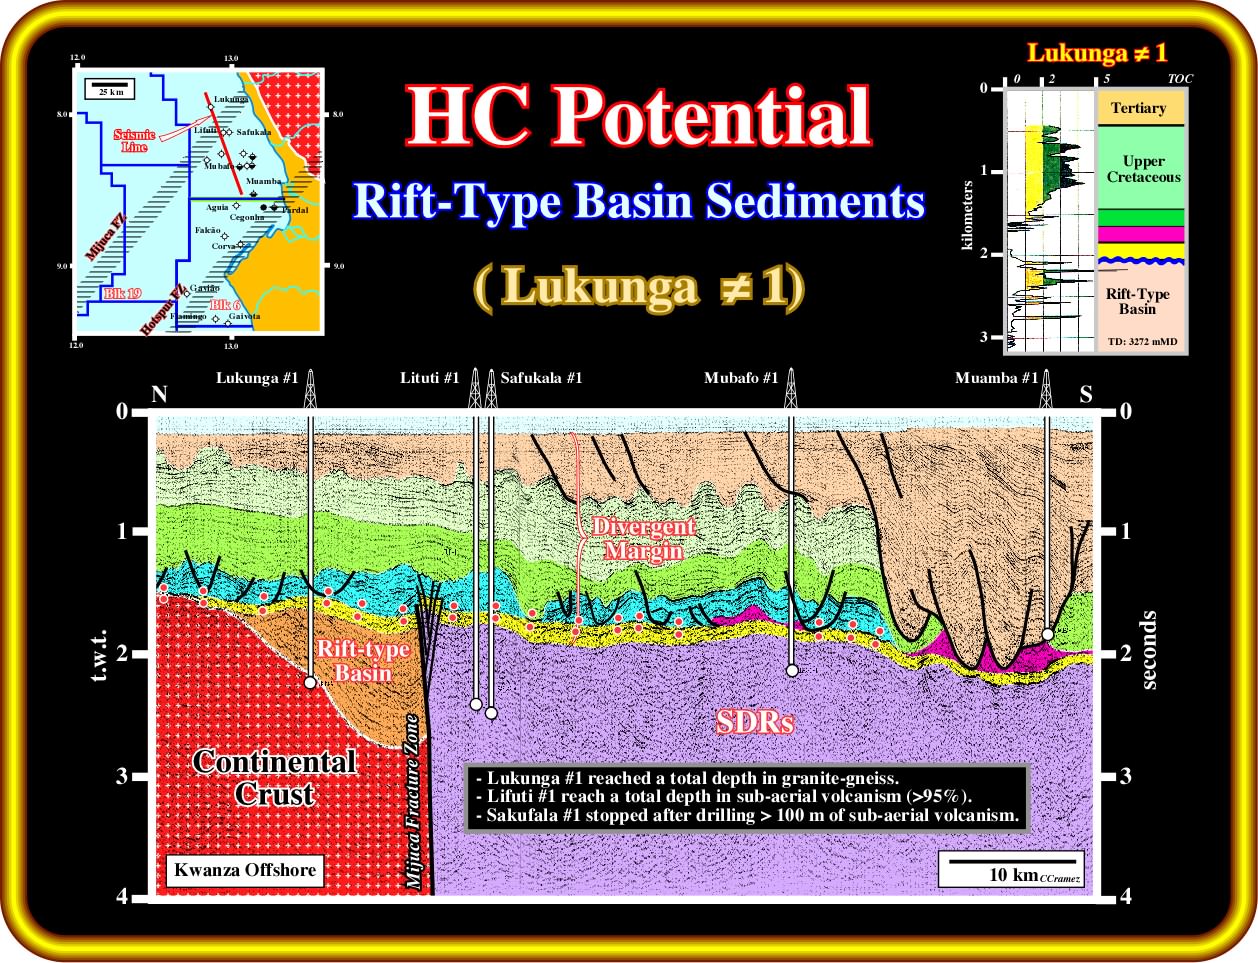
The wells located on this seismic line, crossing the block 5, are highly significative. Indeed, concerning the infra-salt strata, and particularly the infrastructure of the continental margin, they belong to two completely different geological provinces separated by the Mijuca fracture zone. Below the margin infra-salt sediments (Cuvo-Chela sandstones), Lituti ≠1, Safukala ≠1 and Mubafo ≠1 penetrate post-breakup subaerial volcanism, that is to say, volcanic rocks deposited at the bottom of the margin immediately after the breakup of the lithosphere, without petroleum generating potential. On the contrary, Lukunga ≠1, located northward of the Mijuca fracture zone, drilled under the margin infra-salt sediments (Chela-Cuvo formation) organic rich rift-type basin sediments as suggested by the TOC log illustrated on the upper right corner of this plate.
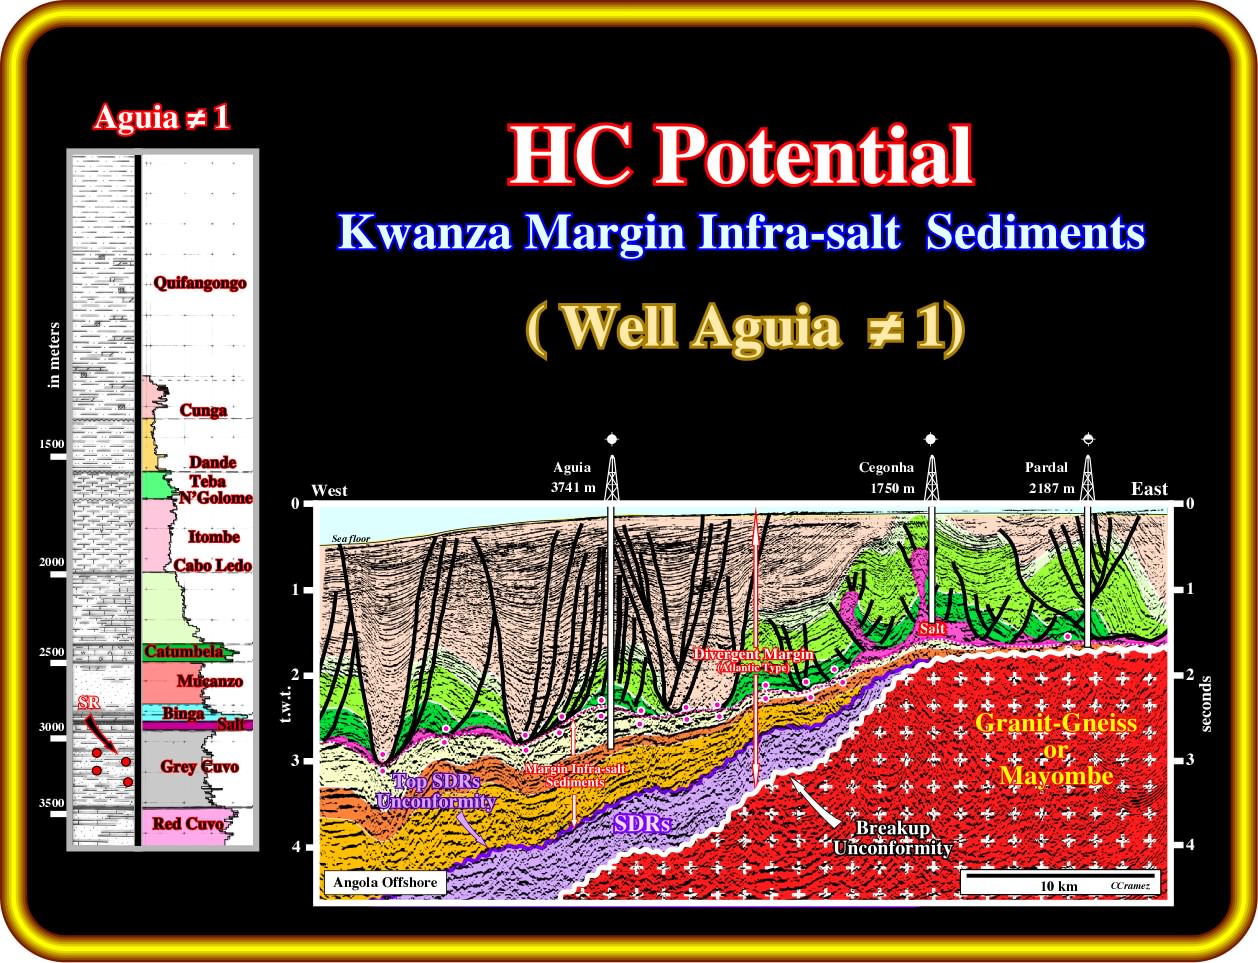
Westward of Luanda, in the conventional offshore (exploration block 6), where Total CAP drilled several wells as the one illustrated on this plate (Aguia ≠1), the hydrocarbon potential of the margin infra-salt sediments was clearly recognized. In fact, as illustrated on this well, in the upper part of the margin infra-salt sediments (Grey Cuvo formation of Petrangol), there are organic rich-layers, which can be considered as source-rocks, since their organic matter is mature. Similarly, in the lower part (Red Cuvo formation), which as a carbonate facies several layers can be considered as potential source-rocks and others as reservoir-rocks in which oil shows where found. As it is easily recognized in the proposed geological tentative interpretation, there is any trap in the infra-salt sediments around the Aguia≠1 (the undulations of these intervals are clearly induced by salt and upper salt velocity anomalies.
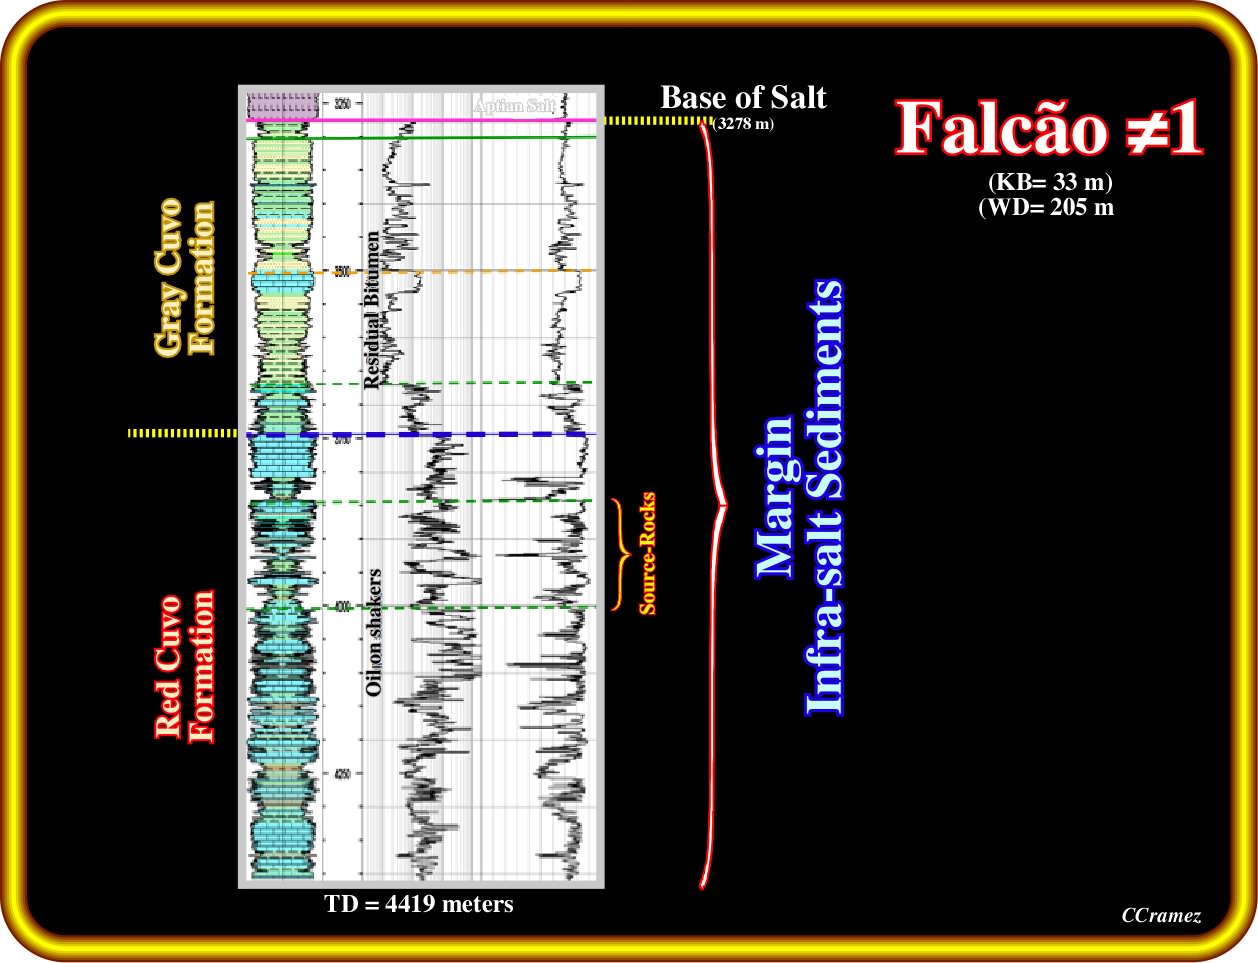
Not far from Aguia ≠1, in the same exploration block, Conoco, in 1992, drilled Falcão≠1 (see seismic line in next plate), which found in the infra-salt sediments very good source-rock layers, particularly in the upper part of the Red Cuvo formation of Petrangol and substantial oil shows not only in the Grey Cuvo (residual bitumen), but in the red Cuvo formation as well (oil on shakers). As well as in Aguia≠1 (previous plate), Falcão was drilled to test a supra-salt trap and not an infra-salt potential accumulation, since there is any trap the margin infra-salt sediments at this level, as illustrated next.
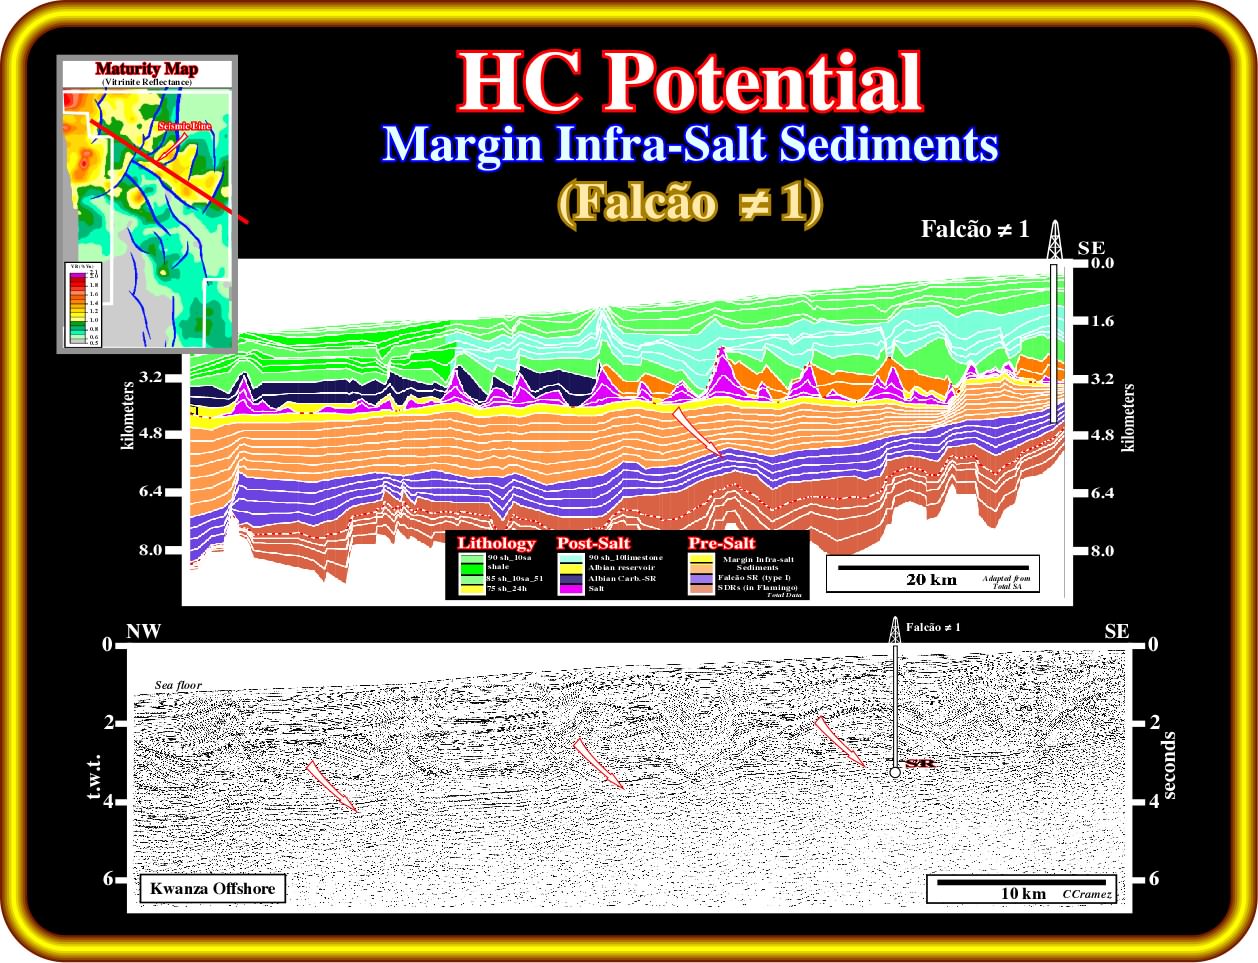
The organic rich margin infra-salt interval is underlined on the seismic line by the red arrows. As depicted on the seismic line, there is any trap within margin the infra-salt sediments around the location of the well. The target of the well was a Cretaceous turtle backs, that is to say, a margin supra-salt trap. The maturity map and the maturity profile, strongly suggest that the organic matter of the organic rich interval recognized in Falcão well reach maturation, since the reflectance of the vitrinite (key method for identifying the maximum temperature history of sediments in sedimentary basins) is clearly between 1.0 and 1.3. On the other hand, in the maturity profile, it is quite obvious that, in depth, all margin infra-salt sediments dip seaward, that is to say there is any apparent trap (at least structural or morphological by juxtaposition or not) in the margin infra-salt sediments. Taking into account, these profiles, at the level of the margin infra-salt sediments, the more likely trap will associated with the pinchout of these sediments on the basement or on the post-break volcanic subaerial lava flows.
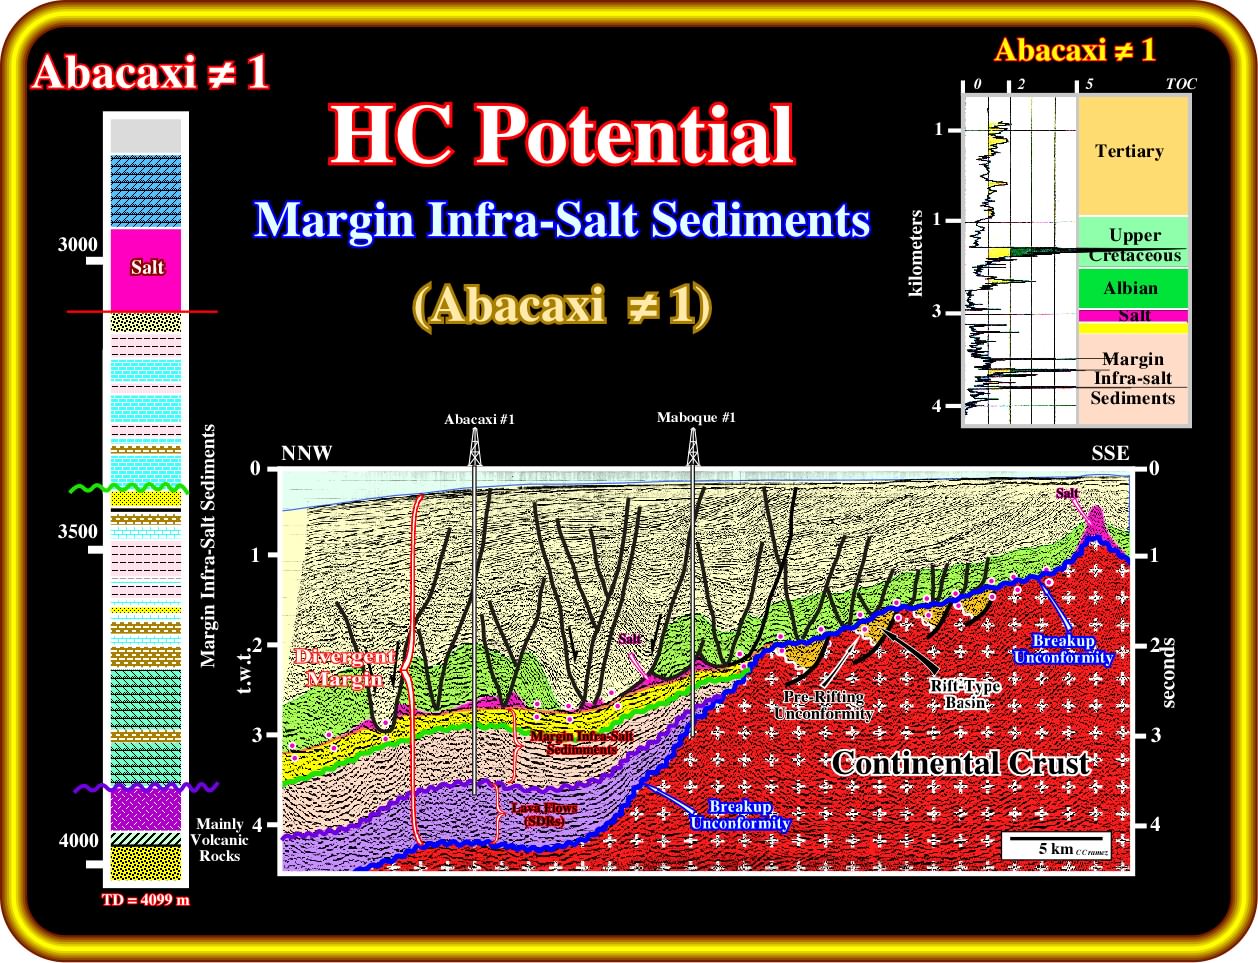
This geological tentative interpretation of a seismic line through the exploration block 9 (south conventional Kwanza offshore) on which were located Abacaxi ≠1 and Maboque ≠1 is highly interesting from several point of view. In the case of Abacaxi ≠1, as illustrated by the TOC profile (right upper corner), the well recognized organic rich sediment, mainly in the lower part of the margin infra-salt sediments. On the other hand, the well recognized, volcanic rocks, probably subaerial la flows, with volcanic conglomerates and was stopped at 4099 meters, since the volcanic material has not petroleum potential (no source or reservoir-rocks).
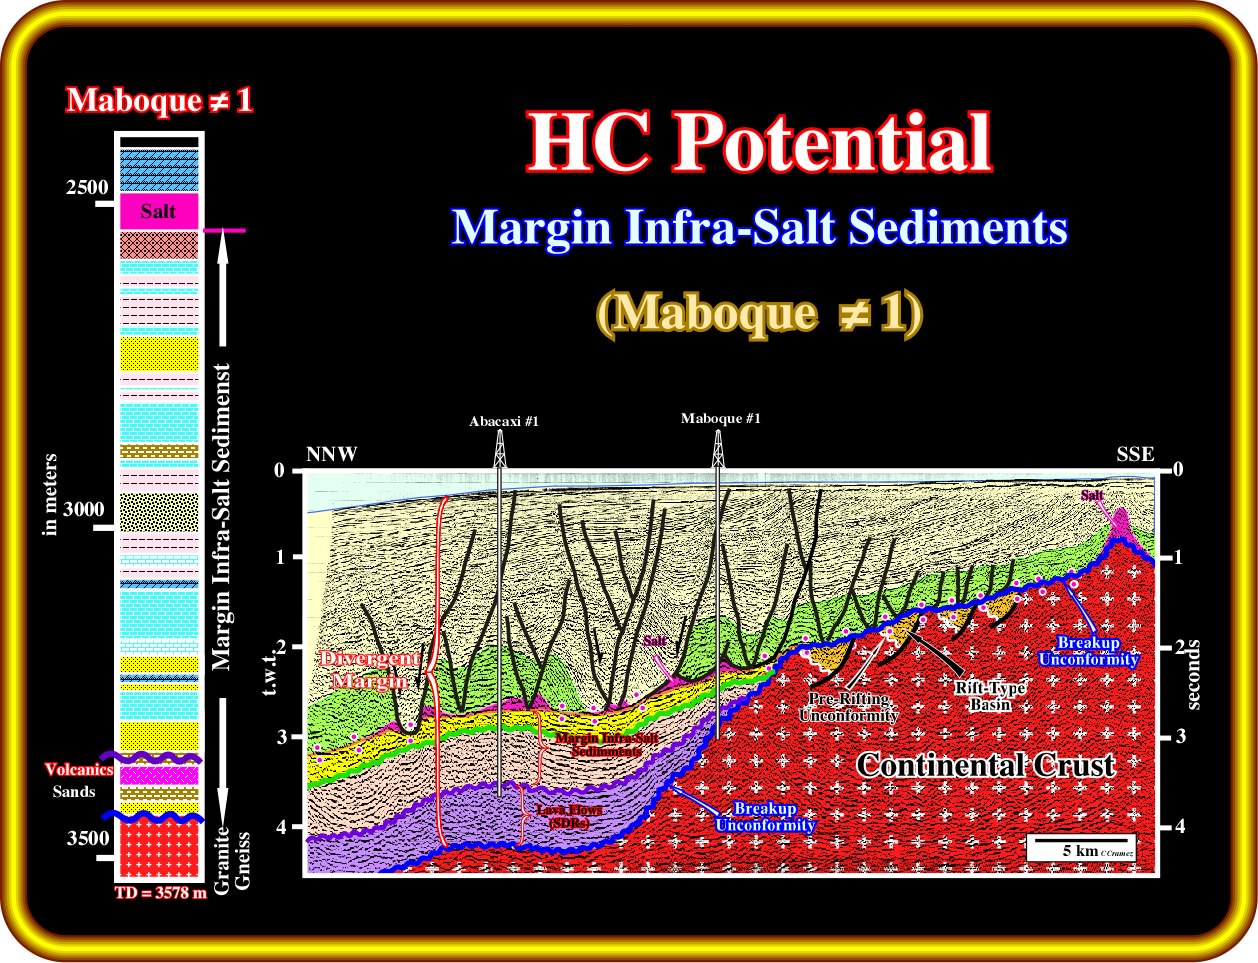
Maboque ≠1 found in the margin infra-salt sediments the same organic rich intervals recognized in Abacaxi, as well as the pinchout of the post-breakup of volcanic-sedimentary interval, which fossilizes the breakup unconformity (in blue on the tentative interpretation). It is important to point out that below volcanic-sedimentary interval, the well reached the basement (granite-gneiss), that is to say, the continental crust, in which, laterally, anyone can prognosticate small rift-type basins.
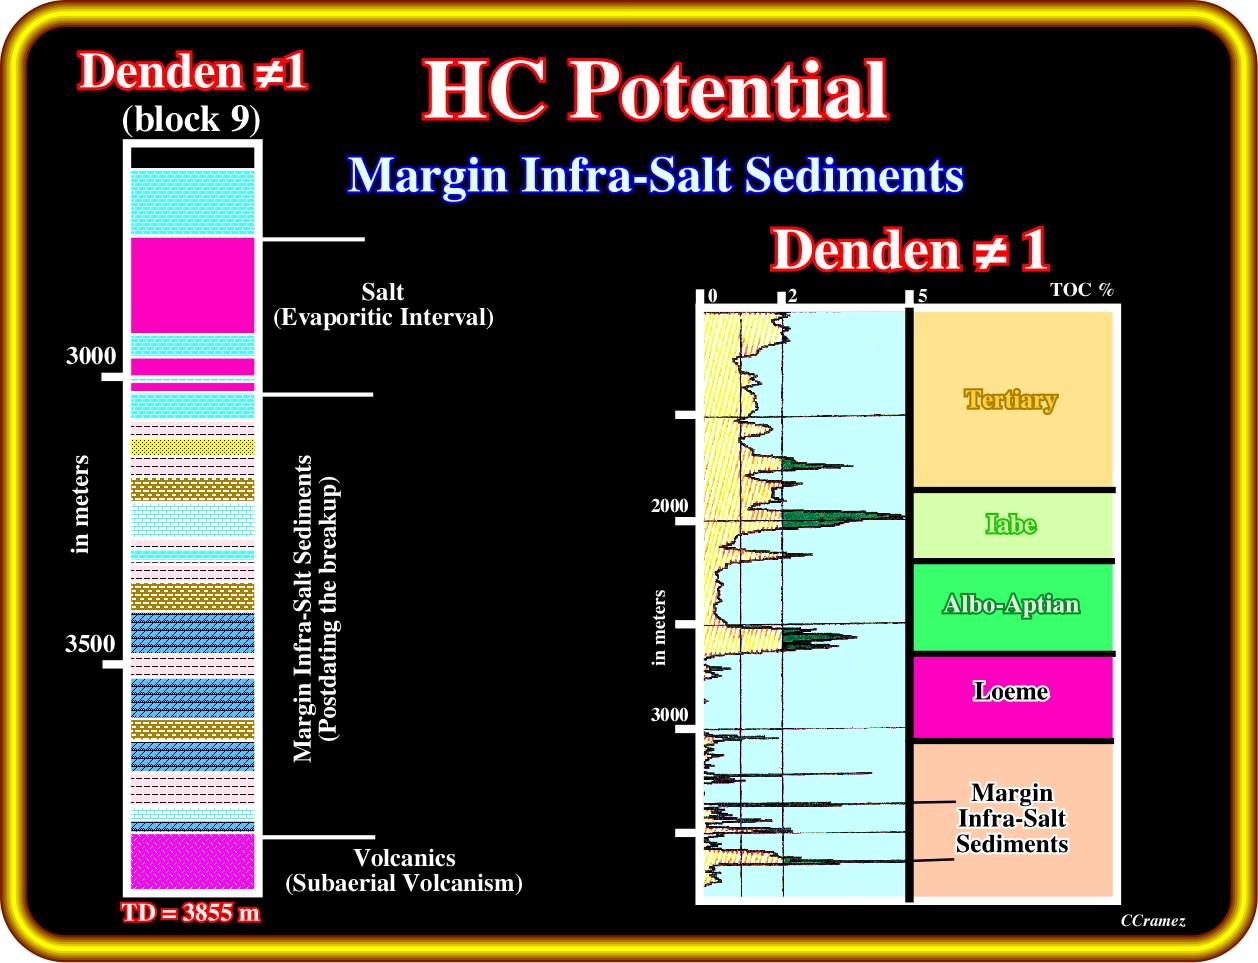
The Denden ≠1 drilled, as the previous wells, in exploration bloc 9, recognized thin organic rich intervals within the margin infra-salt sediments. However, as illustrate by the TOC map, richer organic intervals were drilled above the salt layer, in the Albian-Aptian and Iabe limestones and Lower Tertiary. Notice that as previously, the substratum of the margin-infra-salt sediments is formed by volcanic rocks, probably, subaerial lava flows with intercalated with sedimentary layers rich in volcanic material.
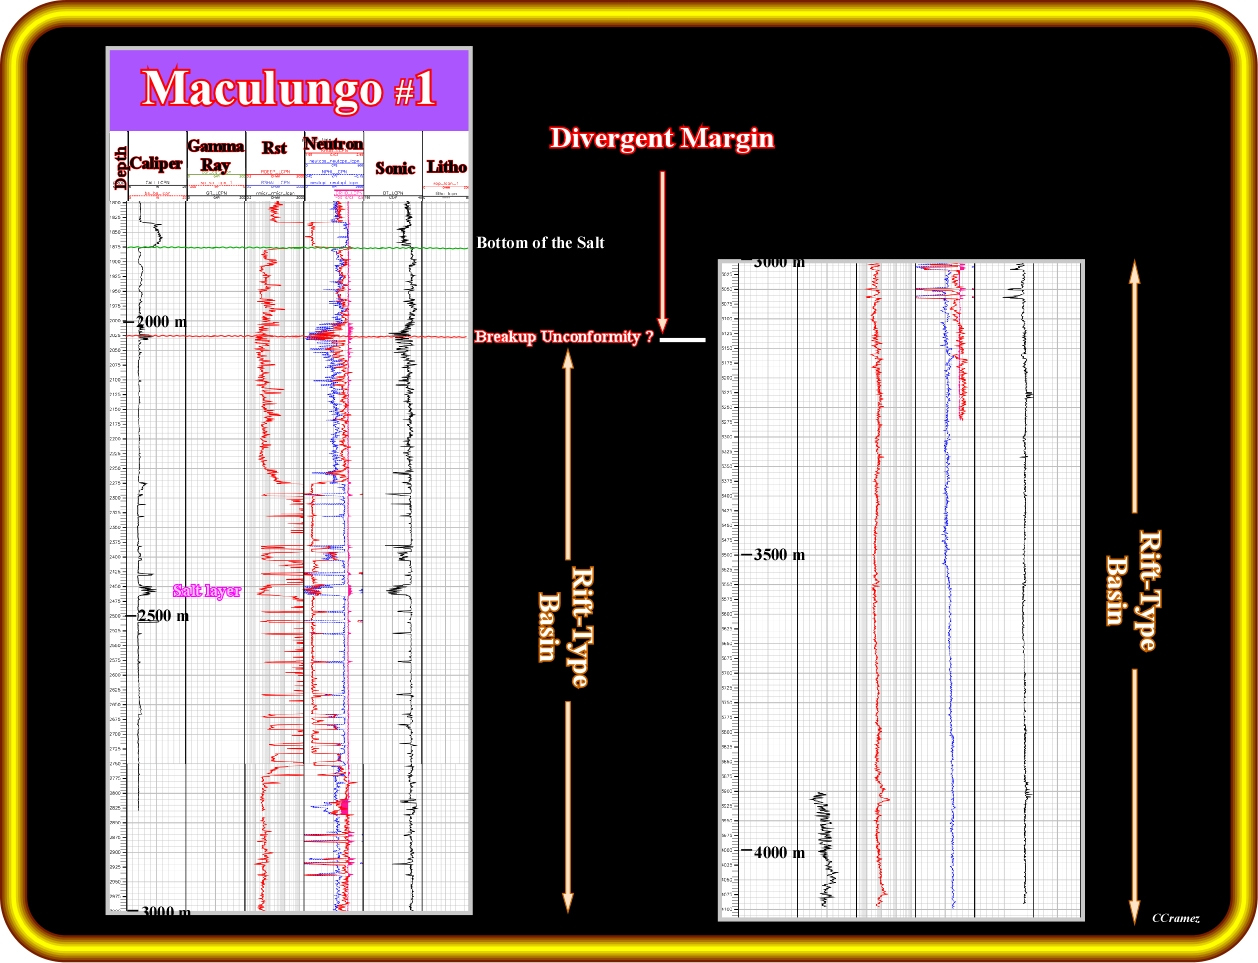
In the Kwanza onshore, a quite interesting well is Maculungo ≠1, which was drilled by Petrangol (subsidiary of Fina) in the 60's. Unfortunately, I have not enough data, particularly in geochemistry, to prove that the rift-type sediments drilled below the breakup unconformity and the TD of the well organic rich sedimentary intervals were found. I just remember to see, few months after the drilling was stopped, a lot of oil in the mud container. Another characteristic of this well, was one can recognize on the electrical logs, is the presence of a salt layer within the rift-type basin, which certainly has a completely different mineralogy and chemical composition of the convectional post breakup Aptian salt.
Exercise 1:
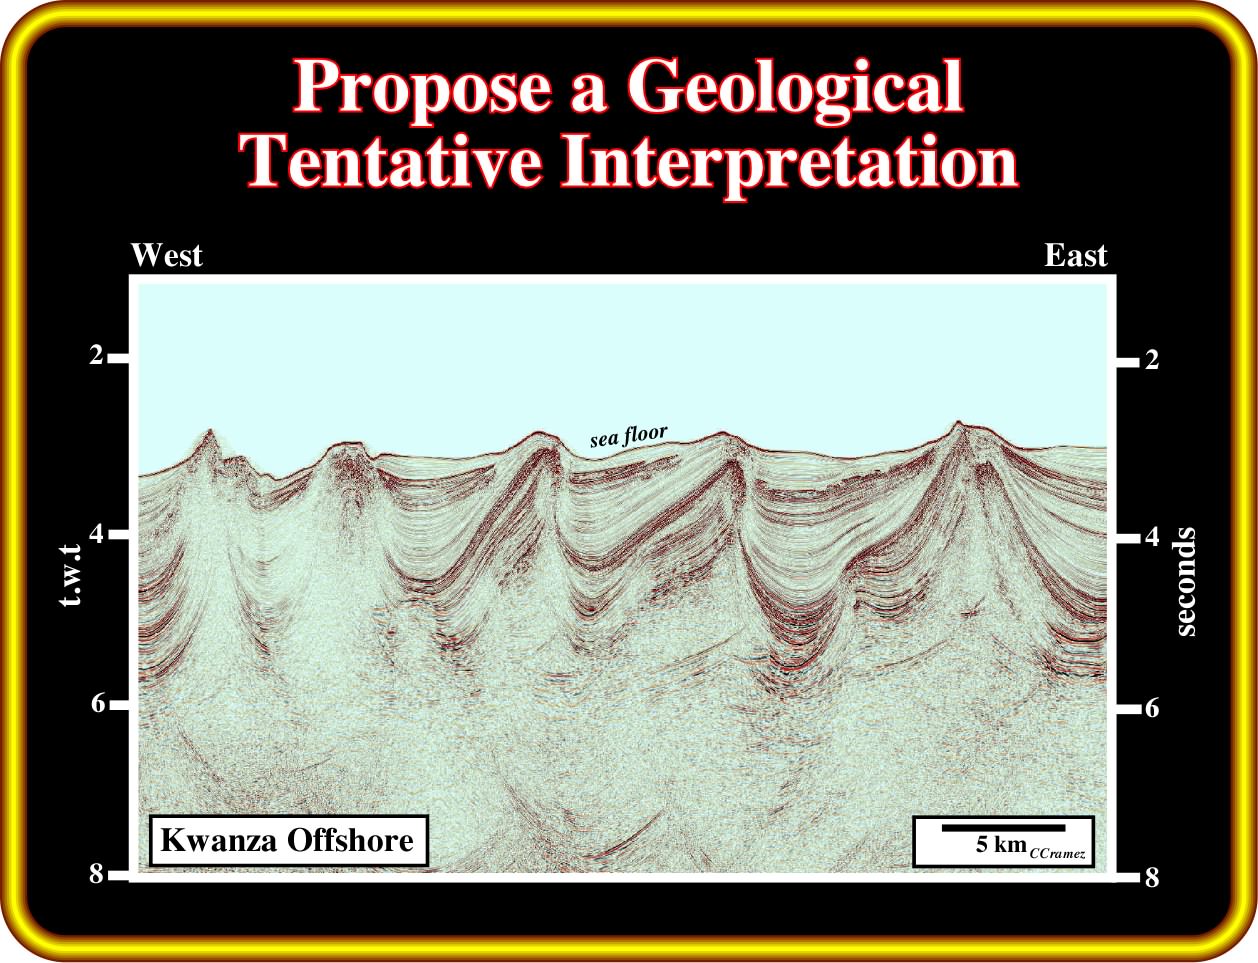
Start the tentativegeological interpretation by picking the bottom of the salt taking into account the seismic artefacts induced by the lateral variation of the salt thickness and Tertiary depocentres. How do you interpret the infra-salt strata ? Explain the shortening of the sediments overlying the salt induced tectonic disharmony.
Exercise 2:
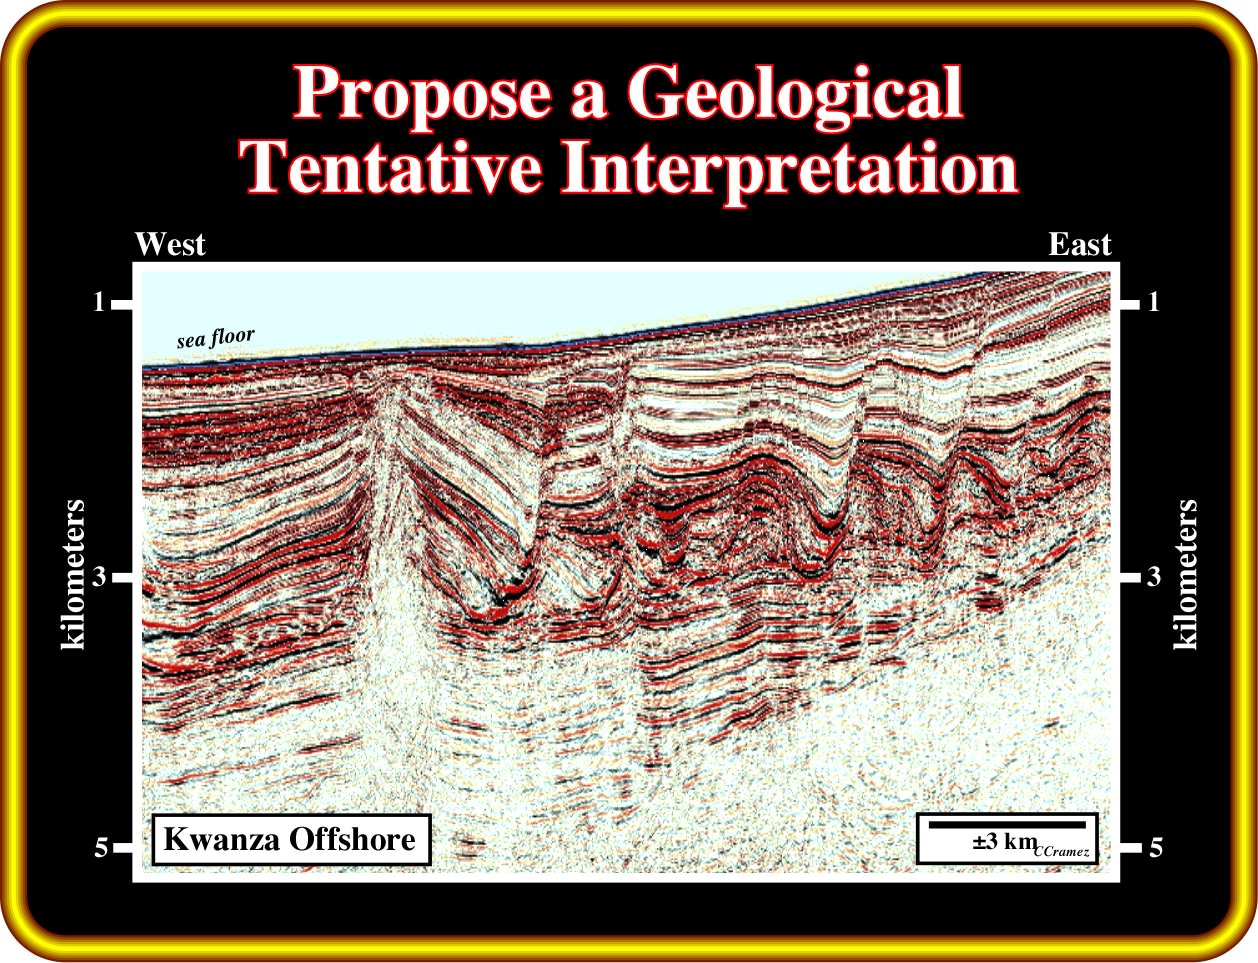
In your tentative interpretation give particular attention to the stratigraphy of the infra-salt strata, taking into account that in the expression infra-salt strata are included margin infra-salt sediments, subaerial volcanism, rift type basin sediments, basement and associated unconformities (erosional surfaces induced mainly by relative sea level falls). Pick the the breakup unconformity. Likewise, pick the limits of the evaporitic interval and associated salt and fault welds, as well as the the fault planes. Propose the more likely organic rich intervals.
Exercise 3:
Before starting the exercise 3, it is indispensable to revue how to use the different electrical logs to determine the facies, i.e., the lithology of the stratigraphic column.
a) Gamma ray - The gamma-ray tool reads natural gamma-ray radiation given off by rocks. Shales release a lot of natural gamma-rays, so they read high on the gamma-ray log. Sandstones and limestones do not release many gamma-rays, so they read low. The gamma-ray log is shown on the far left side. The scale, calibrated in gamma-ray API (American Petroleum Institute) units, is at the the top (0-125). There are 10 divisions on the gamma-ray scale, so each division represents 12.5 units.
b) Resistivity logs - The resistivity log is fundamental in formation evaluation because hydrocarbons do not conduct electricity while all formation waters do. Therefore a large difference exists between the resistivity of rocks filled with hydrocarbons and those filled with formation water. There are three curves here. Each curve measures the resistivity of the rock, including the fluid contained in the rock. The reading is made in “ohms,” which is a measurement of resistance of the rock formation to the flow of electricity. Porous formations containing mostly salt water (the kind of water normally found deep underground) have low resistivity, often just a couple of ohms. Formations that contain oil and gas have higher resistivities…perhaps 50-500 ohms. The three curves each “look” a different depth into the rock. The one we are interested in is marked “Deep Resistivity,” and is, often, drawn as a line with long dashes. This logging tool “looks” sideways into the the rock, to a depth of 6 feet or more. At this distance from the borehole, the natural oil or gas in the rock is usually undisturbed by the drilling process, so we can get a really good resistivity reading. Within the sandstone shown here, the deep resistivity reads up to 300 ohms. This very high resistivity indicates a reservoir that may contain oil or gas. But to be sure of this, we need to know something about the porosity of the rock, so we need another type of log. That’s because rocks with little or no porosity also have very high resistivities, but will not produce any oil or gas!
c) Porosity log - The scale at the top of the log shows (negative) -10% porosity on the right, 0% about 1/4 of the way over, and 30% porosity on the left. Clean sandstones have an absolute maximum of about 28% porosity. Shale porosity is much higher, but because the grain size of shale is so small, oil or gas trapped in shale cannot usually be removed by drilling for it (the exception is horizontal drilling in shale gas formations), so shale porosity is generally not important in a conventional well. Mixing shale into the sandstone formation also screws up the log readings!
d) Neutron log - The neutron log is a type of porosity log that measures the hydrogen present in the water atoms in a formation. Since shales contain a lot of water, bound up tight in their tiny pores, the neutron log reads very high porosities in shale formations. So, one must look at the gamma-ray log first to see if the rock is shaly. If it is, the neutron porosity doesn’t mean much!
e) SP and Caliper - The spontaneous potential log measures the natural difference in electrical potential, in millivolts, between an electrode in the borehole and a fixed reference electrode on the surface. The most useful component of this difference is the electrochemical potential since it can cause a significant deflection opposite permeable beds. The magnitude of the deflection depends mainly on the salinity contrast between drilling mud and formation water, and the clay content of the permeable bed. The spontaneous potential (SP) log is therefore used to detect permeable beds and to estimate formation water salinity and formation clay content. The SP log cannot be recorded in nonconductive mud. The caliper log measures the width of the drilled hole, in inches. The caliper scale is at the top; 6-16 inches, and the curve is, often, shown by a thinner, dashed line. Notice that the hole is very large through the shale formations (almost 16 inches) and narrow through the sandstone (about 8 inches). This is because the shales are relatively soft (as far as rocks go) and they have been “washed out” (the hole has been widened) by the circulating drilling mud. The sandstone is harder, and does not wash out so easily, so the hole size shown on the caliper is much closer to the actual size of the drill bit. In the sandstone, the hole is a little more than 8 inches in diameter.
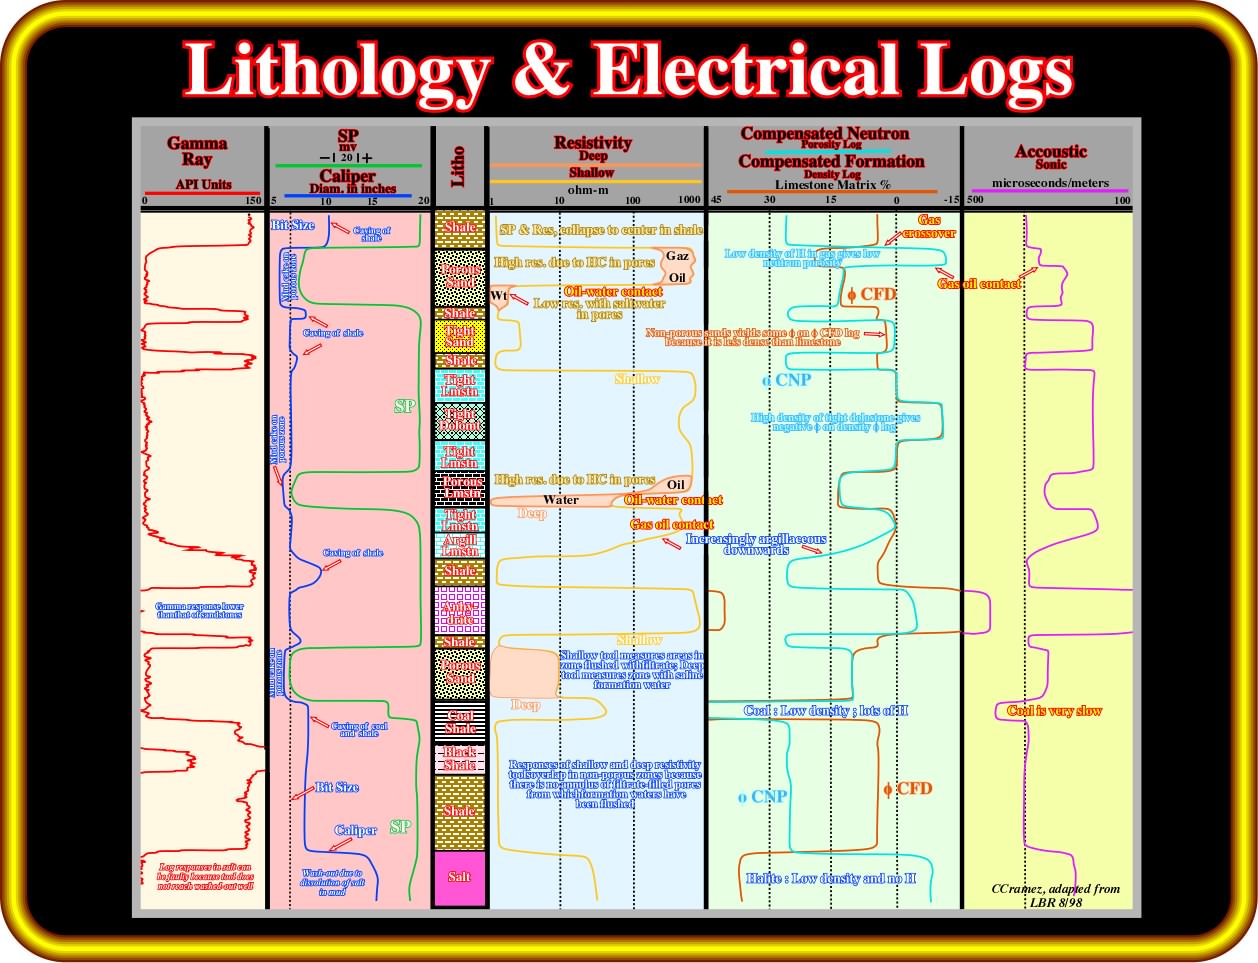
This plate summarize the answer of different electrical logs to an hypothetical stratigraphic column, in which are present shales, porous and tight sands, tight and porous limestones, coal, anhydrite and salt intervals. In addition, hydrocarbons are present in vertains porous intervaly. Taking into account all these information try to do the next exercise.
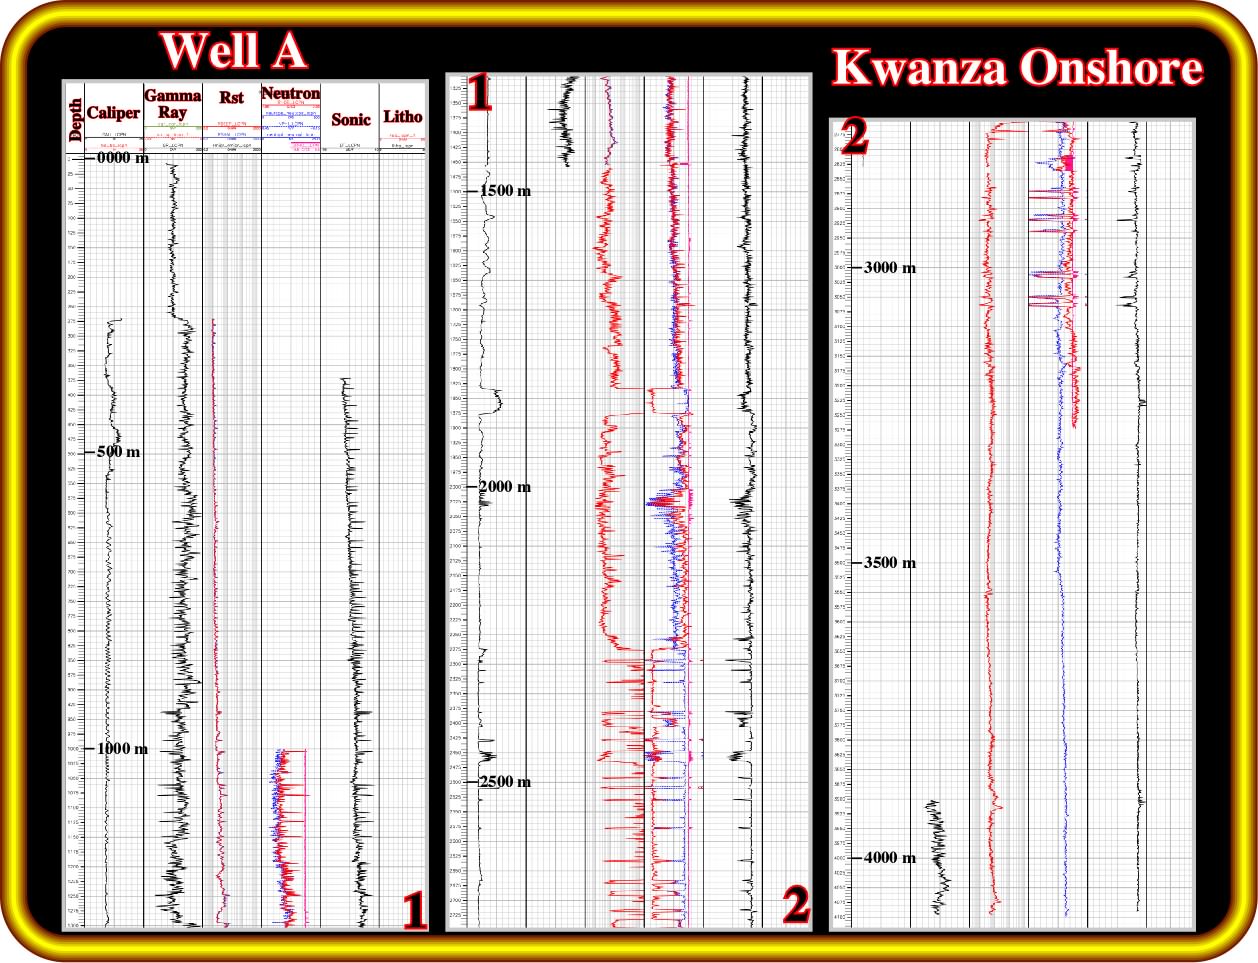
Using the electrical logs of a Kwanza onshore well illustrated in this plate, you must recognize the different sedimentary basins. Do not forget that the Kwanza onshore corresponds to stacking of different sedimentary basin : (i) Precambrian basement or a Paleozoic folded belt ; (ii) Upper Jurassic - Lower Cretaceous rift type basins and (iii) Meso-Cenozoic divergent margin Atlantic-type. Start to individualize the salt layer, which can be used to subdivided the stratigraphic column into post-salt, salt and infra-salt strata. Then try to recognize within the infra-salt strata the more likely location of the breakup unconformity, which underlines the lower limit of the margin infra-salt sediments, that is to say, the lower limit of the Cuvo formation (Gray Cuvo of Petrangol's geoscientists). Then propose a log-stratigraphy for the rift-type sediments, that is to say, below the breakup unconformity. I guess you are going to have a big surprise.
Exercise 4:
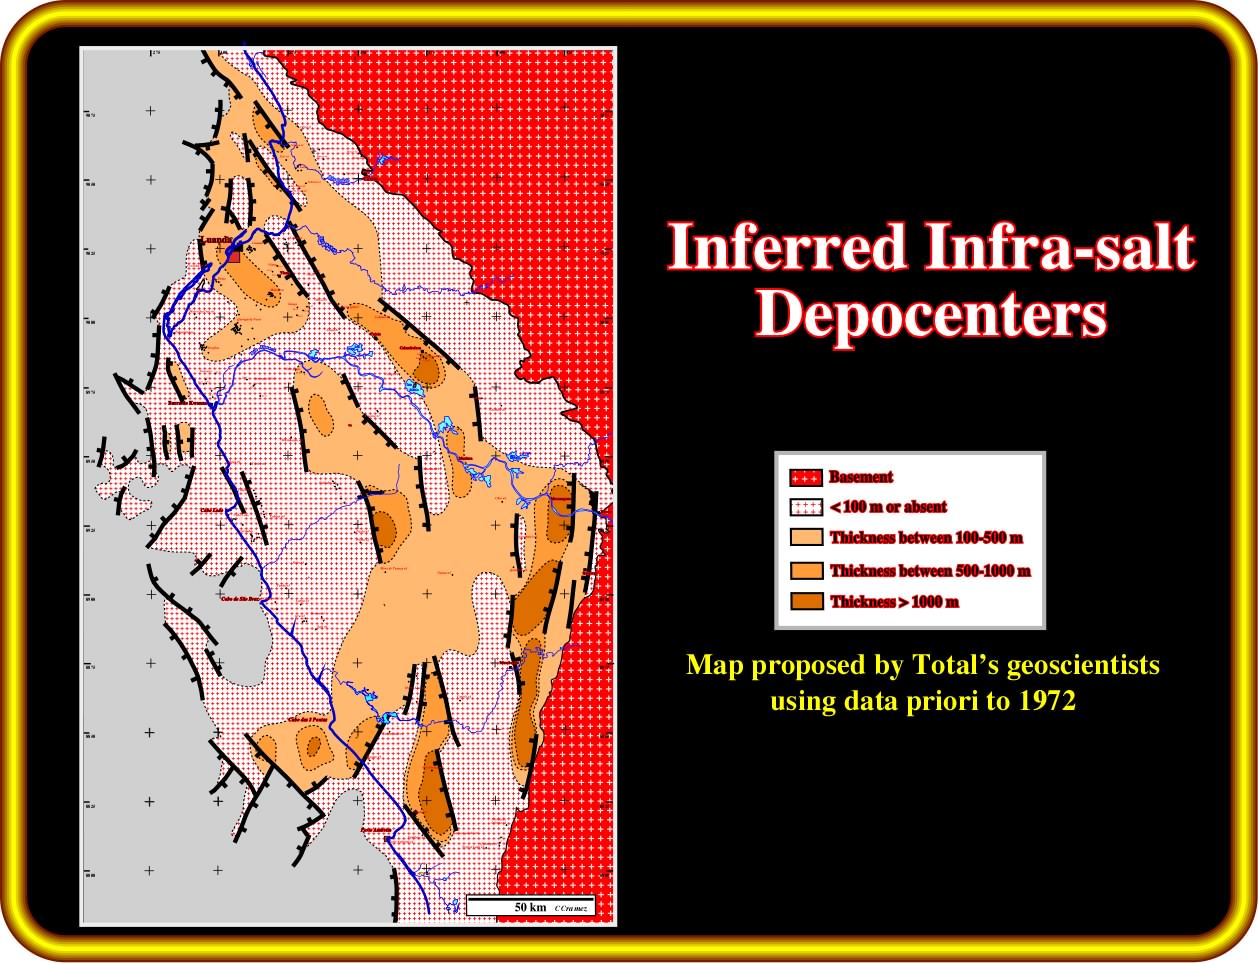
Using this tentative map of the infra-salt strata, build-up from wells' results and geological tentative interpretation of the old seismic lines, propose the more likely location of rift-type basins and margin infra-salt sediment depocenters. Justify the proposed locations.
to continue press
next
![]()