Universidade Fernando Pessoa
Porto, Portugal
The stratigraphic model proposed by Exxon team1 assumes that:
"Eustasy is the main factor driving the cyclicity of sedimentary deposits"
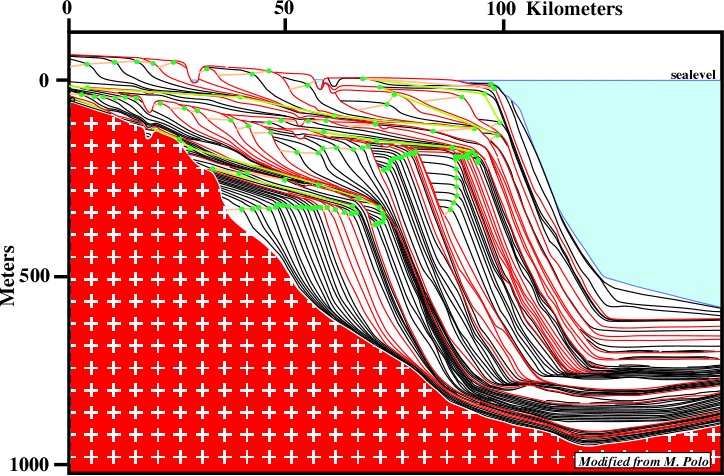
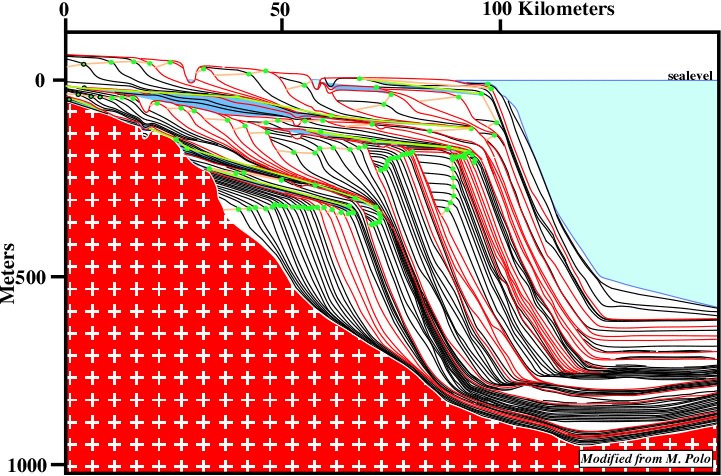
Fig. 1- Exxon’s stratigraphic model is here represented using the Marco Polo software. The vertical and horizontal scales are quite different. The vertical scale is metric while the horizontal is kilometric. The vertical exaggeration is almost 100 times. Each line corresponds to a chronostratigraphic line. Their spacing is 100 K years. The red lines correspond to unconformities, i.e. relative sea level falls. The green dots underline the successive positions of the shelf break. In this model the terrigeneous influx is constant (the area between to consecutive chronostratigraphic lines is the same).
Fig. 1 and 2 illustrate the classical sand-shale depositional model proposed by P. Vail and coauthors1 using a Marco Polo software2. In this model the main geological parameters affecting the stratal patterns are assumed to be:
They clearly emphasize that stratigraphic problems to P. Vail and co-authors are systemic3. All parameters are interconnected and interdependent. Their interconnections corroborate the new scientific paradigm, i.e. “systems thinking” and the Lovelock's Gaia hypothesis as well (1).
Several simplifications were used in this model which attempts to explain the cyclicity and the stratal patterns of sand-shale sedimentary intervals as recognized in the field, subsurface and seismic data:
These simplifications obey to Occam’s razor4. They follow the principle used by Bak: “observing details may be entertaining and fascinating for geologists but, in fact, they learn from generalities6”. Also, it is very important to remind here, again:
(i) the R. Magritte's purpose when he named his work of art “This is not a pipe” (difference between “being” and “representing”5), and
(ii) that all geological structures are scale invariant, i.e. without scale they cannot be correctly interpreted7.
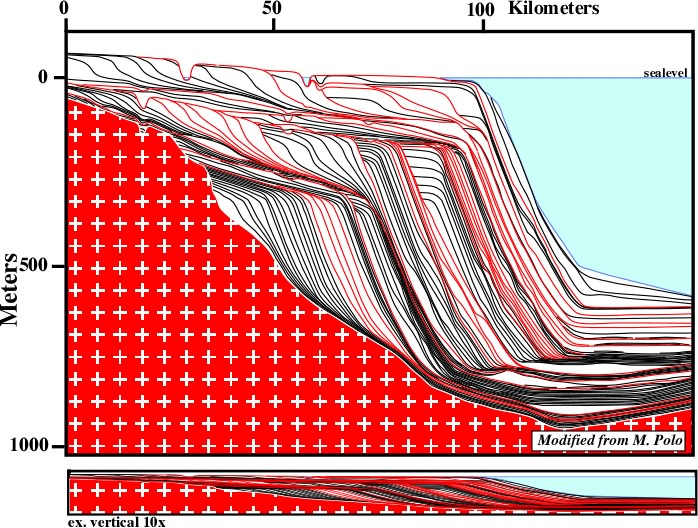
Fig. 2- Here, the Exxon’s stratigraphic model is represented at two different vertical scales. In the lower part of the figure, the model still is 10x vertically exaggerated. Notwithstanding, the majority of the geometric relationships between the chronostratigraphic lines cannot be recognized. The vertical exaggeration of a normal seismic line (time) ranges between 2 and 3.
Figs. 1 and 2 have different vertical and horizontal scales. They are both metric. However, they are quite different. The vertical exaggeration is almost 100 times the natural scale (1:1), as it exists in nature i.e. without magnification or reduction. With such an exaggerated models, it is evident that all geometrical relationships between bedding planes and unconformities are clearly emphasized either:
(i) onlaps, (ii) downlaps or (iii) toplaps.
However, and unfortunately, when the plates are drawn at natural scale (1:1) or, even, with vertical exaggerations of 5-10 times, the majority of these geometrical relationships cannot be recognized. Such conjectures are corroborated8 on the bottom of fig. 2, where the same depositional model is drawn with a vertical exaggeration of 10 times. As you can see for yourself, it is impossible to recognize the relationships between the bedding planes and the unconformities.
Fig. 3- During the regressive periods, the basin has not platform. In fact, during the forestepping intervals, the shelf break and the depositional coastal break (roughly the shoreline) are coincident. Only during the transgressive periods, a platform is developed as a consequence of the backstepping of the depositional coastal break. As the shoreline progressively moves landward, the water depth of the platform increases.
These features raise two major questions. The first one concerns the potentiality of seismic data on determining and understanding correctly systemic stratigraphy:
1) Under what conditions the Exxon's sand-shale model can be used on seismic data, where the vertical time scale, when converted in depth, shows vertical exaggerations ranging between 2x and 10x?
The second question, is more general. It concerns the geological validity of eustatic dogma:
2) Are sea level changes the major factor of the cyclic displacements of sedimentary intervals and the cause of the discontinuities bounding those intervals?
In other words, is the Exxon's basic stratigraphic hypothesis9:
"Subsidence and Terrigeneous influx rates are smaller than sea level changes, i.e. Eustasy"
valid in all sedimentary basins? Are these geological conditions satisfied in basins associated with the formation of megasutures10, such as back-arc, foredeep basins and folded belts?
The Exxon's carbonate depositional model is illustrated on fig. 5 using Marco Polo software. In this model, the parameters Eustasy and Subsidence are exactly the same that those used in the sand-shale model (fig 1-3). In other words, the relative sea level curve is the same in both models.
The only difference is the sedimentary input. In the previous sand-shale model, the sediments are transported from the continent toward the sea and the terrigeneous input is conventionally taken as constant (the surface between two consecutive chronostratigraphic lines is kept invariable).
In the carbonate model, the sediments are created in place by algal and reef production. Such an organic production is function of the water depth. The maximum of production ranges between 2 and 3m (fig. 4) and it decrease progressively until the bottom of the photosynthesis zone. Below this limit (roughly 80-100 meters), the absence of light prevent all algal production.
Actually, algal production disappear around 30-40 m of water depth and reef growing becomes nil at the compensation depth11, i.e. a the lower boundary of the euphotic zone, which corresponds to the part of the ocean in which there is sufficient penetration of light to support photosynthesis.
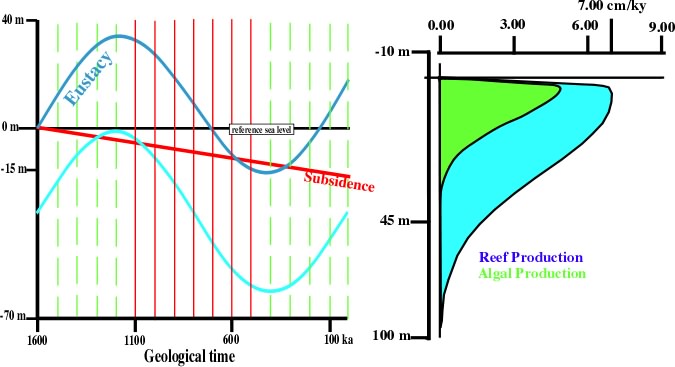
Fig. 4- To build the carbonate sedimentary model shown in fig. 5, we have used the eustatic curve and the subsidence illustrated on the left. In the used carbonate function (on the right), the algal and reef production are maximal (5-7 cm/ky) near the surface (2-3 meters water depth).
At first sight, the stratal patterns of the carbonate model look quite different from those associated with the sand-shale facies. Nevertheless, the geometrical relationships between the chronostratigraphic lines are the same. In fact, looking attentively, the same the seismic surfaces, i.e. the surfaces defined by the reflection terminations are recognized, as well as the same systems tracts.
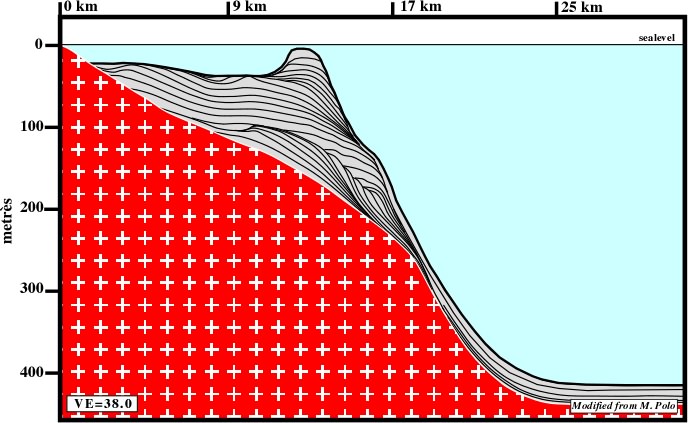
Fig. 5- The sedimentary carbonate model illustrated here was build using Marco Polo software and the same relative sea level curve than in the sand-shale model (fig.1). Only, the terrigeneous influx was replaced by a carbonate function (fig. 4), in which algal and reef production are maximal (5 to 7 cm per 100.000 years) near the surface (2 - 3 meters water depth).
The same questions formulated previously for the sand-shale model are valid for the carbonate model:
Can the geometrical relationships illustrated in the model be recognized on seismic profiles, where the vertical time scale, when converted in depth, show vertical exaggerations ranging between 2x and 10x ?
Explorationists using these models should not forget that:
(i) numerical models contain closed mathematical components that may be verifiable, just as an algorithm within a computer program may be verifiable12,
(ii) finer scale structure and process are lost from consideration, a loss that is inherent in continuum mechanics approaches12.
A review of the geological hypotheses proposed as alternative to the Exxon eustasy model will be made later.
For the moment, it will be more useful to show the complementarity between Systemic Stratigraphy and GeneticStratigraphy13&14. The use of one or another of these stratigraphic approaches depends mainly on :
(i) the geological problems to be solved and
(ii) the location of the area under study.
____________________________________________________________________________
Notes (Depositional models), (see Bibliography):
1- see Vail (1977).
In this model, Vail and coauthors have assumed that the complete- ness of the stratigraphical interval deposited during an eustatic cycle of 3rd order (0.5-3.0 My) was practically 100%.
They assumed than the sedimentary processes were active during all time interval, i.e. they assumed that sedimentation was a continuous process. Such an assumption is just not true. The completeness of a stratigraphic interval is seldom higher than 20%, i.e. the sedimentary processes are discontinuous and catastrophic. In this perspective, one can say that Vails's model is holistic. It forms a whole in which the study of its parts, i.e. depositional systems, can only be approached when the organization of the whole is known. Thus the “building blocks” or sequences (Vail's sense) are a whole, composed by different part, which by itself is at the same time a part of a larger whole.
2- see M.P. Software (1991).
In this software, the surface between the consecutive chronostratigraphic lines is constant and it represents a constant terrigeneous influx.
3- see Capra (1996).
4- see Palmer (1988).
Occam’s razor is a principle of simplification derived from William of Ockham, or Occam. It cautions, “Do not multiply entitles beyond necessity. Given two theories, each of which adequately accounts for all observable data, the simpler theory is the correct theory.
5 - see Bak (1996).
6- see Wynn (1997), pp. 109.
7 - see Turcotte (1992).
The scale invariance of geological phenomena is one of the first concepts taught to a student of geology. It is pointed out than an object that defines a scale, i.e. a coin, a rock hammer, a person, must be included whenever a photograph to determine whether the photograph cover 10 cm or 10 km. For example, self-similar folds occur over this range of scales. Another example would be an aerial photograph of a rock coastline. Without an object with a characteristic dimension, such as a tree or a house, the elevation of the photograph cannot be determined.
8 - see Naomi (1994).
Corroboration is not synonym of verification. In fact, an hypothesis can be corroborated by observations and experimentations, but it can never be verified. The true in science does not exist. Actually, it is impossible to demonstrate the truth of any proposition, except in a closed system. Geological models are never closed systems. Observation and measurements have both independent and dependent variables. They are laden with inferences and assumptions.
The construction of a numerical simulation model involves the specification of input parameters at some chosen scale. Typically, the scale of the model elements is on the order of meters, tens of meters, or kilometers. In contrast, the scale on which input parameters are measured are much smaller, and the relation between those measurements and larger scale model parameters is always uncertain and generally unknown.
9- see Vail (1989).
10- see Miall (1997).
11 - see Bates (1980).
Compensation depth does not be taken as carbonate compensation depth, i.e. the level below which the rate of solution of calcium carbonate exceeds the rate of its deposition. In Pacific Ocean, this level is at 4000-5000 m. In the Atlantic it is somewhat shallower.
12 - Quoted in Naomi (1994), pp. 641.
13 - See Duval (1993).
The term cyclic replaces the misleading term sequence. A cyclic interpretation is an interpretation made in stratigraphic cycle. They can be sequences, continental encroachment cycles or continental encroachment subcycles. The majority of seismic lines cannot be interpreted in sequence cycles, since very often these stratigraphic cycles are under seismic resolution.
14 - see Galloway (1983) and Galloway (1989a &b).
_______________________________________________________________
(1) A “system” can be defined as a complex of elements standing in interaction (Bertalany).
________________________________________________________________
Systemic1 and genetic stratigraphic2 approaches are complementary. Such a complementarity is particularly true in hydrocarbon exploration, where the predictions of the more likely potential source rocks (generating petroleum subsystem3) and reservoirs (entrapment petroleum subsystem3) are of paramount importance.
On regional seismic lines, which generally are long lines, genetical stratigraphic interpretations performed in terms of “transgressions / regressions” are easier than systemic interpretations when performed at lower hierarchical levels4, i.e. “sequence cycles” or “continental encroachment subcycles”.
Systemic stratigraphy is based on identification of unconformities5 (see fig. 6, Hierarchical Level of Interpretation), while Genetic stratigraphy is, mainly, based on the recognition, through time, of the displacements of successive depositional coastal breaks (roughly the shoreline) and downlap surfaces (fig. 7, Hierarchical Level of Interpretation).
During a transgression, the shelf break and the depositional coastal are individualized and the distance between them increase since the shoreline is progressively displaced landward. During the regression, this distance decrease progressively and it happens very often that the depositional coastal break and the shelf break become coincident. If that takes place, the sedimentary basin has no platform.
The interpretation of the seismic line illustrated in fig.7 is quite easy whether in cycles bounded by unconformities (systemic stratigraphy) or in cycles transgression / regression (genetic stratigraphy). The vertical is largely exaggerated. Onlap and toplap surfaces are easily recognized. The identification and mapping of the unconformities bounding the different stratigraphic encroachment sub-cycles can be made without difficulty. However, due to the reasons invoked previously, in this normal seismic data (vertical exaggeration 2-5 times), the interpretations (systemic or genetic) can only be correctly performed at high hierarchical levels.
In normal conditions, explorationists must know, since the beginning of interpretation of seismic data, at what hierarchical level it must be performed. In order to achieve such a task, Duval6 proposed a hierarchy for different stratigraphic cycles mixing cycles bounded by unconformities (systemic stratigraphy) with cycles bounded by downlap surfaces (genetic stratigraphy). A hierarchy of stratigraphic intervals, based exclusively on the picking and dating of unconformities, will be proposed, later on, in these notes.
Genetic interpretations are equally easy when performed in vertical exaggerated mathematical models, cross-sections, electric logs, or seismic lines shot through thick sedimentary depocenters (high rate of sedimentation). In such a data, offlap breaks (coastal or, and, shelfal) and major downlap surface (interfaces between backstepping and forestepping geometries) bounding the different genetic cycles are easily recognized:
-A backstepping or a retrogradational geometry, underlines a transgression, i.e. a landward displacement of the coastal deposits.
-A forestepping, or a progradational geometry, emphasizes a regression, i.e. a seaward displacement of the coastal deposits.
The to and fro movement of coastal deposits, generally, is not only associated with the worldwide sea-level regime and its fluctuations induced by absolute changes in the quantity of sea-water7. The displacements of shorelines are, in fact, mainly related with relative sea level changes resulting from the interactions between:
(i) Sea level changes,
(ii) Subsidence (Tectonics) and
(iii) Terrigeneous influx.
Coastal deposits (roughly the shoreline) can be associated either with the coastal break or shelf break. During a transgressive episode there is individualization and a progressive landward displacement of the depositional coastal break, which creates of a platform environment.
In petroleum exploration, systemic interpretations are mainly used in petroleum exploration to predict potential reservoir rocks; they onlap against the unconformities. Genetic interpretation is mainly used to predict major potential marine source-rocks, which are associated with downlap surfaces.
_____________________________________________________________________________________________
Notes (Systemic and Genetic Stratigraphy), (see Bibliography):
1 - see Vail (1977).
The term systemic stratigraphy translates better than sequence stratigraphy the holistic approach of Stratigraphy. In addition, as said before the term sequence is misleading because it can be used to express the study of different stratigraphic intervals.
2 - see Galloway (1983).
In genetic stratigraphy, the transgressive - regressive facies cycles are the more important stratigraphic intervals. The boundaries can be downlap surfaces or unconformities (onlap surfaces).
3 - see Demaison (1980 ?).
A petroleum systems, i.e. the genetically relationship between an hydrocarbon accumulation and a source rock, for example - La Luna - Misoa sandstones, in Maracaibo basin (Venezuela), can be divided into two subsystems. The generating petroleum subsystem and the migration - entrapment petroleum subsystem.
4 - see Duval (1993).
5 - Ibid.
6 - Ibid.
7 - see Mörner (1976).
_______________________________________________________________________________
In spite of the hierarchy theory is embraced by a large majority of geologists, it will be usefully to remind certain of its aspects advanced mainly by Huxley1 and Koester2. Thus, I will start with the parable of the “Two Watchmakers” taken from Koestler's book “The Ghost in the Machine”. In fact, it illustrates the main principles and advantages of the hierarchy theory.
“There were once two Swiss watchmakers named Bios and Mekhos, who made very fine and expensive watches. Although their watches were equal in demand, Bios prospered, while Mehkos just struggled along; in the end he had to close his shop and take a job as mechanic with Bios. The people in the town argued for a long time over the reasons for this development and each had a different theory to offer, until the true explanation leaked out and proved to be both simple and surprising. The watches they made consisted of about one thousand parts each, but the two rivals had used different methods to put them together. Mekhos had assembled his watches bit by bit rather like making a mosaic floor out of small colored stones. Thus, each time when he was disturbed in his work and had to put down a partly assembled watch, it fell to pieces and he had to start again from scratch. Bios, on the other hand, had designed a method of making watches by constructing, for a start, sub-assemblies of about ten components, each of which held together as an independent unit. Ten of these sub-assemblies could then be fitted together into a sub-system of a higher order; and then of these sub-systems constituted the whole watch. This method proved to have two immense advantages. In the first place, each time there was an interruption or a disturbances, and Bios had to put down, or even drop, the watch he was working on, it did not decompose into its elementary bits; instead of starting all over again, he merely had to reassemble that particular sub-assembly on which he was working at the time; so that at worst (if the disturbance came when he had nearly finished the sub-assembly in hand) he had to repeat nine assembling operations, then Mekhos will take four thousand times longer to assemble a watch than Bios. Instead of a single day, it will take him eleven years. And, if for mechanical bits we substitute amino acids, protein molecules, organelles, and so on, the ratio between the time-scales becomes astronomical; some calculations indicate that the whole lifetime of the earth would be insufficient for producing even an amoeba - unless he becomes converted to Bios' method and proceeds hierarchically, from simple sub-assemblies to more complex ones. A second advantage of Bios' method is of course that the finished product will be incomparably more resistant to damage, and much easier to maintain, regulate, and repair, than Mekhos's unstable mosaic atomic bits”
The universal characteristics of hierarchies are the relativity and, indeed, the ambiguity, of the terms “part” and “whole” when applied to any of sub-assemblies. “A part as we generally use the word”..... wrote Abraham3......”means something fragmentary and incomplete, which by itself would have no legitimate existence. On the other hand, a whole is considered as something complete in itself which needs no further explanation. But wholes and parts, in this absolute sense, just do not exist anywhere, either in the domain of living organisms, geological structures or social organizations. What we find are intermediary structures on a series of levels in an ascending order of complexity: sub-wholes which display, according to the way you look at them, some of the characteristics commonly attributed to parts”.
The relativity of the hierarchies, known as Janus dualism(1), it is an important feature in system thinking, because in this scientific approach, not only geologists progress from the general to the particular and they can not study geological events in isolation. In fact, geological structures, as well as biological structures, are multileveled, i.e. each of them forms a whole with respect to its parts while at the same time being a part of a larger whole4. In this perspective, geological structures, and particularly stratigraphical intervals, have a hierarchical nature which implies different levels of stratigraphic interpretations.
Systems thinking paradigm recognizes very clearly the existence of hierarchical levels (levels of different complexity), with different kinds of laws operating at each level. In fact, in Stratigraphy, at each level of complexity, i.e. at each hierarchical level, the observed phenomena exhibit properties that do not exist at the lower levels. For example, the properties of a stratigraphic “parasequence cycle” are far different from those of a “sequence cycle”, “continental encroachment subcycle” or “continental encroachment cycle”5.
Thus, one can say that Stratigraphy is an “open system” and a multilevel complex geological whole composed by parts with different levels of complexity (stratigraphic cycles) having different properties (thickness, geometry, facies, etc.). These internal geometrical relationships allow us to put in evidence low-level stratigraphic intervals know as systems tracts 7, i.e. linkages of genetically related depositional systems8 .
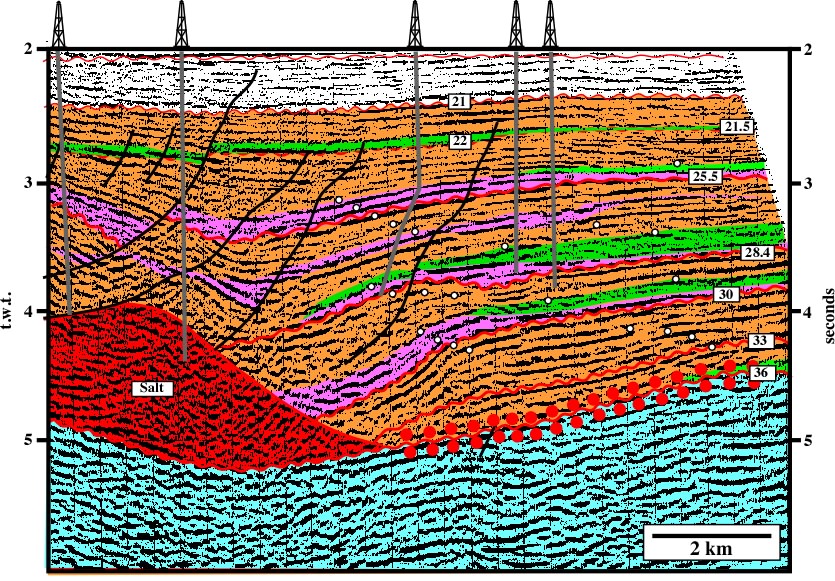
Fig. 6- This conventional 2D seismic line from onshore USA is one of the rare lines (actually it is a portion of a much larger line) that can be interpreted in sequence cycles, particularly above the salt layer (in red). Each unconformity (relative sea level fall) bounded sequence stratigraphic intervals is calibrated by the wells. Their age is proposed in million years. The large red dots underline a salt weld. The white dots mark the successive positions of the shelf break. The stratigraphic intervals colored in purple correspond to lowstand systems tracts. Those colored in green correspond to transgressive systems tracts and those colored in orange correspond to highstand systems tracts.
In figs. 6 and 7 , the ages of unconformities SB. 25.5 Ma and SB. 28.4 Ma, are based on micropaleontological results of the exploratory wells drilled in the area. The ages proposed to unconformities older than SB. 28.4 Ma are speculative. These unconformities are not calibrated. The wells located on the left part of the seismic profile reached the allochthonous salt nappe, but they did not recognize the sediments overlying the salt weld (2) which is, conventionally, underlined by double red dots.
Detailed interpretations, as illustrated on plate 6, can not be done in basins with moderate or low rates of sedimentation. The North Sea regional profile illustrated in fig. 7, for example, allows only systemic or genetic geological interpretations at high hierarchical level. However, genetic interpretations are easier than systemic interpretations. In fact, the seismic characteristics of downlap surfaces are sharper and more continuous than those of unconformities.
The genetic interpretation illustrated in fig. 7, based on the picking of the major transgression / regression facies cycles, shows:
(i) The time interval between successive unconformities, or downlap surfaces, is always higher than 3.0 My.
(ii) The limits between transgressive and regressive episodes are downlap surfaces which emphasize hiatus of non deposition.
(iii) Downlap surfaces are associated with condensed stratigraphic sections where faunistic peaks are abundant. Consequently, they are better, and easier, dated than unconformities.
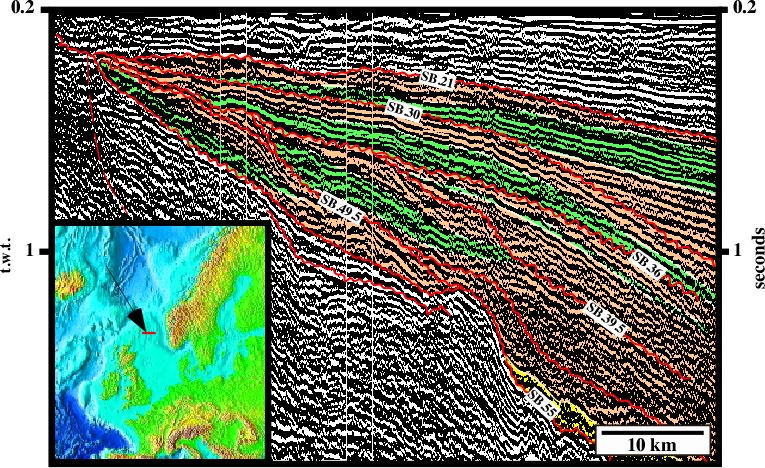
Fig. 7- This seismic line from North Sea illustrates an interpretation a genetic interpretation. The major transgressions (in green) and regressions (in brown) are recognized. As illustrated the limit between a transgressive and a regressive interval corresponds to downlap surfaces. However, the limit between a regressive and a transgressive interval do not necessarily correspond with an unconformity.
(iv) The limits between regressive and transgressive episodes are flooding surfaces or unconformities.
(v) In proximal parts of a basin, particularly, landward of lowstand deposits, the interfaces between regressive and transgressive episodes belonging to different stratigraphic cycles are unconformities. However, if both episodes are parts of the same stratigraphic cycle, the interface between them corresponds to a flooding surface.
(vii) On distal parts of a basin, it is possible to find successive regressive intervals pertaining to different stratigraphic cycles separated unconformities. In other words, basinward shifts of coastal onlaps (unconformities) do not necessarily change the forestepping geometry of the deposits.
________________________________________________________
Notes (Hierarchical levels of interpretation), (see Bibliography):
1 - see Huxley (1925).
2 - see Koestler (1967).
3 - see Abraham (1994).
4 - see Capra (1966).
5 - see Duval (1993).
6 - see Sadler (1990).
Stratigraphic sections are archives of local geological history. The records are layers of sedimentary rocks that are filed away in sequence, but numbered on a scale of rock thickness, rather time. As a result of interludes of erosion or non-deposition, stratigraphical sections incorporate hiatuses; in terms of our metaphor, some records are removed, some are never filed and the archives become incomplete. Consequently, every section poses three basic time-stratigraphical questions:
1 - How much time do the individual rocks layers record?
2 - How much time elapsed during the accumulation of the whole section?
3 - How much of the latter time interval was spent depositing the rocks layers?
The third question enquires about the possible completeness of the record events preserved in the section. The answer has been termed the stratigraphical completeness of the section (Sadler, 1981).
7 - see Vail (1977).
8 - see Bates (1980), pp. 214.
A depositional system is characterized by a facies (lithology) and an associated fauna. Then, to be able to propose lithological predictions interpreters must reach systems tracts hierarchical level.
______________________________________________________________________________
Footnotes (Hierarchical levels of interpretation):
(1) Janus was a God of romans. He had two opposite faces expressing the dualism between a whole and its parts.
(2) On this seismic line the allochthonous salt is deeper than 8 seconds. The salt visible on this line is allochthonous salt. The salt weld, i.e. the interface between sediments that originally were separated by salt, as well as the allochthonous salt are associated with a second generation salt nappe.
to continue press
next
![]()
Send E-mail to carloscramez@gmail.com with questions or comments about this course.
Copyright © 2001 CCramez
Last modification:August, 2014