
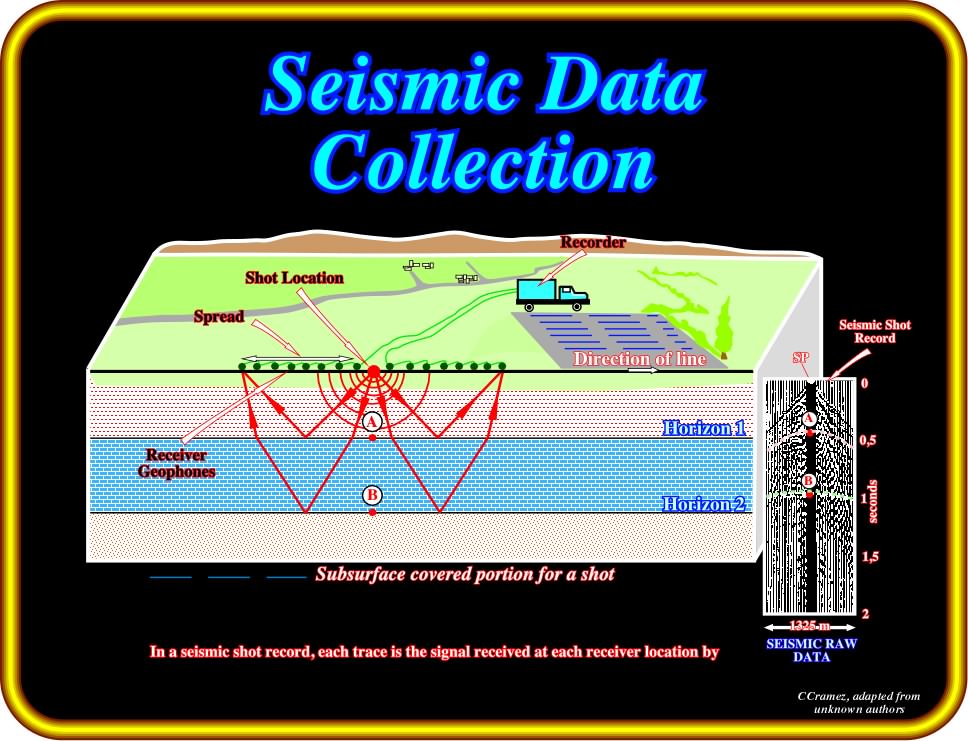
Seismic techniques, generally, involve measuring the travel time of certain types of seismic energy from superficial shots (explosion or weight drop) through the subsurface to arrays of ground motion sensors or geophones. In the subsurface, seismic energy travels in waves that spread out as hemispherical wavefronts. The energy arriving at a geophone is described as having traveled a ray path perpendicular to the wavefront. In the subsurface, seismic energy is refracted (bent) and/or reflected at interfaces between materials with different seismic velocities. The refraction and reflection of seismic energy at density contrasts follows exactly the same laws that govern the refraction and reflection of light through prisms. Each seismic ray that strikes a density contrast a portion of the energy is refracted into the underlying layer, and the remainder is reflected at the angle of incidence. The reflection and refraction of seismic energy at each subsurface density contrast, and the generation of surface waves, and the sound at the ground surface all combine to produce a long and complicated sequence of ground motion at geophones near a shot point. The ground motion produced by a shot is typically recorded as a wiggle trace for each geophone (at right on this plate). Seismic refraction involves measuring the travel time of the component of seismic energy which travels down to the top of rock, is refracted along the top of rock, and returns to the surface. Seismic reflection uses field equipment similar to seismic refraction, but field and data processing procedures are employed to maximize the energy reflected along near vertical ray paths by subsurface density contrasts. Reflected seismic energy is never a first arrival, and therefore must be identified in a generally complex set of overlapping seismic arrivals - generally by collecting and filtering multi-fold or highly redundant data from numerous shot points per geophone placement. Therefore, the field and processing time for a given lineal footage of seismic reflection survey are much greater than for seismic refraction. (http://www.enviroscan.com/html/ seismic_refraction_versus_refl.html).
During my petroleum exploration career and academic activities, I have noticed that the approach to major problems in Earth sciences, and particularly the geological tentative interpretations of seismic lines is, still, dependent on Bacon’s heritage. In fact, Bacon (Novun Organum, 1620) strongly suggested that the scientific approach in natural sciences should be inductive. He considered Induction as the demarcation criteria between science and pseudo-science, theology or metaphysics.
“Scientific theories and hypotheses
should be established and justified by repeated observations”
In spite of the fact that J. Liebig (1985) and K. Popper (1934) criticize and partially rejected the use of inductive method on Natural Sciences, this approach still is strongly anchored in several oil companies. A lot of geoscientists are still convinced that they can make coherent and appropriate geological tentative interpretations of seismic lines without knowing Geology. Nevertheless, it is easy to show that seismic lines, such as the one, which tentative interpretation is depicted on Plate 1 (see below), can only be correctly interpreted, in geological terms, when the interpreter knows the geology of the area where the line was shot.
“Theory precedes Observation” (K. Popper, 1934), that is to say, an explorationist can only recognize on a seismic line, in the field or on an electric log, what he knows. If he does not know what a thrust-fault or an incised valley is, he can spend weeks looking at one or several seismic lines or outcrops, but, unfortunately, the final result will always be the same:
"a geometrical description of more or less continuous and well visible reflections or bedding planes without understanding how they fit in the regional and global setting”
When a seismic line is shown to:
a) A geoscientist trained in seismic processing, he will recognize, besides the major reflections, multiples, diffractions, and coherent or incoherent noise patterns, etc ;
b) A geoscientist trained in structural geology, he will recognize faulted blocks, growth-faults, anticlines, synclines, normal faults, etc ;
c) A geoscientist trained in depositional processes, he will recognize prograding shelf edges, submarine fans, incised valleys, reefs, etc ;
d) A geoscientist familiar with episodic depositional concepts, he will recognize turbidites, point bars, tidal deposits, shoreface sands, etc ;
e) A geoscientist knowing the basic eustatic concepts, he will recognize stratigraphic-cycles, eventually sequence cycles, downward shifts of coastal onlaps, lowstand deposits, highstand deposits, etc.
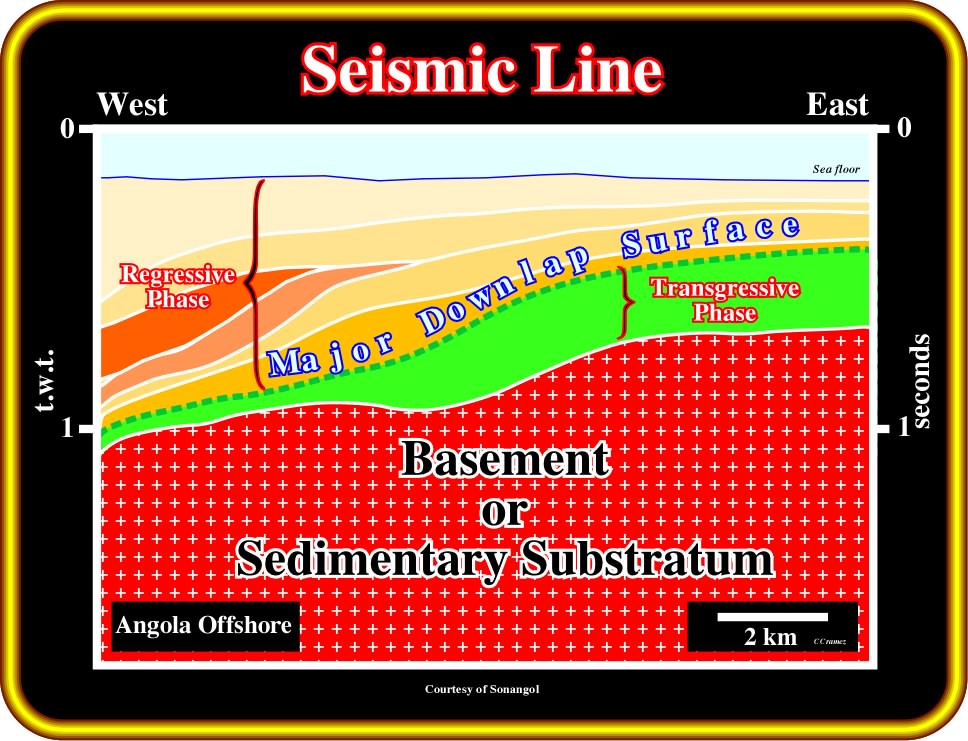
Plate 1- This tentative interpretation of a seismic line shot on the conventional Angola offshore (< 200m) illustrates the proximal area of the Kwanza basin. This offshore is composed by the stacking of different sedimentary basins. The infrastructure is either a Precambrian granitic basement or a sedimentary substratum (Precambrian foldbelt and/or Karoo). The basement outcrops few kilometers eastward with a granitic facies (gneiss with garnets). The basements is overlaid by Upper Jurassic/Lower Cretaceous rift-type basins (not visible on this segment of the original seismic line) and a Meso-Cenozoic Atlantic-type divergent margin. The margin is composed by a transgressive and regressive phase. The transgressive phase has a backstepping geometry, while the regressive phase has a forestepping geometry. The interface between the transgressive and regressive phases corresponds to a major downlap surface. However, as depicted, near the borders of the basin, the boundary between these sedimentary phases of the post-Pangea continental encroachment stratigraphic cycle is quite subtle. Several unconformities, associated with relative sea level falls, can be recognized, particularly in the regressive phase. As probably you, already, realized, in this short course, we used the basin classification proposed by Bally and Snelson (1980), which is based in the realm of subsidence and, by far, the more adapted to hydrocarbon exploration. Due to confidentiality reasons, as said previously, in the majority of the plates, only the geological tentative interpretation of the seismic lines is illustrated. Nevertheless, the uninterpreted seismic lines will be display during the short course.
If you think I am exaggerating, you can make a quick test using the sketch depicted on Plate 2, which depicts a potential stratigraphic model for the Mahakam offshore (Indonesia), in which the more or less continuous seismic reflections (chronostratigraphic lines) were taken from different seismic lines of the area.
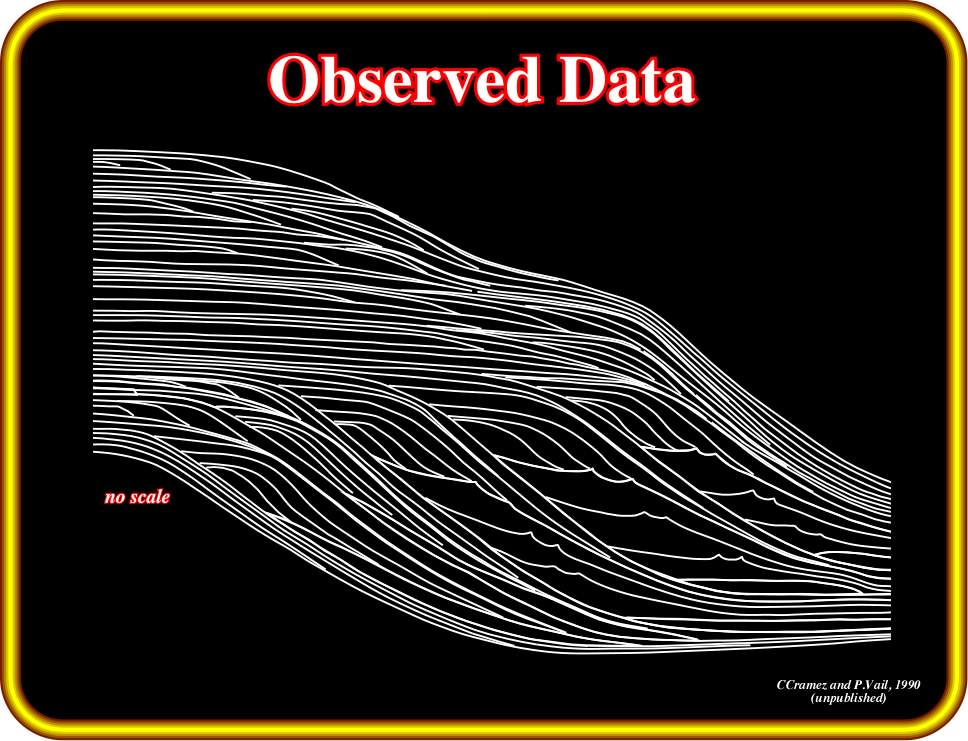
Plate 2- On this sketch, the white lines highlight more or less continuous seismic reflectors, taken from different seismic lines shot on the offshore Kalimantan, in East Indonesia (Mahakam delta). Knowing the global and regional geological settings of this area (non-Atlantic divergent margin, in Bally's basin classification), the major stratigraphic events can be recognized from the geometrical relationships between reflections and seismic surfaces defined by reflection terminations (see Plate 3). All sedimentary intervals, bounded by the successive white pencil lines, represented in this model, were deposited during the oceanization of the basin, that is to say, after the breakup of the lithosphere and subsequent formation of new oceanic crust (a non-Atlantic divergent margin overlying a backarc basin).
What do you see in the sketch depicted on Plate 2?
If you are trained in sequential stratigraphy, it is possible that you recognized something similar to what is illustrated on Plate 3. In other words :
a) The cyclicity of the data ;
b) The downward shifts of coastal onlaps ;
c) The sequence-cycle boundaries (associated with 3rd order eustatic cycles) ;
d) The lowstand and highstand deposits ;
e) The regression / transgression cycles (Genetical Stratigraphy);
f) the maximum flooding surfaces ;
g) The most likely location of the potential source-rocks ;
h) The most likely location of the potential sandstone reservoir-rocks ;
i) The most likely location of the potential seal-rocks ;
j) The most likely location of the potential stratigraphic traps, etc.
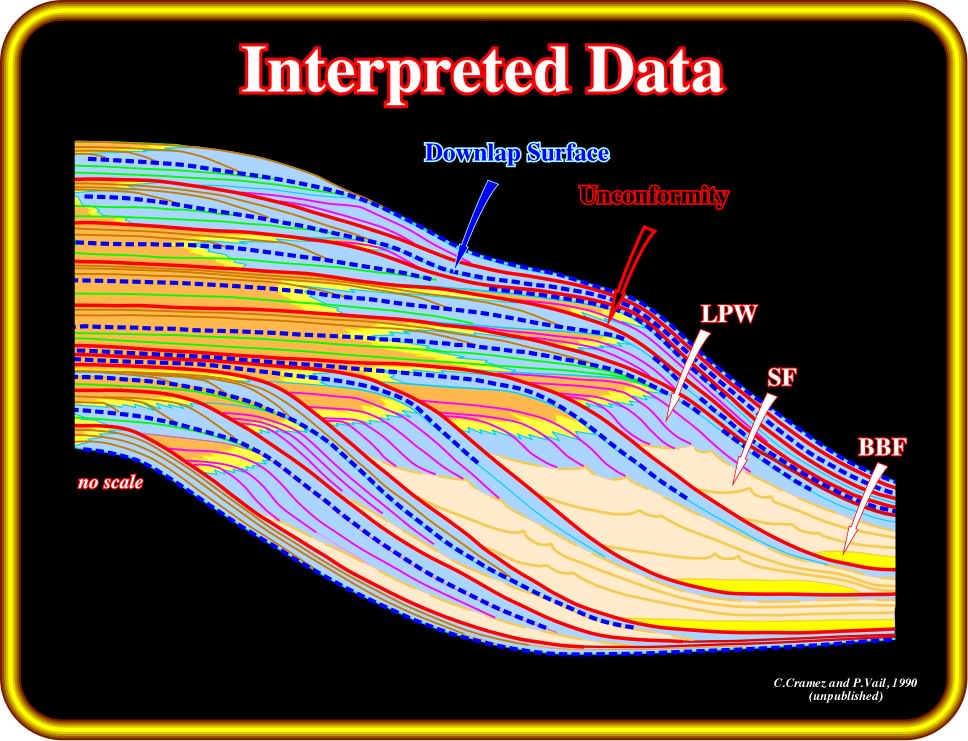
Plate 3- This sketch depicts the observed data recorded by a geoscientist trained in sequential stratigraphy and knowing the global and regional geological settings of the area where the seismic line was shot. In red, he recognized several relative sea level falls (RSLF) and the associated unconformities (sequence cycle boundaries), as well as, the highstand and lowstand depositional systems. Seaward of the successive shelf-breaks, he identified, from the bottom to top; (i) basin floor fans (BFF); (ii) Slope fans (SF) and (iii) lowstand prograding wedges (LPW). Similarly, he recognized intervals during which progradation was dominant (regressions) and those where retrogradation (transgressions, ingressions) was predominant.
Probably, you will propose a final tentative interpretation similar to that illustrate on Plate 4, in which the sedimentary driving concepts controlling:
(i) Sequential Stratigraphy ;
(ii) Eustatic Cycles ;
were taken into account in the tentative interpretation.
Plate 4- The observed data (see Plate 2 and 3) can finally be interpreted in terms of sequential stratigraphy. The interpreter took into account not only the driving concepts of sequential stratigraphy and eustasy, but also the global and regional geological settings of the area. In spite of the fact that, in this example, tectonic knowledge is not too much required, it must be pointed out that a significant knowledge in Tectonics is indispensable to perform coherent and realistic seismic interpretations, i.e., interpretations difficult to refute. Geology is holistic ; its parts, such Stratigraphy, Sedimentology, Tectonics, etc., are interlinked and interconnected.
Summing up:
You may indeed be wrong, but you strongly think geoscientists see what they know and what they have been trained to see. When making observations, particularly on seismic data, it is necessary to understand the driving concepts controlling observations. Seismic interpreters must critically test their interpretations, present them to others and listen to what they say. The same basic principles apply to tentative sequential interpretations of electric-logs and outcrops.
In hydrocarbon exploration, the game is the same. Let's see an example:
Plate 5- The hydrocarbon exploration approach change function of the sedimentary basin under investigation. We do not explore an offshore basin, as Angola or Brazil offshore in the same way that we explore an onshore basin, as the Lusitanian basin (Portugal). In an offshore basin, there is not outcrops allowing to establish the stratigraphy, tectonics and the major hydrocarbon parameters (potential source and reservoirs-rocks) by field work. This is particularly true when the offshore is not the natural continuation of an onshore basin, as it is the case in Kwanza offshore (Angola). In other words, we don't explore a divergent margin Atlantic-type (e.g., offshore Brazil) in the same way than a back-arc basin (e.g., offshore Java, Indonesia). In the first, the predominant tectonic regimes are extensional (lengthening of the sediments), while, in the second, the compressional tectonic regimes are preponderant (shortening of the sediments). In a divergent margin (Atlantic-type), the more likely potential traps are non-structural (stratigraphic, morphological or morphological by juxtaposition), while in a back-arc basin, the more frequent potential traps are structural (four way dips). Geoscientists ( someone who studies the earth, including its composition, structure and other physical aspects, as searching for natural resources like groundwater, metals and petroleum; http://careerplanning.about.com/od/occupations/p/geoscientist.htm), before searching for hydrocarbon in a given basin (hydrocarbon or petroleum exploration), must know, a priori, what class of basin it is, in Bally & Snelson's basin classification and where look for the main hydrocarbon parameters.
Plate 6- Hydrocarbon exploration problems are related to the state of knowledge of the geoscientist. In other words, if a geoscientist knows, for instance, that the area under investigation is an offshore associated with the breakup of the Pangea (supercontinent that incorporated almost all of Earth’s landmasses covering nearly one-third of Earth’s surface by the Early Permian Period and surrounded by a global ocean called Panthalassa, that began to break apart about 200 Ma, during the Early Jurassic Period, eventually forming the modern continents and the Atlantic and Indian Oceans) and particularly to the breakup of the Gondwana (a hypothetical landmass in the Southern Hemisphere that separated toward the end of the Paleozoic Era to form South America, Africa, Antarctica, and Australia), he is aware that : (i) The substratum is a basement or a Paleozoic folded belt ; (ii) Overlying the substratum there are basins rift-type (developed before the breakup of the lithosphere) and a divergent margin Atlantic-type, postdating the breakup of the lithosphere, which corresponds to the continental encroachment stratigraphic cycle post-Pangea; (iii) Potential lacustrine source-rocks (type I) are likely in the rift-type basins (when the internal configuration is more or less parallel) ; (iv) Potential marine source-rocks (Type II) are probable between the transgressive and regressive phases of the continental encroachment cycle, that is to say, in association with the major downlap surface of the cycle; (v) Potential dispersive source-rocks (type III) are plausible in the deepest part of the margin in association with turbiditic deposits; (vi) The main potential traps are stratigraphical (retrogressive sandstones), morphological (turbidites or reefs) or morphological by juxtaposition (when fault movement put the reservoirs-rocks in juxtaposition with sealing rocks) etc.
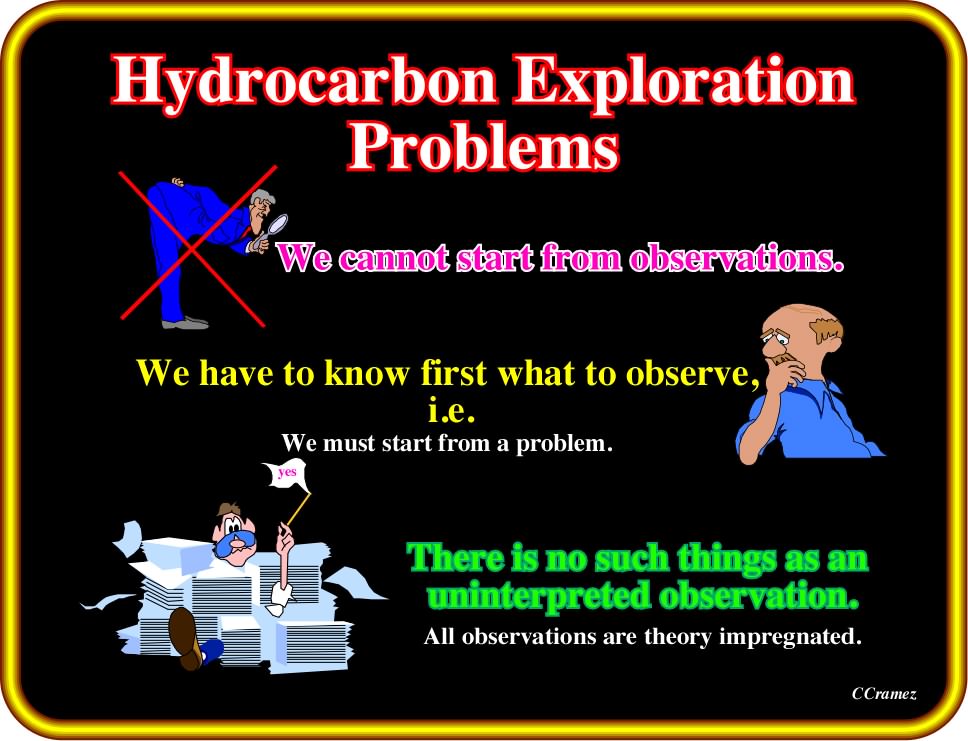
Plate 7- Geoscientists and particularly seismic interpreters cannot recognize in the field or on seismic lines deltaic progradations if they do not know what a progradation is or if they do not know what is a delta. In oil company, if the Manager Exploration ask to a geoscientist : Have you all information to evaluate the hydrocarbon potential of this basin, he is showing a total ignorance in philosophy of sciences and hydrocarbon exploration. The good question to ask to a geoscientist is another: What are your ideas to evaluate the hydrocarbon potential of this basin? By the same token, seismic lines are not shot to understand a sedimentary basin. They are or they must be shot to solve or test the hypotheses or conjectures advanced by geoscientists to puzzle out a problem. In hydrocarbon exploration, we start always with a problem. Observations (seismic, field, subsurface, etc.) are usually presented as the basis of hydrocarbon exploration. However, in reality, geoscientists think with ideas and not with observations. Observations do not create ideas. Ideas create observations. Ideas are, in fact, integrated patterns that derive from experience not from observations. A geological idea will emerge in geoscientist team just after the group knowledge evolves to the necessary minimum level of knowledge to support the cognition of that idea. In hydrocarbon exploration, as well as, in all branches of science, geoscientists do not always find what they expect to find. Their predictions do not always work out. The payoff is the understanding that the hypothesis on which the prediction was based needs to be modified.
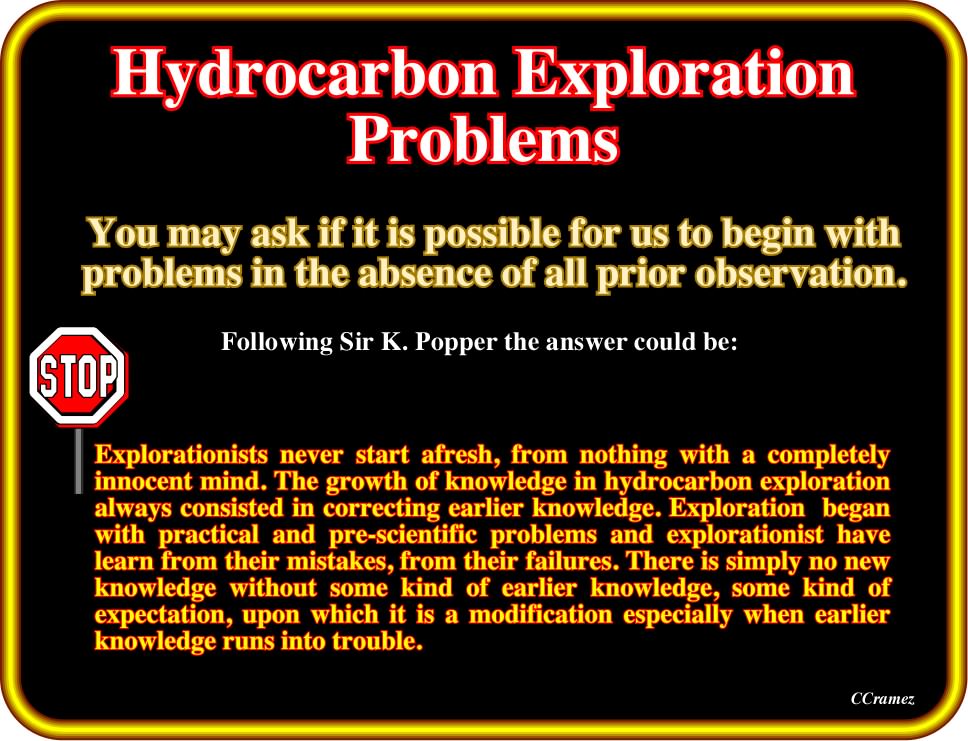
Plate 8- Geoscientists learn from their mistakes, that is to say, when a geoscientist has a problem, he advances an hypothesis to solve the problem and, then, he test the advanced hypothesis. The advents of the Systems' Theory (Bertalanffy KL, 1934), Falsification criterium (Popper, 1934 to 1959), Plate Tectonics (Vine, FJ, Matthews, D., 1963 and others) and the use of seismic reflection, in petroleum exploration, forced geoscientists to consider the study of sedimentary rocks of different basins, not only in a holistic manner, i.e., from the general (hypothesis or model) to particular (observations), but also critically. The scientific method used in classical stratigraphy (Aristotle's method adopted by Averroes (Ibn Rushd), Thomas Aquinas and Francis Bacon): (I) Hypothesis ("supposito") ; (ii) Demonstration (" compositio ") and (iii) Verification (" resolutio "), was gradually replaced by the PHT method (Problem, Hypothesis, Test) of C.S. Peirce (1931-1935). Following Peirce's method, since an explorationist has a problem (P of PHT), he advances a hypothesis (H of PHT) and, after, with observation data (field, geological maps, bibliography, seismic lines, etc.), he test (T of PHT) the a priori advanced hypothesis, i.e., he try to prove that the advanced hypothesis is false (refutation) and not, as in the previous method, confirm or verify it (verification). In modern stratigraphy and in sequence stratigraphy (particularly when perform from seismic lines), theory precedes observation (Popper, 1934) : a explorationist can just observe what he knows. If he does not know, what is a delta, for example, or a retrogradation, he may spend years in the field or watching seismic lines (observation implies the existence, a priori, of a problem, i.e., observe what?) without understanding the progradation of deltaic deposits and the retrogradation of transgressive deposits and that both are induced by a relative rise of sea level (in deceleration for deltaic deposits and acceleration for the transgressive deposits, assuming a normal terrigenous influx). Summing up, describing geological and geophysical feature by a simple and naive cataloging process or "stamp collection" never reveals the general geological mechanisms as models and simulations do (general to particular). As P. Bak said (1966) : observing details may be entertaining and fascinating, but we learn from generalities.
Plate 9- As suggested above, geoscientists learn by trial and errors, since they try to falsify the advanced hypothesis to solve a problem and not to verify the advanced hypothesis. In this sense, it is important to notice that, in English, "validation", "corroboration" and "verification" are not synonyms ( Nance et al. 1988). Verification does not exist, since its root, in latin, is "verus" (true) and in science there are not true hypothesis. An hypothesis can just be corroborated by certain data, but new data can refute it. Since new data refute an advanced hypothesis, the geoscientists gets a new problem and he needs to advance a new hypothesis that must be tested in order to see how coherent it is (the adopted hypothesis is the more difficult to refute). In the geological interpretation of the seismic lines all that means that there is not good or bad interpretations. All are tentative interpretations that must be tested. Since the results of a wildcat, for instance, refute a tentative interpretation, the geoscientist in charge of the interpretation, must propose a new tentative, which, in turn, must be tested, and so on. At this point, it is important to ask yourself two questions: (i) How many times I have interpreted twice the same set of seismic lines (if you interpreted twice the same lines, the second tentative interpretation is necessarily different because you have learned from the first one) ; (ii) When I don't see anything on the lines, it is because the quality of the lines is very poor or because I don't know what I should look for. Nowadays, the majority of the geoscientists ask immediately for a 3D survey. However don't forget that an increasing in quality and resolution of the seismic data requires an increasing knowledge of the interpreter.
Plate 10- The hypothetico-deductive hydrocarbon exploration approach cane be summarized as follows : (I) Geoscientists start from some problem ; in the majority of the case (immature basins at hydrocarbon exploration point of view), the first problem to solve is the presence or absence of mature source-rocks; (ii) Then, geoscientists proceed to formulate a tentative solution to such a problem, that is to say, a conjecture or an hypothetical solution (for instance, if the basin is associated with the breakup of the Pangea, the more likely potential source rocks will be organic rich lacustrine shales deposited in the rift-type basin predating the breakup of the lithosphere and the organic rich transgressive marine shales deposited in connection with the major downlap surface between the transgressive and regressive phases of the continental encroachment post-Pangea stratigraphic cycle) ; (iii) The advanced tentative solution is then submitted to discussion and testing; a bibliographic study of the basin, field geochemical studies and the geological tentative interpretations of old or new seismic lines are often used to falsify the advanced hypothesis; (iv) If the data (particularly the new data) refute the advanced hypothesis and new problems arise, the geoscientists restart, but with much more problems.
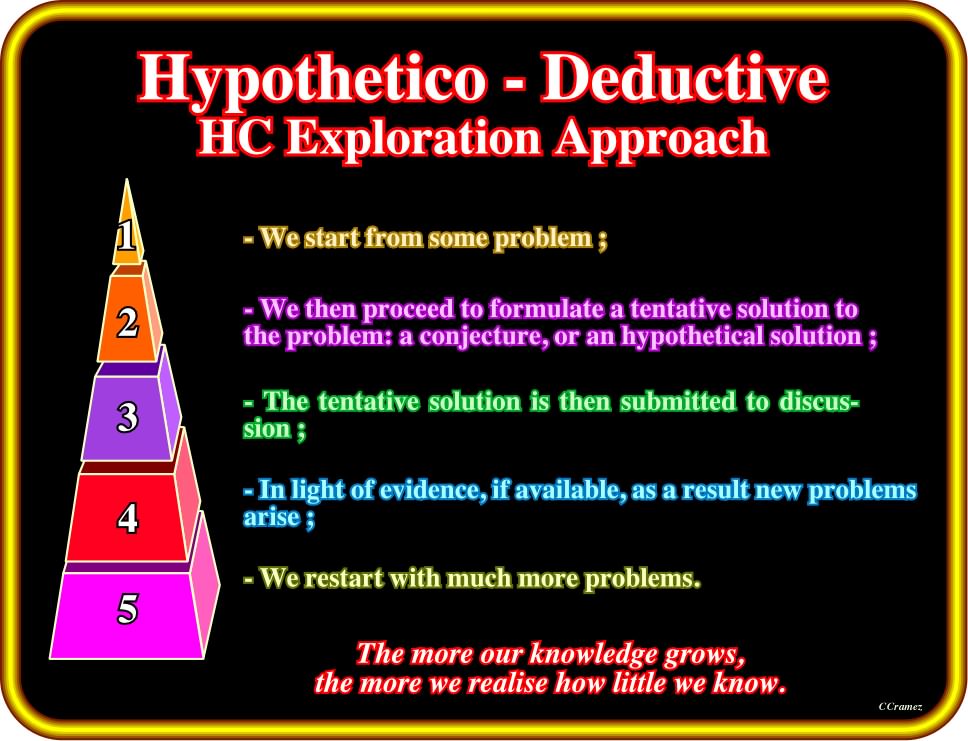
Plate 11- The most efficient method in petroleum exploration as well as in other branches of science is by trial and errors. A geoscientist that does not recognize his mistakes never progress. He spend the majority of his professional carrier rediscovering the wheel and verifying the hypothesis that he advanced based in naive inductive observations. In seismic interpretation, it is quite easy to recognize such geoscientists. You just need to look to the legend of their maps, where you will, probably, find a particular phraseology : (a) Yellow marker ; (b) Red marker ; (c) Yellow bodies ; (d) Mickey-mouse structures, etc. The major problem with these geoscientists is that they are afraid to make mistakes. For them, contrariwise to K. Popper, observation precedes theory. They make descriptive observations (without a priori model) and, then, they propose their own model to explain the observations. Arriving to this point, and contrarily to the geoscientists following an hypothetical-deductive approach, they look mainly to the data that corroborate their model (verificationism), since their mind filtrate (forget) the data refuting the model.
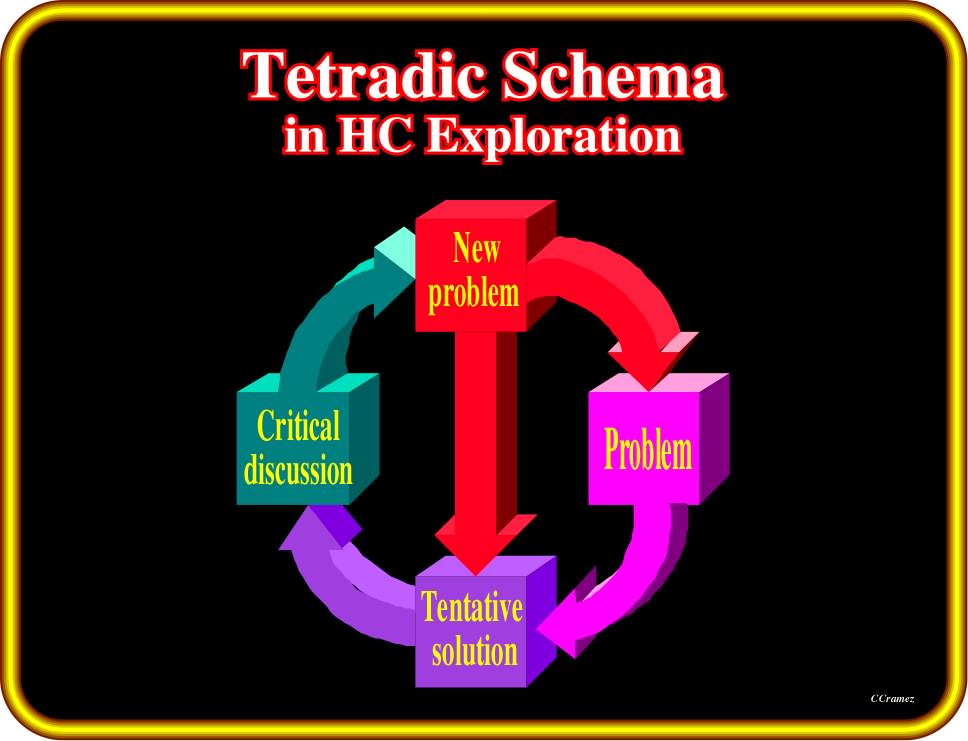
Plate 12- A tetradic schema is often used to depict the hypothetico-deductive hydrocarbon exploration approach: (i) Problem ; (ii) Tentative solution ; (iii) Critical discussion ; (iv) New problem ; (v) Tentative solution and so on. Evidently, tentative solutions must be falsifiable (empirical) and not metaphysical (not falsifiable). Typical examples of unfalsiable (metaphysical) geological hypothesis are, for instance : "In this sedimentary basin, the presence of source-rocks is possible or not" or " Reservoir rocks are present, but their petrophysical characteristics are questionable" or " In a divergent margin Atlantic-type, the burying of the sediments can be good or bad. On the other hand, when a geoscientist (inductive / verificationist) advance that "all argillaceous rocks that are source-rock are black", such hypothesis remains valid even when he observe red sandstones or white limestones, since all data that is not a counter-example confirm that "all argillaceous rocks that are the source-rock are black." Indeed, one can even easily show (extensional logic) that, all data is an example of the advanced hypothesis : 1- Everything that is a argillaceous rock that is a source-rock, is black ; 2- If something is an argillaceous rock that is a source-rock, then it is black ; 3- Everything is black, except if it is not an argillaceous rock that is source rock. Therefore, everything that is not an argillaceous rock that is a source rock and everything that is not black confirms the hypothesis. The hypothesis is just not confirmed in the case of anything that is at same time source-rock and is not black, that is to say , in the case of a counter-example. All this shows shows why the inductive method, and particularly the verificationism is rejected by the majority of scientists.
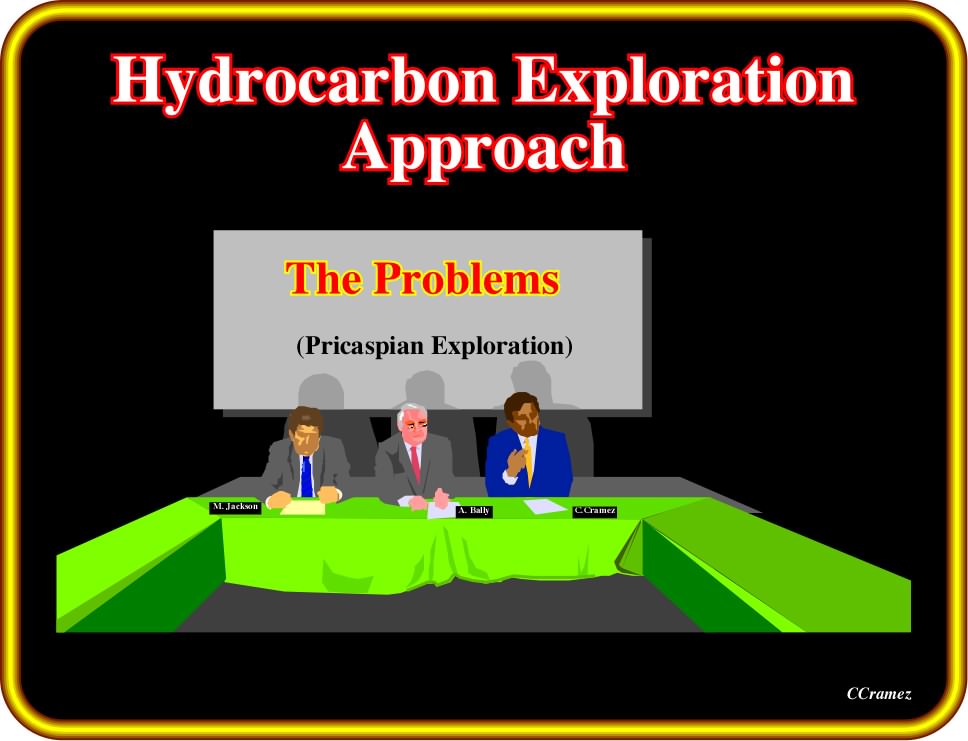
Plate 13- Very often, geoscientists must study petroleum basins that are complete unknown for them, that is to say, basins where they have never work. Obviously, even in such cases, they do not start from nothing. Actually, not only the petroleum parameters are the same for all petroleum basins but the global and regional geological context of the majority of the sedimentary basin is well known since longtime. In addition, a lot of data (geological, geophysical, etc.) is, often, available as well as a large bibliography on the basion or in analogous basins, particularly those having similar resource distributions. Let's take the Pricaspian basin, that many occidental geoscientists discovered not to long ago, as an example.
Plate 14- In a given petroleum basin, the understanding of the potential petroleum systems (genetic relationship between a source-rock and petroleum accumulations) comes from the study of the hydrocarbon parameters composing the petroleum system, that is to say : (i) Source-rock (presence and maturation) ; (ii) Reservoir (presence and petrophysical characteristics) ; (iii) Trapping (reservoir and sealing rocks) ; (iv) Time of Maturation (migration age of the hydrocarbon in relation to the age of the trapping mechanism) ; (v) Retention (holding of the hydrocarbons in the reservoir-rock). Regional geological maps, basin's stratigraphy and tectonic evolution give key informations to advance hypothesis on the presence of petroleum systems, that is to say, on the probability of a, hydrocarbon of discovery. The probability of hydrocarbon discovery is the product of the probability of presence of each hydrocarbon parameter. If the probability of one petroleum parameter is zero, the probability of an hydrocarbon discovery will be zero. In other words, if in a basin, the probability the presence the source-rocks (presence and maturation) is zero, the probability of an hydrocarbon discovery will zero. Subsequently, if in a given basin, there is a killer petroleum parameter (e.g., absence of source-rocks), the study of the others petroleum parameters is irrelevant.
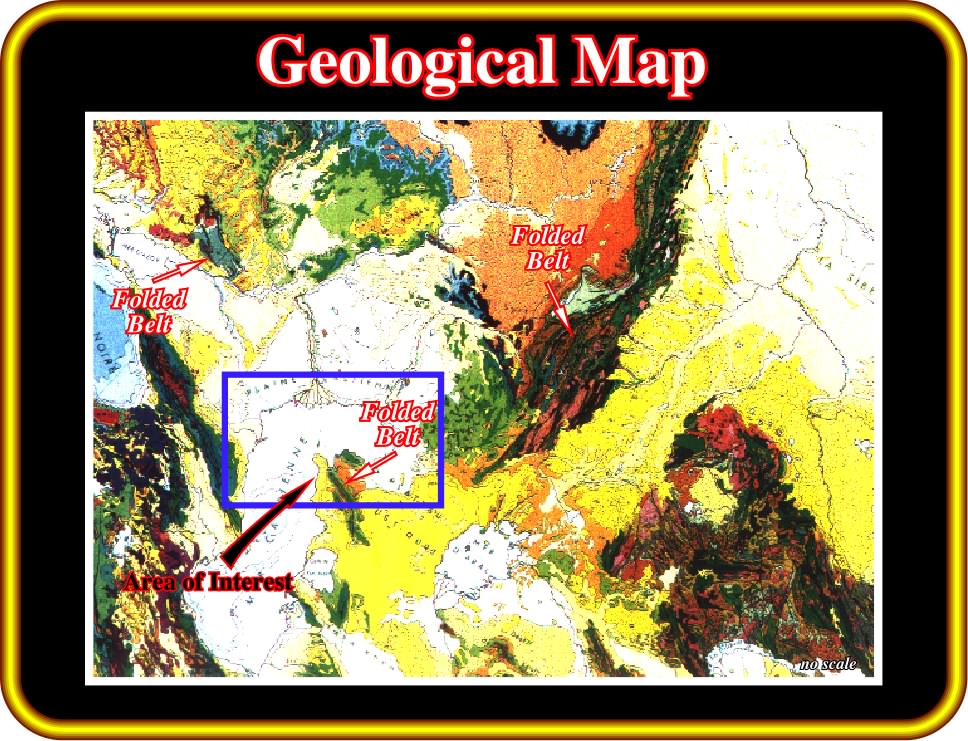
Plate 15- In this particular case, taking into account the area of interest (Pricaspian basin, in the southeast of the Russian platform, contains a sedimentary column up to 20 km thick comprising Palaeozoic subsalt formations, Permian salt and suprasalt Mesozoic and Cenozoic terrigenous formations), this regional geological map suggests extended foreland, that is tom say, extensional tectonic structures, more or less, perpendicular to folded belts. In the Bally & Snelson basin classification, the area of interest corresponds to a perisutural basin (foredeep or a depression that develops adjacent and parallel to a mountain belt), in which the substratum is composed by platforms or grabens and not by faulted blocks. Theoretically, the petroleum potential of perisutural basins, namely, the generating petroleum sub-system may be associated with the petroleum potential of the substratum (lacustrine source rocks in the grabens or half-grabens and) or associated with the sediments of the basin itself. On the other hand, one should not forget that foredeep basins are located between fold belts and adjacent cratons, in continental or marine semi-closed environments conducive to the development and preservation of source rocks. Such a regional geological context is well known in others parts of the world, as depicted below (Plate 16).
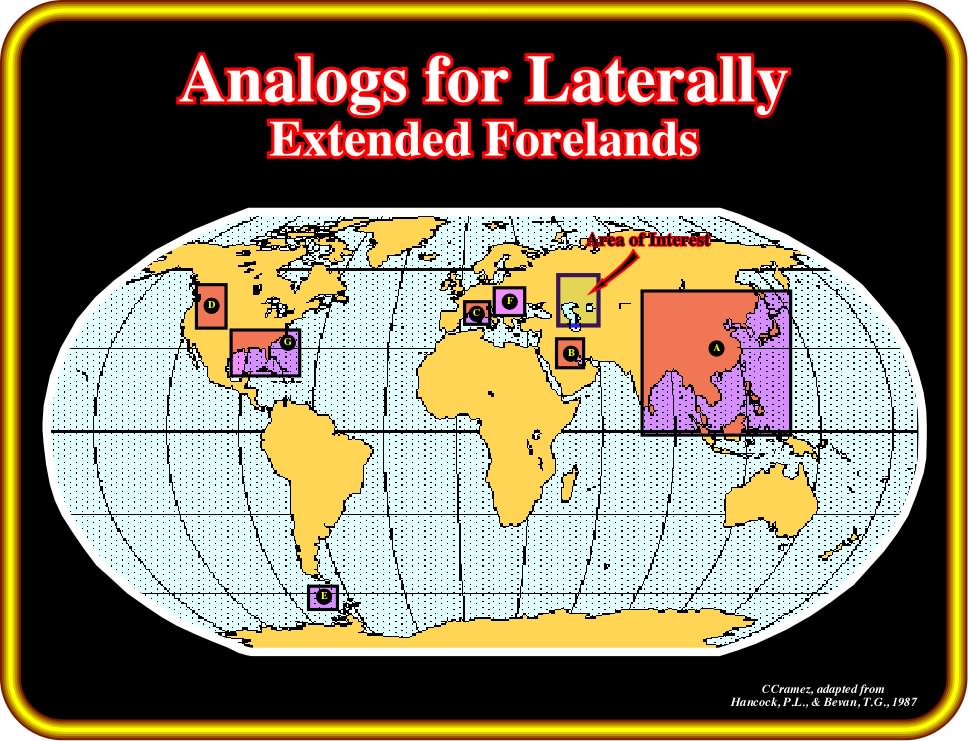
Plate 16- The tectonic setting of all these areas (A) Central Asia, (B) Arabian Platform, (C) Pyrenees, (D) Alberta, (E) Patagonia, (F) Germany, (G) Anadarko basin-Appalachian Mountains can be explained assuming a lessening of the tectonic stress (σt) in the direction of the craton. However, for certain geoscientists there is not lessening of the tectonic stress (σt) but rather a lessening of the deformation threshold of the sediments. There are several tectonic regimes and associated deformations (strain) between the orogenic foldbelt and the craton: (i) Thrust faults (a type of fault or break in the Earth's crust across which there has been relative movement) and cylindrical fold (poles to bedding plot along a common great circle in a stereographic projection) ; (ii) Strike-slip faults (geologic faults in which the blocks of rocks on either side of the fault slide horizontally, parallel to the strike of the fault) and conical folds (poles to bedding will plot along a small circle, in a stereographic projection) ; (iii) Normal faults (the hanging wall moves downward relative to the footwall) and associated grabens (depressed block of land bordered by parallel normal faults) striking perpendicularly to the thrust faults of the fold belt. The main macro-tectonic structures for each area are depicted in next plate (Plate 17).
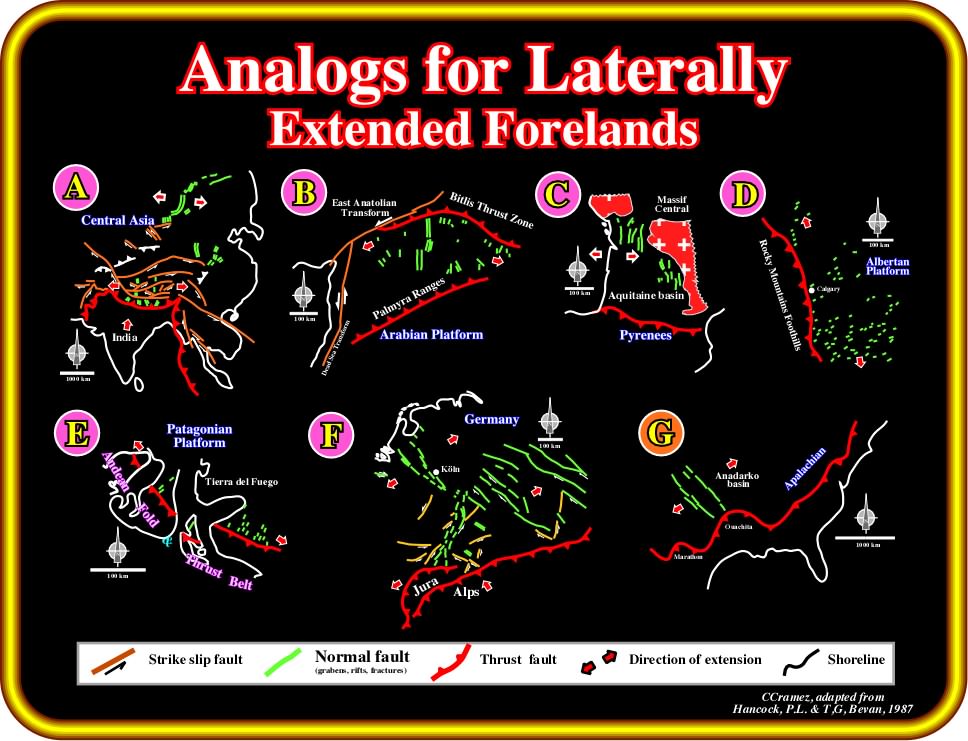
Plate 17- These macro-tectonic structures strongly suggest a lateral extension in foreland and hinterland. However, as globally the compressional tectonic regimes, characterized by a σ1 vertical (principal effective tectonic stress), are predominant, structural traps are likely in association with the shortening of the sediments induced by the reactivation of the old normal faults as reverse faults. Subsequently, in the area of interest, a priori, one can say that : (i) The more likely source rocks (lacustrine, type I) are either in the substratum or in the basin (marine type II, in association with transgressive episodes) and (ii) The more likely traps will be structural (four way dips closures). In addition, the presence of evaporites in the area of interest suggests the existence of antiform structures (extensional structures) associated with halokinese (salt tectonics without tectonic stress). However, a particular attention must be done to the migration time, since a large number of the potential traps will be associated with salt induced tectonic inversions. Geoscientists must determine if the migration time predates or postdates the tectonic inversion, since it can be a killer petroleum parameter, particularly for structural traps.
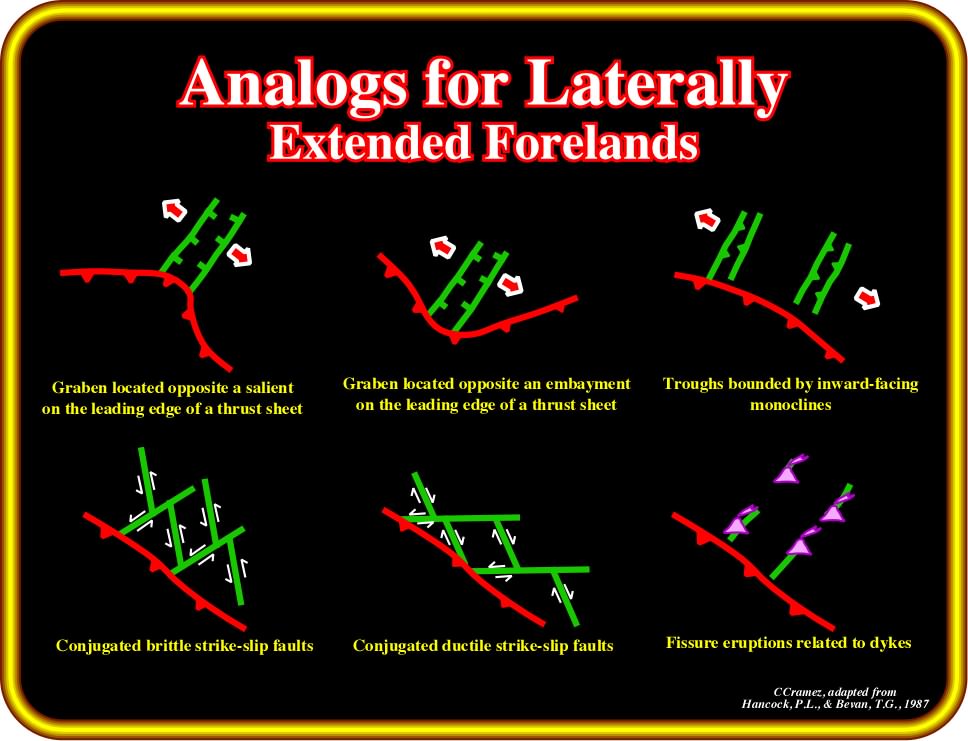
Plate 18- Hancock and Bevan summarized the macro-structures created by lateral extension in forelands and hinterlands : (i) Grabens located opposite salients on the leading edge of a thrust sheet ; (ii) Grabens located opposite embayments on the leading edge of a thrust sheet ; (iii) Troughs bounded by inward-facing monoclines ; (iv) Conjugate brittle (high angle) strike-slip faults ; (v) Conjugate ductile (low angle) strike-slip faults and (vi) Fissure eruptions related to dykes. The presence of salt (Permian) in the area of interest, not only creates morphological traps by juxtaposition (antiforms often taken, erroneously, as anticlines) by corroborate the lateral extension of the foreland. The sediments are lengthened by a lessening tectonic regime (tectonic stress > 0), in which horizontal stresses are greater than the horizontal confinement stress at equilibrium (C. Cramez & J. Letouzey, 1988-Tectonic Regimes in Sedimentary Basins).
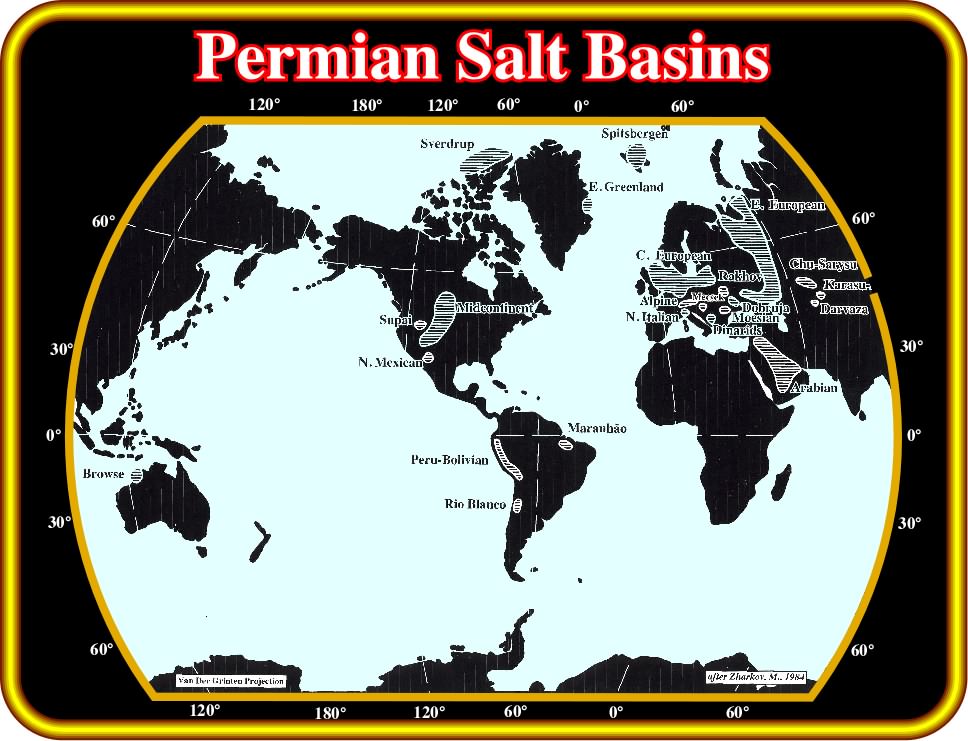
Plate 19- Permian salt basins are known all around the world : (i) East European ; (ii) Central European ; (iii) Spitzbergen ; (iv) East Greenland ; (v) Alpine ; (vi) North Italian ; (vii) Meseek ; (vii) Dionarids ; (viii) Moesian ; (ix) Rakhov ; (xi) Dobtuja ; (xii) Arabian ; (xiii) Chu Sarysu ; (xiv) Karasu Ishsay ; (xv) Darvaza ; (xvi) Browse ; (xvii) Sverdrup ; (xviii) Midcontinent ; (xix) Supai ; (xx) North Mexican ; (xxi) Peru - Bolivian ; (xxii) Maranhão and (xxiii) Rio Blanco. As illustrated in next plate, the area of interest, which is located in the southern part of East European Permian salt basin southward of Astrakhan Arch (westward of the Shchukatsk-North Caspian uplifted zone and southward of Sarpa Trough), contains one of the largest sub-salt structures of the Pricaspian basin, where perspectives for hydrocarbon generation and accumulation in the Devonian to Carboniferous deposits are considered to be quite high.
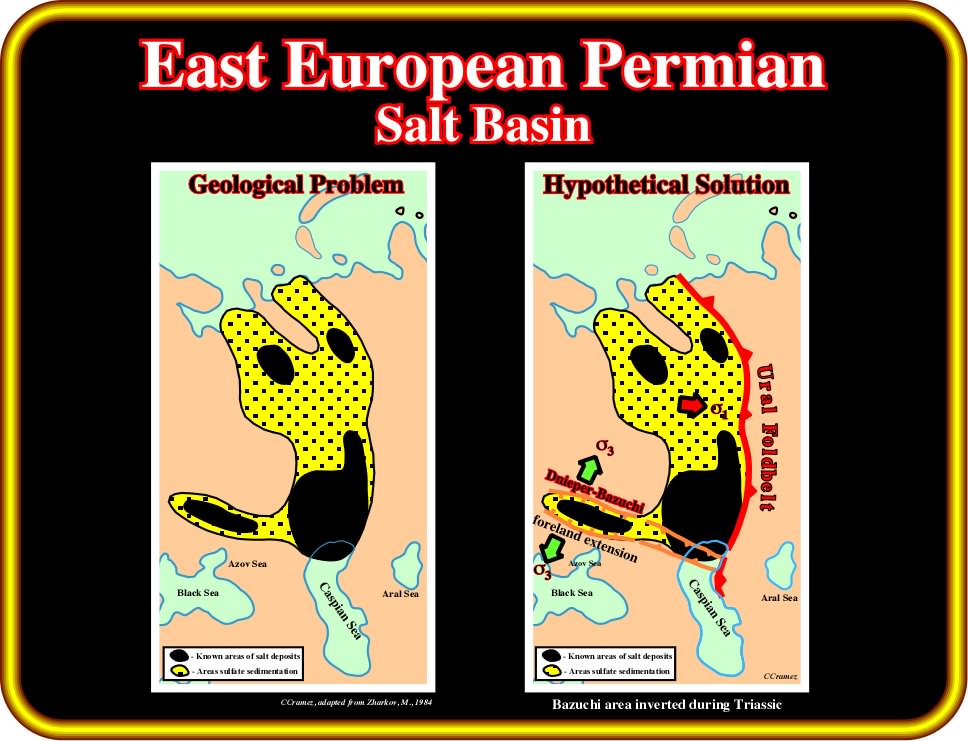
Plate 20 - Taking into account the a priori knowledge reviewed previously and the geometry of the salt deposits (in black on the figure) and the area with sulfate sedimentation (in yellow on the figure), the frontal thrust fault of the Ural foldbelt and the lateral extension of the foreland (depression that develops adjacent and parallel to a mountain belt, which due to the immense mass created by crustal thickening associated with the evolution of a mountain belt causes the lithosphere to bend, by a process known as lithospheric flexure) are easily recognized, particularly the Dnieper-Bazuchi graben trend. As, sediments are not deformed by the tectonic stress (σt), but rather by the effective stress σ1, σ2 and σ3 (axes of the ellipsoid defined by the sum of geostatic stress, pore pressure and tectonic stress), the main tectonic compression tectonic regime in this area was characterized by an ellipsoid of the effective stresses, in which σ1 was horizontal and more or less west-east, σ2 vertical and σ3 horizontal trending, more or less, N 10° East. The normal faults responsible of the Dnieper-Bazuchi extension were, later, during a new compressional tectonic regime, reactivated as reverse faults inducing an huge tectonic inversion as illustrated on the tentative interpretation of a seismic line shot in the area of interest (see next plate).
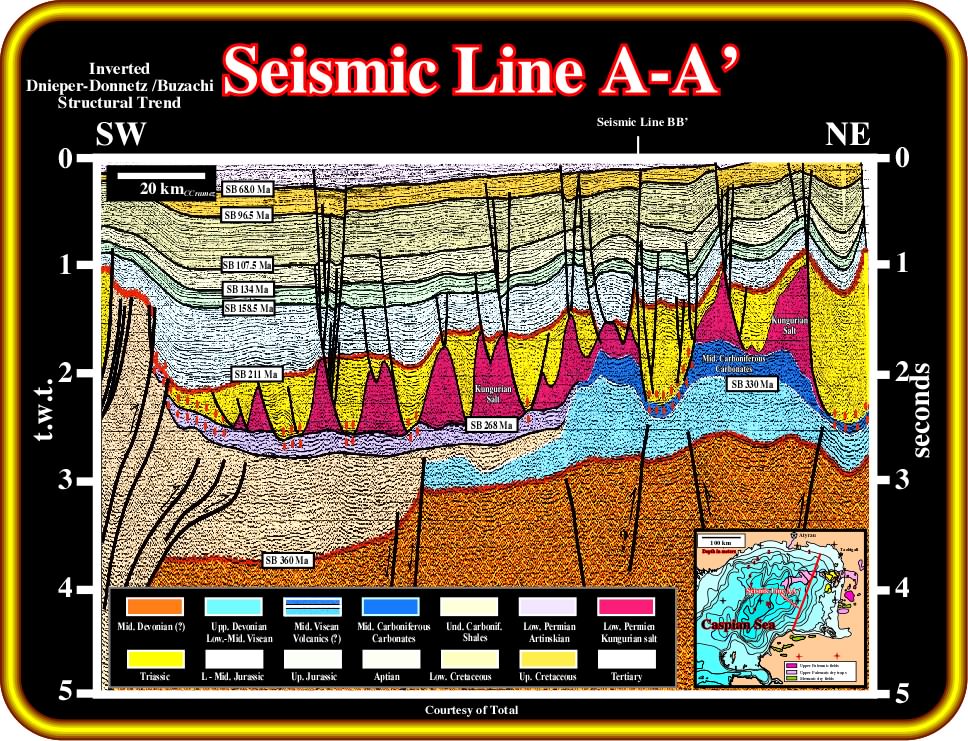
Plate 21 - On this tentative geological interpretation of an old seismic line of the north of Caspian sea (located southward of the Astrakhan arch, between the Primorsk uplift zone and Shchukatsk-North Caspian uplifted) the tectonic inversion of the lateral extension of the Dnieper-Donnetz / Buzachi (Primorsk uplift zone) is quite evident in the western part of the line. The infilling of the original extensional macrostructure took place mainly during the pre-Visean time (Mississippian). The reefal carboniferous limestones, which are the principal reservoir-rock of the area are easily recognized and picked. The Kungurian evaporites (Kungurian is the last of the four stages of the Lower Permian (Cisuralian) series, encompassing all rocks deposited during the Kungurian age between 275.6 million and 270.6 million years ago) of the Permian period and the halokinetic extensional (lengthening of the sediments) area quite obvious. Even though they are more perceptive on West-East seismic lines, as seismic line BB', which tentative interpretation is depicted on the next plate.
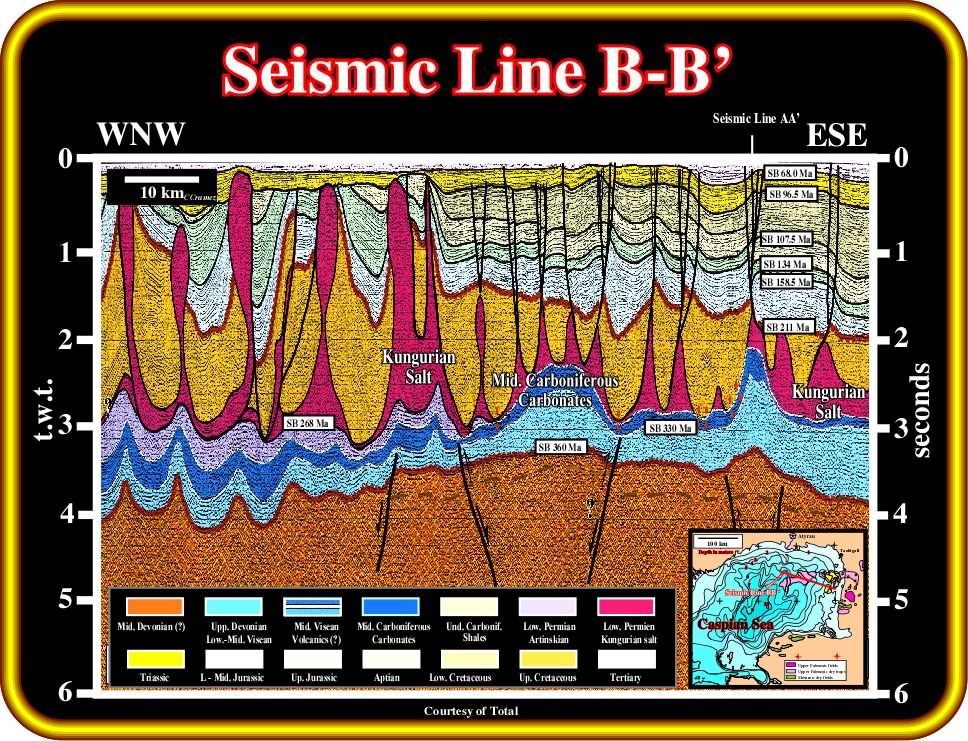
Plate 22- On this tentative interpretation of a W-E seismic line passing through Kasaghan prospect (this tentative geological interpretation is anterior to Kasaghan discovery), the Kungurian salt and the associated structure are obvious. On the other hand, this tentative interpretation strongly suggest several phase of salt tectonics. On the eastern part, the halokinesis is mainly Triassic in age, while on the western part, the Jurassic sediments are strongly deformed by diapirism. Carbonate anomalies are obvious below the salt. Similarly, salt welds (surface or zone joining strata or originally separated by autochthonous or allochthonous salt ; a weld is a negative salt structure resulting from the complete or nearly complete removal of intervening salt) are probable (at least seismically, taking into account the seismic resolution) which, locally, can create a sealing problem to potential subsalt reservoirs.
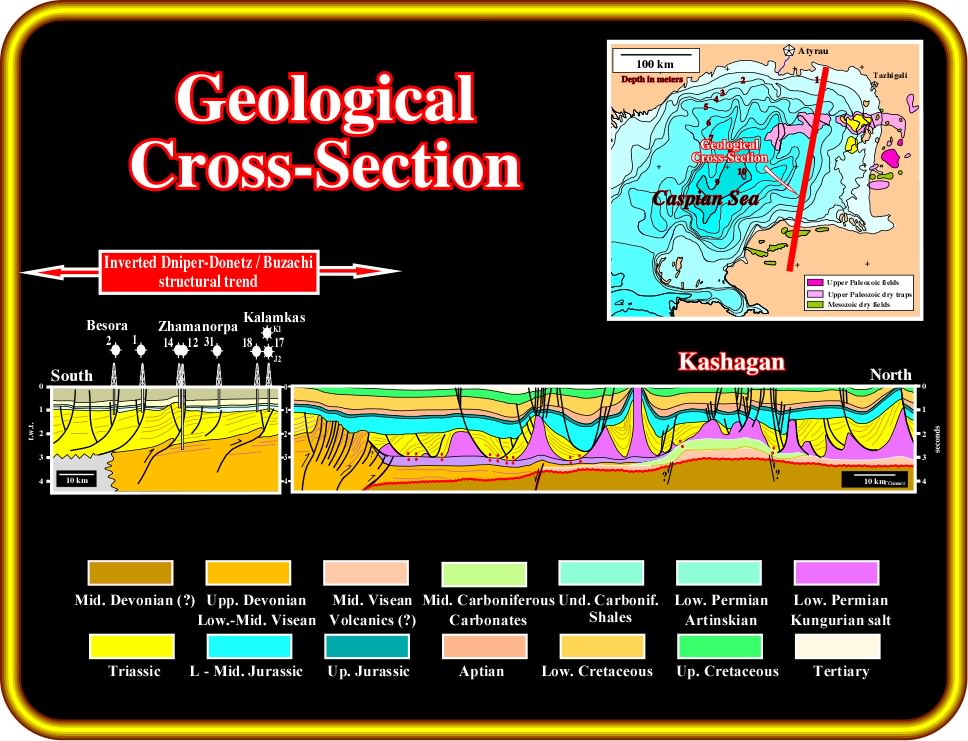
Plate 23 - Using the tentative interpretation of the seismic lines shot in northern part of the Caspian Sea, it is possible to make a time North-South geological cross-section between the Shchukatsk-North Caspian uplifted zone (north) and the Primorsk Uplift zone (south), illustrating the structural (four way dips) oil accumulations in the onshore inverted Dnieper-Donnetz /Buzachi structural trend (Primorsk Uplift zone), as Besora, Zhamanorpa Kalamkas, etc., and the potential non-structural traps in the northern part, that is to say, in the halokinetic conventional foreland. In this area, the large majority of the potential traps are either morphological (reefal build ups) below the Kungurian salt or morphological traps by juxtaposition or truncation induced by the salt tectonic. Contrariwise to the structural traps, induced by sedimentary shortening, in which the geometry of the sealing-rock is, more or less, mimetic of the geometry of the reservoir-rock, in the non-structural traps (stratigraphic, morphologic or morphological by juxtaposition), the geometry of the sealing-rock is totally different of the reservoir-rock geometry. Subsequently, the exploration approach of these potential traps (non-structural) is different.
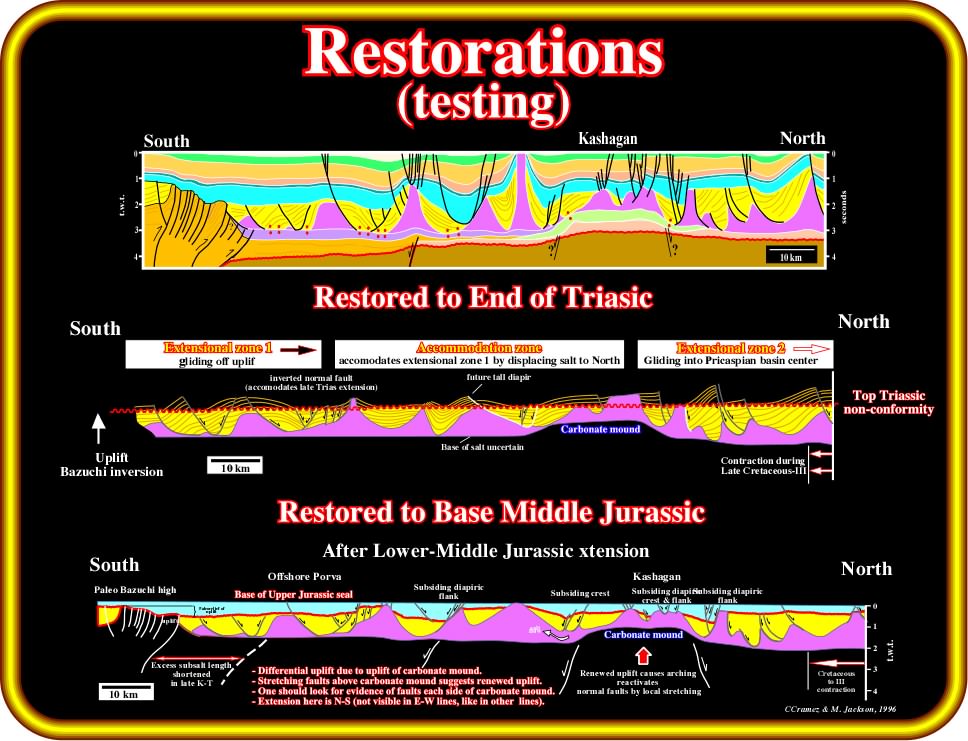
Plate 24 - Restorations of geological tentative interpretations of seismic lines, even in time, can be used to falsify or refute the interpretations and to put in evidence subtle geological events difficult to recognize directly on the lines. Here, we test the tentative interpretation of the regional seismic line AA', which we used to build the northern part of the geological cross section (conventional halokinetic foreland). The restoration to the end of Triassic is quite acceptable (it doesn't refute the proposed tentative interpretation). In addition, it indicates two extensional zones (gliding) and an accommodation zone, which accommodates the extensional zone 1 by displacing the salt northward. By the same token, the restoration to base of Middle Jurassic, after the Lower-Middle Jurassic extension, also, does not refute the tentative interpretation. In addition, it suggests : (i) Differential uplift due to uplift of carbonate mound (Kasaghan prospect) ; (ii) Stretching faults above carbonate mound (renewed uplift) ; (ii) A significant contraction from Cretaceous to Tertiary and (iv) A North-South extension not visible in W-E lines. In spite of the fact, that the tentative interpretations are not refuted, new seismic data and particularly the well results can falsify the interpretation. If this is the case, geoscientists learn something, since they get a new interpretation problem that must be tentatively solved by new interpretations, which in turn must be tested and so on.
to continue press
![]()