Controlling Parameters of Sequential Stratigraphy
Theoretically, sequential stratigraphy must solve the problems that classical stratigraphic approaches, such as lithostratigraphy, biostratigraphy, chronostratigraphy, magnetostratigraphy, etc., can not explain. It also explains what was already explained by classical approaches, particularly by transgressive-regressive facies cycles, which is one of the principal geological concepts resulting from classical stratigraphic studies.
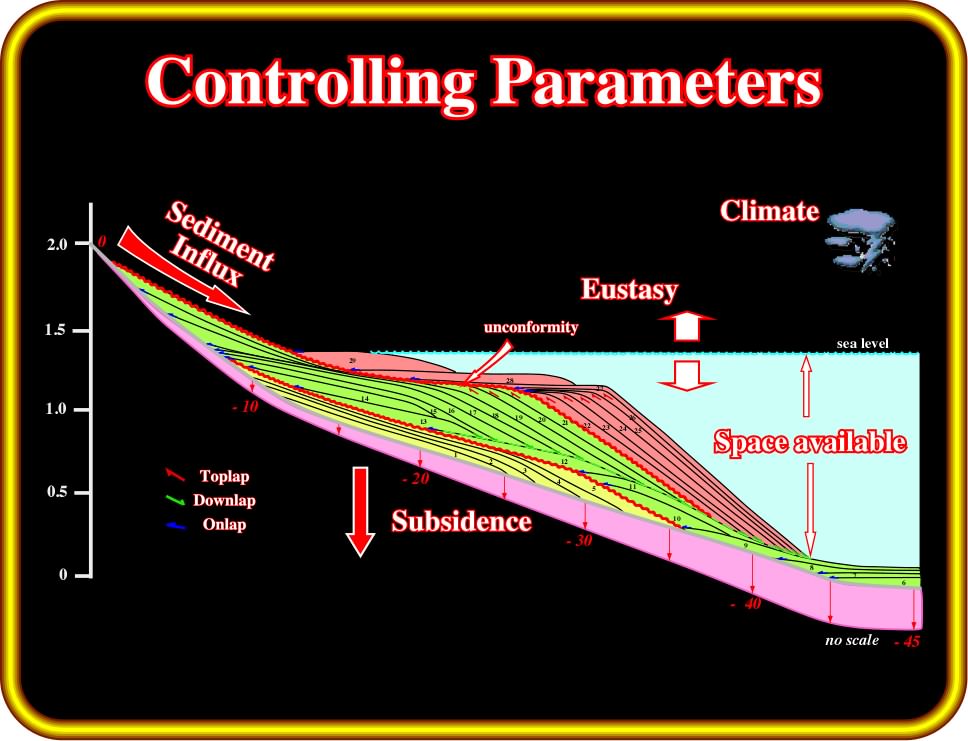
Plate 264 - The main parameters controlling depositional systems are indicated in this sketch. They are: (i) Eustasy ; (ii) Subsidence ; (iii) Sedimentary Influx and (iv) Climate. Landward of the shelf break (depositional coastal breaks are not depicted), the combination of eustasy and subsidence can increase or decrease the space available for sediments. Shelfal accommodation can be positive or negative. In the first case there is sedimentation, in the second there is erosion. Assuming that between each chronostratigraphic line (1 to 29) there is 100 ky, in this sketch three sequence stratigraphic cycles are represented. However, only the cycle composed by time lines 6-21 is complete. Notice the unconformities, the downlap surfaces, as well as, the time line terminations.
Trangressive/regressive cycles represent an assembled picture of lithofacies in relationship to the shoreline location and its position throughout geological time. Suess (1888) believed that transgression-regression displacements of the shorelines were caused by sea level changes. He used the term eustasy to coin sea level changes, which he believed were global. However, with time, the eustatic concept became unpopular as studies on different continents showed that transgression/regression facies cycles did not correlate globally and were mainly due to local uplift and subsidence.
Concerning sea level changes recorded by geologists there is always the question of what actually changed, that is to say, is it the elevation of the continent or the absolute level of the sea?
After all, wrote MacDougal (1966),
“Sediments only record relative changes, and we know that the continents undergo vertical movements. Rocks high in the Alps and the Rockies contain fossils deposited in the ocean, for example, and we know that oceans were never that deep”
Geologists have mapped the occurrence of various sediment types almost everywhere on earth in considerable detail. Through synthesis of such data there is now a fairly good understanding of the magnitude and timing of global sea level changes.
If the rock record indicates there have been large changes in sea level, the obvious question is: Why? As far as we know there are really only two possibilities:
A) There must have been changes in either the volume of water in the oceans itself.
B) In the volume of other things that displace the water, such as continents, islands or ocean ridges.
We know that glacial periods are characterized by sea level lowering. Large amounts of the earth‘s surface water are tied up in ice sheets on the continents. It is estimated that at the height of the last glacial advance, roughly 20000 years ago, sea level was well over 100 meters lower than it is today. Although much of that ice is gone, there is still a considerable amount of water frozen in the ice caps.
If all of it were to melt, sea level would rise by about another 65 meters. That may not sound like much, but a large fraction of the earth’s population lives close to sea level, Mexico City would be spared, but much of Los Angeles, New York, Tokyo, and Berlin (to cite just a few examples) would be inundated.
Glacial episodes have a major effect on sea level. Most fluctuations that are recorded in Phanerozoic rocks don't occur at times in which there is independent evidence for global ice ages. Most likely they were caused by variations in the volume of the oceanic ridges.
In order to achieve global or regional correlations, sequential stratigraphy uses physical criteria to define chronostratigraphic intervals and biostratigraphy to determine their age. These intervals are considered genetic, in the sense that the rocks inside them are related by facies and bounded by physical surfaces that are, in part, discontinuities. In addition, they are believed to be regional. Some of them can even be global. They can be generally mapped within a basin, and sometimes in any basin around the world with a marine base level.
Complex interactions between:
(i) Eustasy ;
(ii) Tectonic ;
(iii) Sediment supply ;
(iv) Climate ;
which control the sequential stratigraphic patterns, are recognized in the rock record.
Tectonic and Eustatic effects cause relative changes of sea level, which control the space available for sediments (accommodation). Sediment supply controls how much of the accommodation space, created by relative changes of the sea level, is filled. Tectonics and Climate control the amount and type of sediments.
Each of these parameters has a stratigraphic signature and a certain rate of change, which can be recognized in rock records. P. Vail (1977) assumed that:
“Eustatic changes have a higher rate of change than the other parameters and control the stratal patterns”
The majority of geologists agree that long-term eustatic changes are driven by changes in ocean-basin volume and that these changes are induced by mechanisms of basement movement that act over time periods of tens to hundreds of millions of years and are continental in scope. However, the causes of short-term sea level changes are still very controversial.
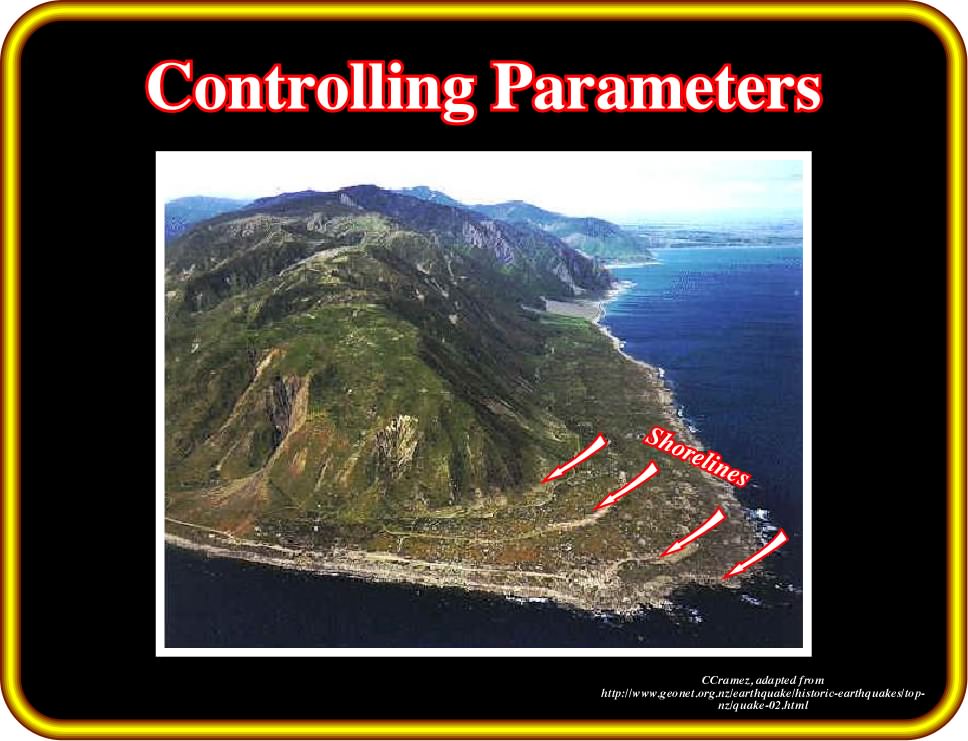
Plate 265- The landward topographic changes recognized on this photo underline successive seaward displacements of the shoreline. Such displacements were induced by successive relative sea level falls probably induced by glacio-eustasy. Similar shoreline displacements are, also, recognized in Norway onshore, where, most likely, the relative sea level falls seem to be mainly created by the uplift of Scandinavia, in order to reach a post degalciation isostatic equilibrium, rather than by glacio-eustasy.
Three major factors determine eustatic ocean level changes:
(i) Climate changing the ocean water volume ;
(ii) Earth movements changing the ocean basin volume ;
(iii) Gravitational changes of the ocean level distribution.
Ocean basin volume changes, controlled by earth movements and ocean water volume changes mainly induced by glacio-eustasy (climate), determine the ocean level:
A) The ocean level is not equally distributed but rough and uneven, due to gravity. It forms the equipotential surface of the geoid or the geodetic sea level.
B) The vertical ocean level changes may be caused both by real ocean changes, i.e. true eustasy and by geodetic sea level changes (geoidal eustasy).
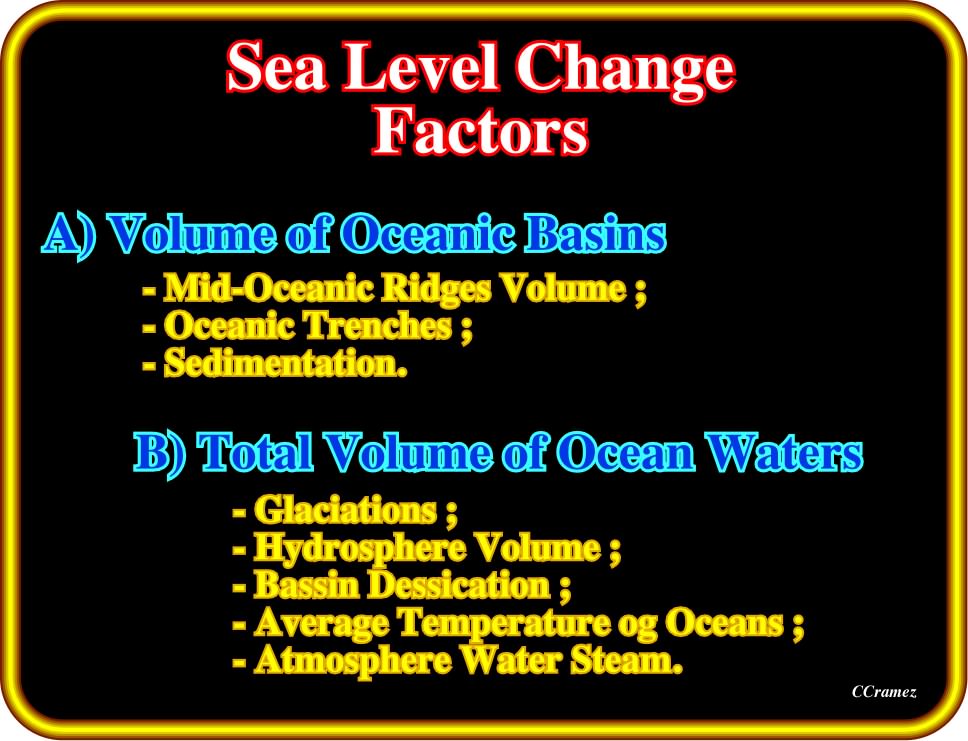
Plate 266- The three ocean variables are: (i) ocean basin volume, which is a function of vertical and horizontal earth movements (silting up plays a minor role) ; (ii) ocean water volume, mainly determined by climate and the glacial volume (juvenile water, water in sediments, water in clouds and lake volumes play a minor role) and (iii) ocean level, that is to say, the geological eustatic level, assumed to be parallel to the Earth‘s ellipsoid, changed to rough and uneven geodetic sea level, or equipotential surface of the geoid, due to gravity irregularities.
Eustasy can be illustrated by the variations of the level of wine in a cup. The size of the cup simulates the ocean basin volume (Plate 267), which can be changed by compressing and expanding the cup (earth movements simulation) causing the rise and fall. The rise and fall of the wine's surface simulates tectono-eustasy. The wine volume in the cup can be changed by drinking and refilling (climate) giving rise to corresponding rises and falls in the wine level (glacio-eustasy).
Dilatation depending on temperature (which is sometimes advocated) plays no significant role. Earth‘s movements and climate determine the level of the water in the oceans, that is to say, the eustatic sea level. In the cup, the wine table is not flat but a rough and uneven one (geodetic sea level). In other words, any change in the gravity gives rise to redistribution in irregularities in the water surface. This metaphor will be better understood after reviewing the concepts of geoid and eustasy.
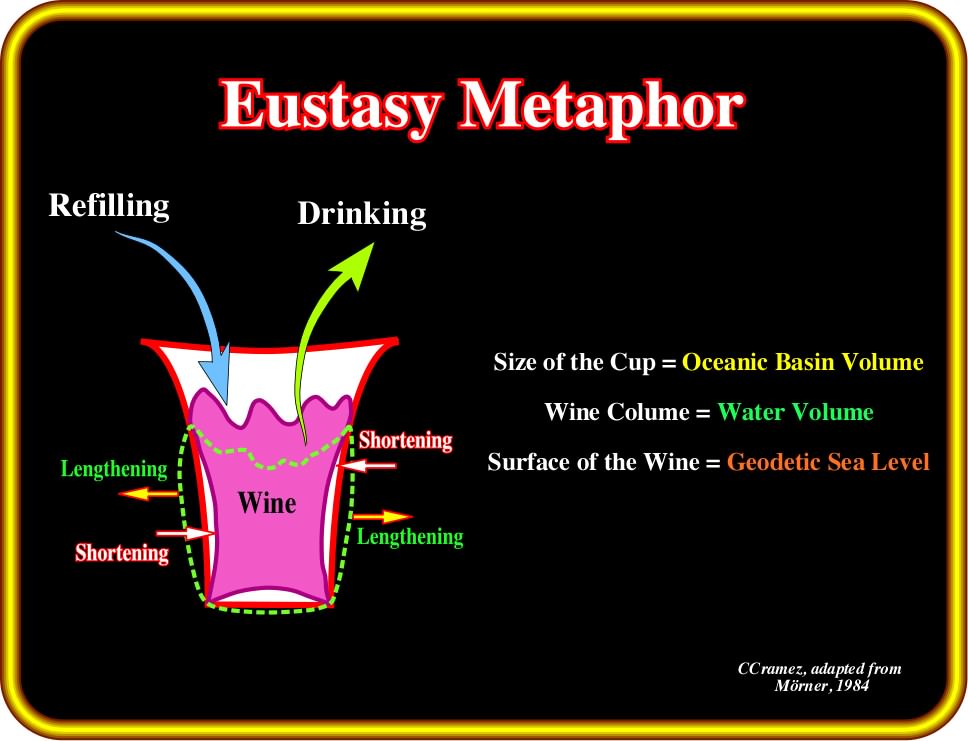
Plate 267 - The ocean basin can be considered as a rubber cup of wine : (i) when you refill it, the wine-level rises ; (ii) when drink it, the wine-level falls ; (iii) when you stretch the cup (shortening), the wine-level rises ; (iv) if the cup is extended (lengthening), the wine-level falls. In addition, taking a close look at the surface of the wine, it is obvious that it is not flat, but undulated with highs and lows.
The geoid is the equipotential surface of the Earth‘s gravity field, which is determined by attraction and rotation potentials. The ocean geoid is often termed geodetic sea level. The sea level profiles of the Smithsonian Standard Earth III geoid map are illustrated in Plate 268.
With respect to the Earth’s center, one can note that there is a 180 meter sea level difference between the geoid hump at New Guinea and the geoid depression at Maldives Islands. In addition, the present geoid configuration is, of course, not stable. It must have changed with changes in gravity and the factors controlling it. In other words, through geological time, the location of humps and depressions of sea level have changed continuously. This feature must be taken into account when proposing global stratigraphic correlations. In fact, the geoid map clearly emphasizes that two areas, not too far apart, can have, at same time, different geological conditions (highstand and lowstand).
As said previously, the best definition of eustasy is simply ocean level changes instead of crustal tectonic and isostatic movements. However, eustasy was also defined as “worldwide simultaneous changes in sea level”, as distinguished from local sea level changes.
According to Mörner (1976) the geoid changes must be included under the general term eustasy for the following reasons:
1) They have a direct effect on ocean level changes and most sea level records are faced with the problem of separating the ocean eustatic factor from the crustal factor ;
2) They affect the ocean level globally (though by different signs) and distinguish from local effects ;
3) It will be very hard, almost impossible, to distinguish them from glacial-eustatic and tectonic eustatic changes and will therefore, at any rate, and in the majority of papers, be included in term eustatic changes.
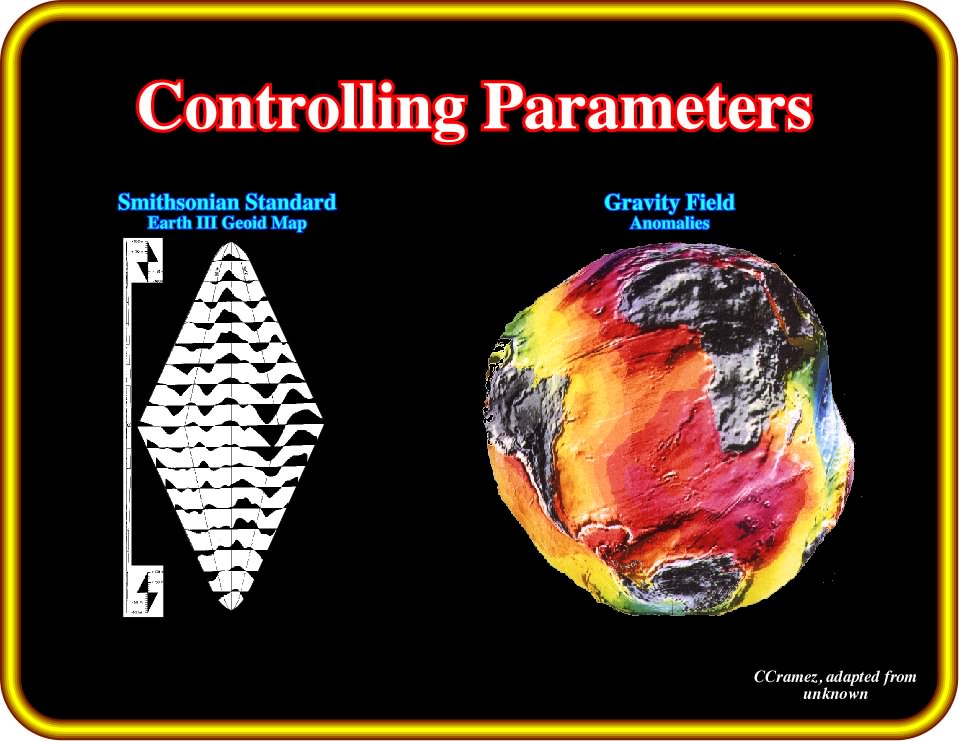
Plate 268- Sea level profiles show strong irregularities. Sea level is not flat. Large humps and depressions, related to gravity irregularities and the factors that control them, are quite evident. Between the highest area, near New Guinea, and the lowest, near Maldives, there is a difference of around 180 meters. So, eustatic sea level changes must take into account local sea level variation induced by gravity anomalies. On the Earth’s morphology, illustrated on the right, the amplitude of the undulations is exaggerated by a factor 100000 to the Earth ‘s radius.
Five orders of eustatic cycles have been identified in the geological record (Plate 269). They have been designated as 1st to 5th order cycles. The 1st order eustatic cycle corresponds to continental flooding cycles defined on the basis of major times of encroachment (landward extension) and restriction of sediments onto the cratons (Plate 270). They are associated with the break-up of supercontinents (Plate 272). They are recognized on all continents and are believed to be global. Their time duration is greater than 50 My, which P. Vail takes as the minimum duration for a 1st order cycle :
- Since the Phanerozoic two eustatic cycles of 1st order have been recognized in the rock record (Plate 290) ;
- P. Vail (1977) considered that the youngest Phanerozoic 1st order eustatic cycle started at the base of the Triassic and extended to Present (more than 200 My) ;
- The older cycle started in the uppermost Proterozoic and extended to the end of Permian (more than 300 My).
Eustatic cycles of 2nd to 4th order are believed to be caused by smaller magnitude, but higher frequency, and more rapid rates of eustatic change. They cause high frequency variations on the relative change of sea level curve (eustasy plus tectonics). In spite of the fact that time duration of these cycles has changed since the birth of sequential stratigraphy, the majority of geologists assume the following time durations:
1) More than 50 My for 1st order eustatic cycles ;
2) Between 3-5 and 50 My for 2nd order eustatic cycles ;
3) Between 0.5 and 3-5 My for 3rd order eustatic cycles ;
4) Between 0.1 to 0.5 My for 4th and 5th order eustatic cycles.
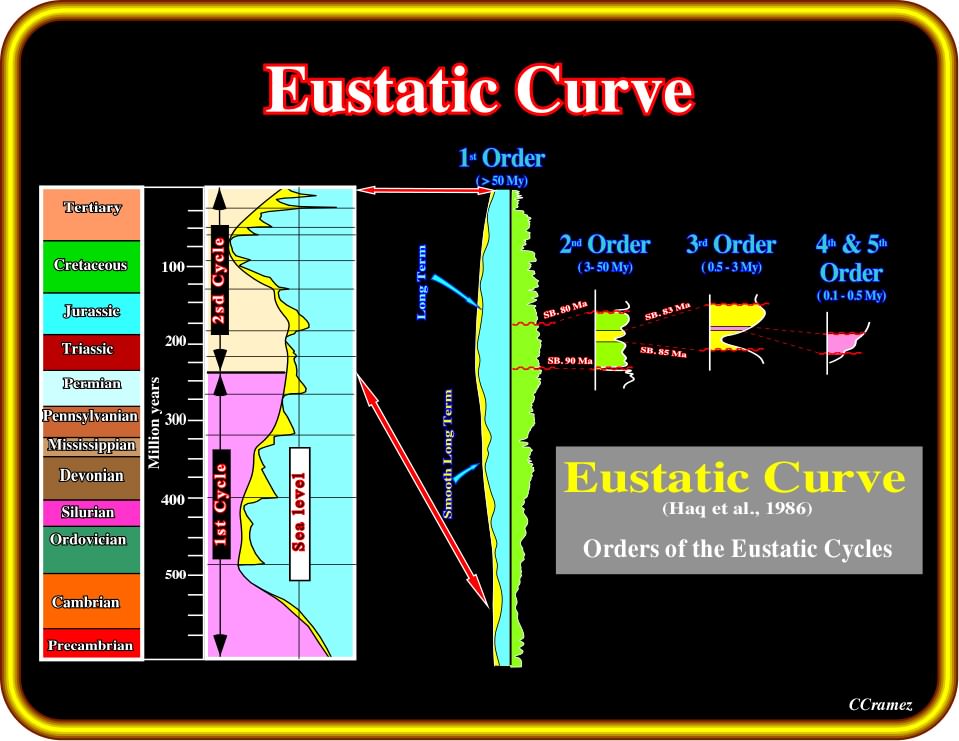
Plate 269 - Five orders of eustatic cycles can be recognized in Exxon’s eustatic curve. Since the Phanerozoic, there are two 1st order eustatic cycles. The first one highlights the Paleozoic and the second one the Cenozoic-Mesozoic. The time duration of these cycles is as follows : 1st order > 50 My ; 2nd order between 3-5 and 50 My ; 3rd order, between 0.5 and 3-5 My ;4th and 5th order between 0.1 and 0.5 My.
The classification of eustatic cycles in five orders clearly illustrated that P. Vail and coauthors considered eustasy as a multi-leveled complex geological structure, in which each eustatic cycle forms a whole with respect to its parts, while, at same time, it is a part of a larger whole.
Systems thinking paradigm recognizes the existence of levels of complexity in eustasy with different kinds of laws operating at each level. At each level of complexity, that is to say at each eustatic cycle, the associated observed phenomena exhibit properties that do not exist at the lower levels. In other words, the stratigraphic cycle deposited in association with each eustatic cycle has specific properties. Thus, during 3rd order eustatic cycles, stratigraphic cycles dubbed sequence cycles are deposited. They are often considered as the fundamental building blocks of the stratigraphy. The term building blocks suggests a Cartesian approach, which I do not think, was the Exxon‘s approach. Indeed, stratigraphy, as a whole, is more than the mere sum of its parts or building blocks.
The 1st order eustatic curve, illustrated on Plate 290, is bimodal:
- It shows high sea level during two geological intervals:
(i) Cambro-Ordovician ;
(ii) Late Cretaceous ;
- These periods are recognized as thallassocratic (craton of an oceanic block) ;
- They contrast with the widespread epeirocratic (craton of a continental block) emergencies in the latest Precambrian, Permo-Triassic, and Oligocene-Neogene times ;
- Each order of eustatic cycles seems to have a particular cause. The most likely cause of 1st order eustatic cycles is the tectono-eustasy, that is to say, change in ocean basin volume (believed to be related with the length of spreading ridges).
Oceanic ridges are thermal bulges that displace seawater. The landward migration of a ridge increases the volume of the ocean basin and so induces a drop in sea level. This argument is readily expanded. The number of lithospheric plates varies in time, and the total length of the ridges increases with the number of plates. It seems likely that the number of plates and the length of the ridge system are maximal during times of continental dispersal and minimal during times of aggregation.
As illustrated on Plate 270, rapid spreading rates cause broad and high mid-ocean ridges. Contrariwise, slow rates cause narrow and lower mid-ocean ridges.
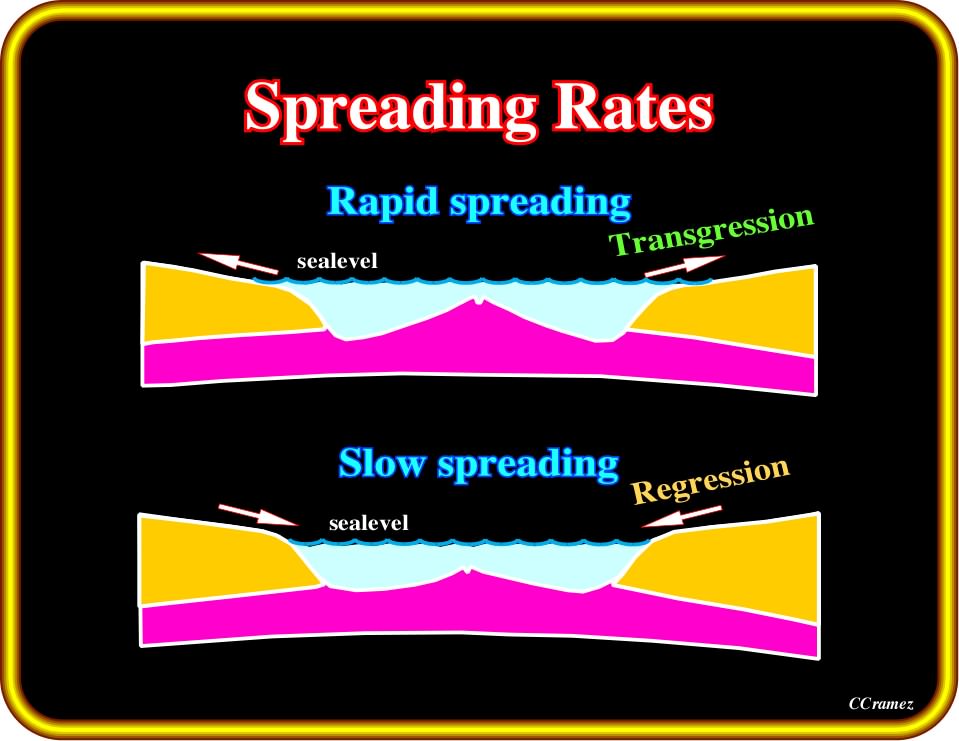
Plate 270 - Assuming, since Earth’s formation, the total water volume is constant, a fast oceanic expansion induces a large volume of oceanic ridges, and so, sea level rises with the sea encroaching the continents. Contrariwise, a slow spreading induces a regression of the sea, that is to say, shorelines are displaced seaward. During the Phanerozoic, the amplitude of sea level changes seems to be roughly 300 meters and the rate of oceanic expansion around 1 cm per 1000 years, roughly speaking, the rate of nails’ growth.
During times of rapid sea floor spreading, the ocean basins are relatively shallow and sea level rises onto continents (transgression, i.e., ingressions of the sea). During times of slow sea floor spreading the ocean basins are deeper. The seas retreat from the continents, and are restricted to the ocean basins and areas of rapid tectonic subsidence (regression).
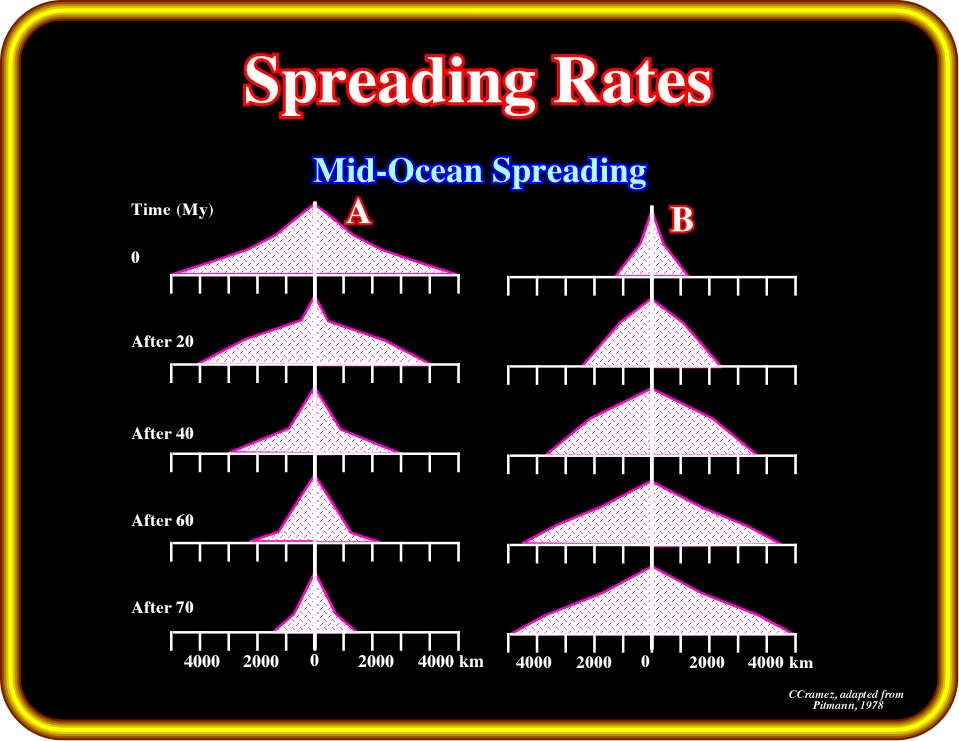
Plate 271- This sketch illustrates the profiles of fast and slow spreading mid-ocean ridges, through 70 My of spreading. In A, a ridge that had been spreading at 6 cm/y, after 70 My, has one-third of its original volume. In B, a ridge that had been spreading at 2 cm/y and changes to 6 cm/y increases the volume of the ridge.
Pitman (1978) calculated the profiles of a fast and a slow spreading mid-ocean ridge, through 70 My of spreading emphasizing the changes in the rate of sea floor spreading on eustasy (Plate 271) :
- In A, the mid-oceani ridge spreads at 6 cm/y, After 70 My, it has one-third of its original volume and epeiric seas return to the ocean basins (regression) ;
- In B, the mid-oceani ridge spreading at 2 cm/y changes to 6 cm/y. Such a change increases the volume of the ridge, which displaces water that causes a sea level rise (transgression).Geoscientists have assumed that spreading rates could change sufficiently to move sea level by few hundreds of meters. Cretaceous spreading rates are still imprecisely known, and those of the earlier times are probably lost beyond recall. Relative roles might be played by changes in the ridge length versus changes in spreading rate. It seems clear that plate activity must have a strong influence on long-term eustasy.
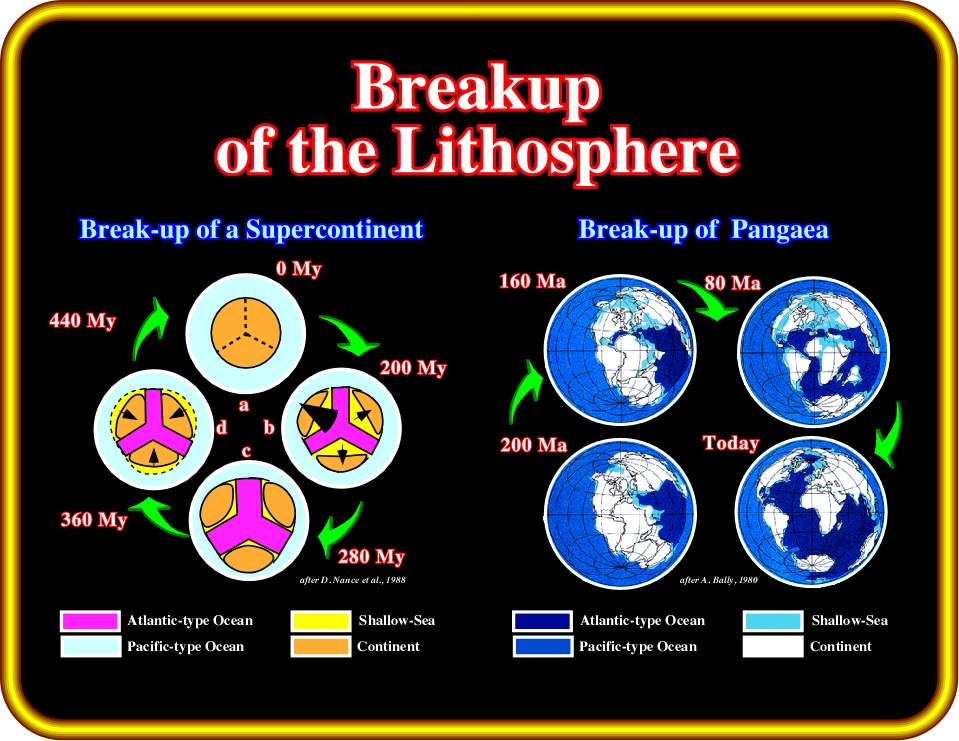
Plate 272- The majority of the margins limiting a supercontinent are Pacific-type (convergent margins). The breakup of a supercontinent induces the creation of new ocean and continental divergent margins (Atlantic-type). After the maximum dispersion of the continents, i.e., when oceans reach their maximal size, they become, progressively, smaller and smaller to finally close. Divergent margins collide against oceanic crust (subduction B-type) or other margins (subduction A-type), closing the oceans and forming a new supercontinent. Such a tectonic evolution creates changes in the volume of the oceanic basins which controls 1st order eustatic cycles and so the lowest hierarchic stratigraphic cycles, as illustrated on Plate 273 and 274.
As shown by Pitman, volume effects are too gradual to be the principal cause of eustatic changes of 2nd or 3rd order. They are adequate only to explain the 1st order eustatic cycles, particularly if the role of continental thickness changes, which can be regarded as an indirect response to plate activity, is the driving factor.
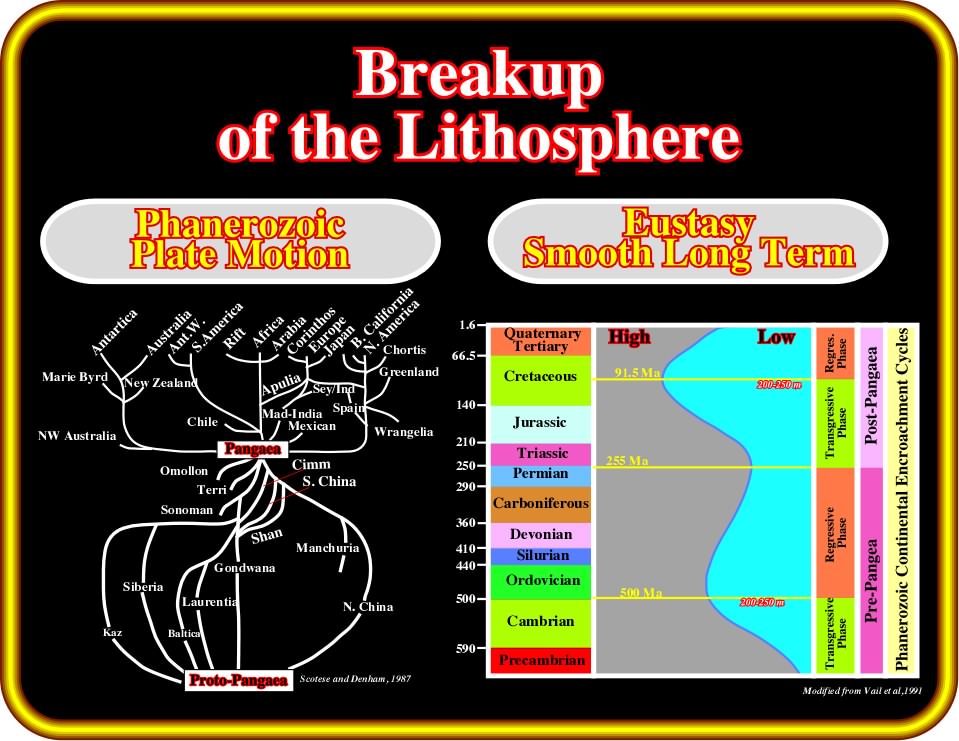
Plate 273 - As depicted, the Phanerozoic 1st order eustatic cycles are clearly related with the plate tectonic activity. Indeed, the Paleozoic eustatic high, with a sea level probably 200-250 meters higher than today, took place around 500 Ma, when the dispersion of Paleozoic continents was maximal. Similarly, around 91.5 Ma, the Meso-Cenozoic eustatic high corresponds to the maximal dispersion of the post-Pangea continents. Contrariwise, sea level was low during the Pangea and Proto-Pangea supercontinents. Admittedly, such sea level variations were induced by volume variations of the oceanic basins created by the volume changes of the oceanic ridges.
Other factors contributing to changes in ocean basin volume are:
(i) Continental collisions ;
(ii) Subduction trenches ;
(iii) Submarine volcanism ;
(iv) Sediment fill.
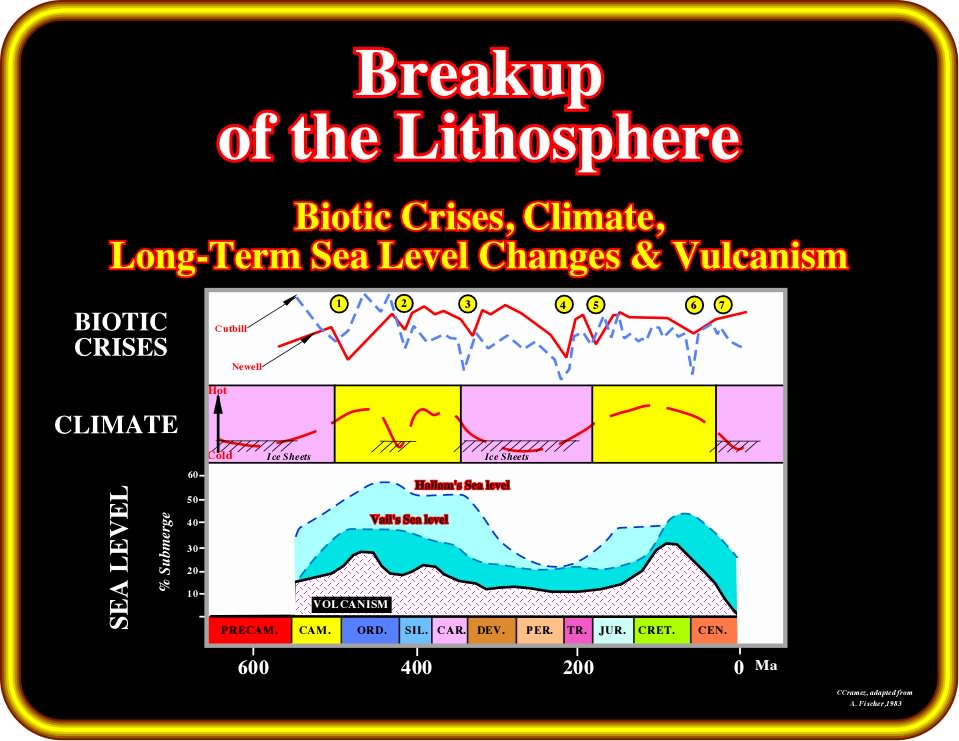
Plate 274 - The relationships between long-term sea level changes, climate, volcanism and biotic crises have been quite well established by Fischer (1983), as depicted above. Again, this plate clearly illustrates that Stratigraphy is systemic, that is to say, it cannot be studied in isolation. It is interconnected and interrelated with all Earth and cosmic events. Indeed, it is quite interesting to note that when sea level is high, climate is relatively hot and biotic crises reduces what, later are going to help us to predict the more likely marine source-rocks.
The combination of all these variables is estimated to cause a maximum rate of tectono-eustasy around 1.2 to 1.5 cm/ky. The 2nd to 5th order eustatic cycles are believed to be caused by smaller magnitude, but higher frequency, and more rapid rates of eustatic change. Such eustatic variations would cause high frequency variations on the relative sea level curve. Second order eustatic cycles consist of sets of 3rd order cycles. According to Vail, a set of 5-7 third order cycles form a 2nd order cycle with a time duration averaging 5-10 My. As we will see later, the boundaries of 2nd order eustatic cycles are characterized by particularly large eustatic falls.
to continue press![]()
![]()