C. 2) Unmigrated versus Migrated Profiles (cont.)
Geological knowledge is absolutely necessary to perform good seismic interpretations, particularly in complex tectonic areas. However, several years ago, seismic interpretation was the realm of geophysicists trained in seismic processing (often with poor geological knowledge). When I was a young geoscientist, just very few geologists were allowed to use seismic lines. I can never forget, when I asked authorization to attend an internal Exxon short course with P. Vail as instructor. My boss was extremely surprised. For him (a geophysicist), a geologist attending such a course, was a loss of time. Fortunantely, i spent seven days of my annual vacations to attend the course.
Let’s see some real seismic examples, illustrating and probably explaining why at my time the interpretation of the seismic lines was mainly made by geophysicists.
Ex: 1- Unmigrated seismic line
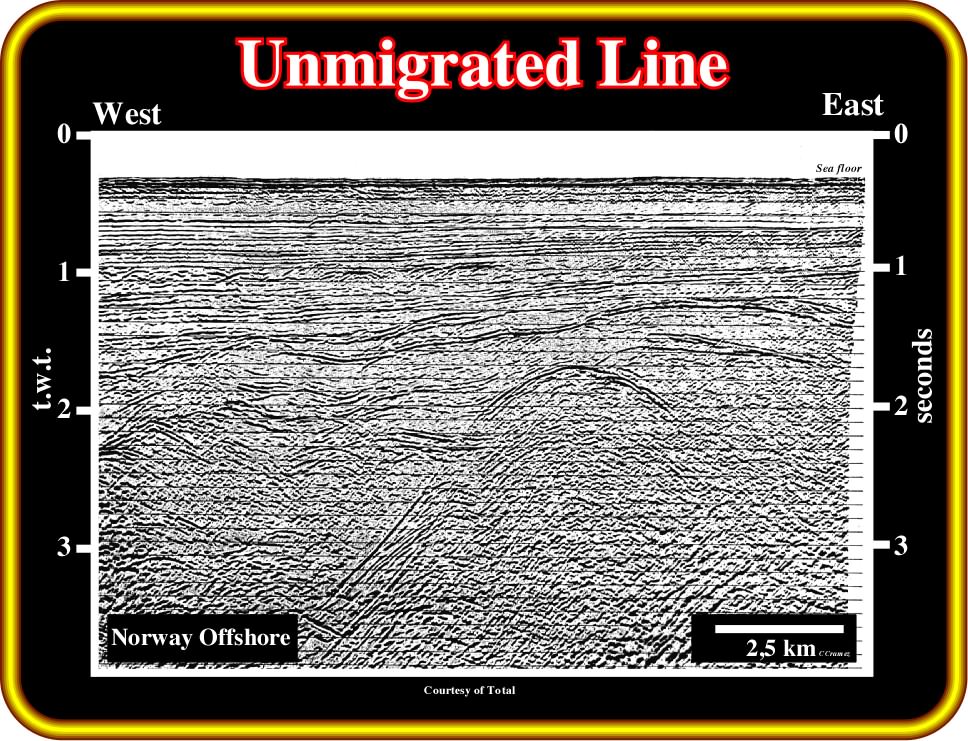
Before the advent of migration processing, i.e., before the 80's, geoscientists were obliged to interpret, in structural and stratigraphic terms, unmigrated lines such as the one illustrated below (Plate 42).
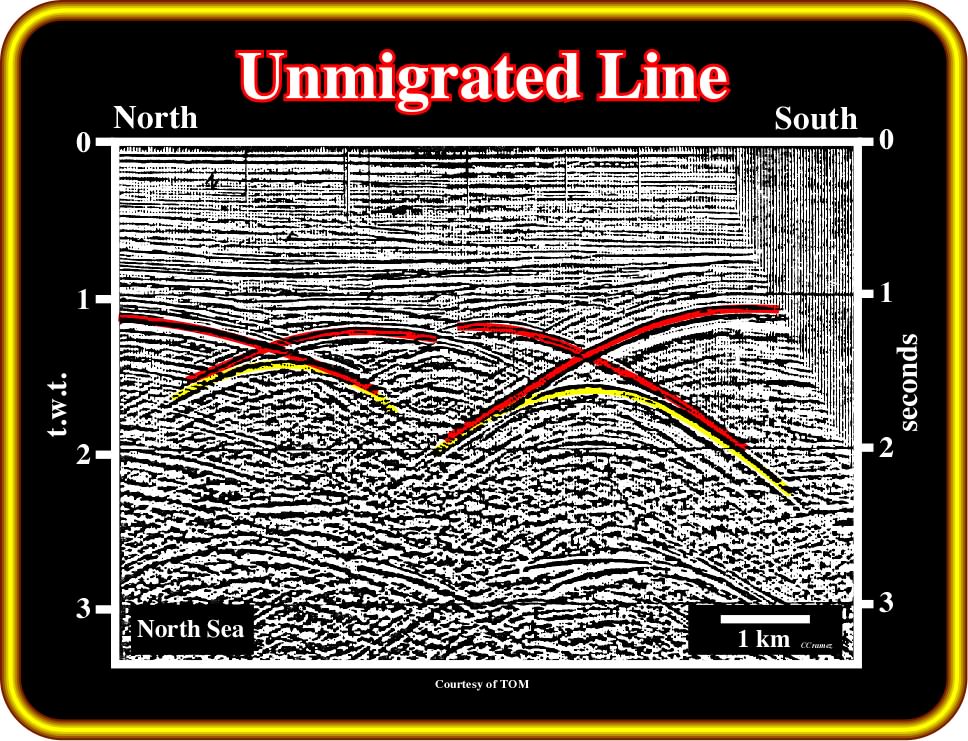
Plate 42 - This old unmigrated seismic line comes from a relatively quite tectonic North Sea area. Knowing the regional geological setting (rift-type basins overlain by a cratonicbasin) and the fact that a synform seismic response can be a convex upward reflection (when centre of curvature is in the subsurface, see Plate 40), it is relatively easy to predict two synform structures separated by a structural high zone (see Plate 41).
Ex: 2- Migrated seismic line
Migration processing (i.e., the tool to get an accurate picture of the underground layers involving a geometric repositioning of return signals to show an event where it is being it by the seismic wave rather than were it is picked up) was extremely helpfully for seismic interpreters, particularly geologists. A migrated line looks much like a geological cross-section. Comparing the lines illustrated on Plates 43 and 44 is sufficient enough to understand the impact of migration in the geological interpretation of seismic lines.
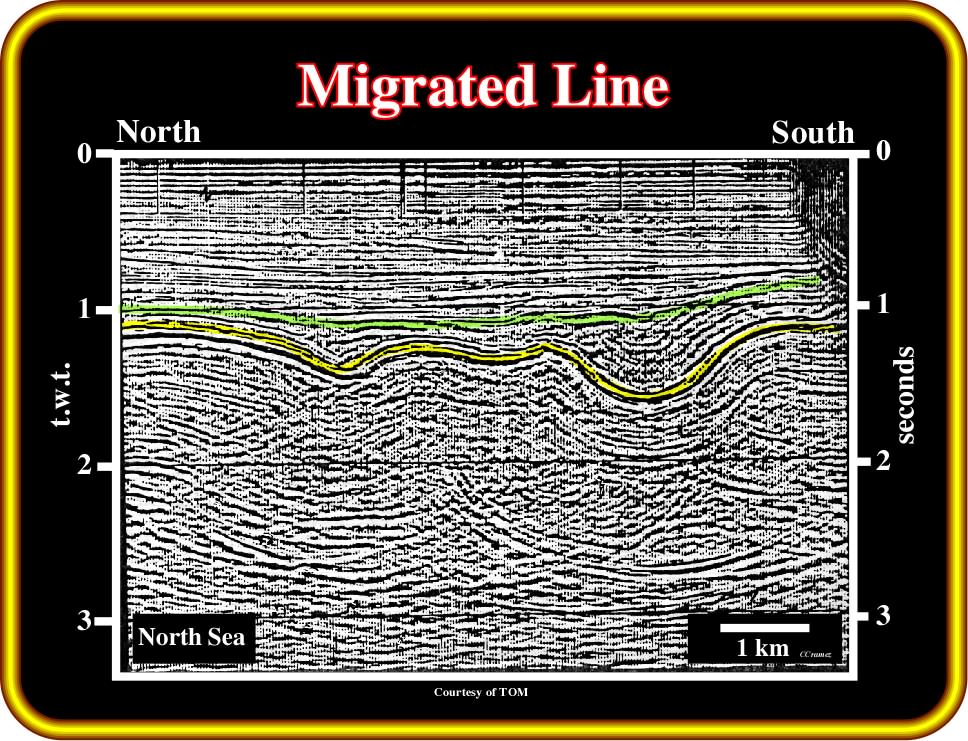
Plate 43- This seismic line is the migrated version (the more important migration methods are pre-stack and post-stack migration) of the previous unmigrated line (Plate 42). In spite of the fact that a migrated seismic line looks like a geological cross-section, interpreters must never forget : (i) the vertical scale is in time and (ii) seismic artifacts, as those induced by lateral changes of velocity, are almost always present. In other words, interpreters must differentiate the reflectors with geological meaning from those unrelated to the geology of the area. Generally, seismic reflections follow, grosso modo, chronostratigraphic surfaces but, under certain circumstances, reflections might have a diachronic behavior. This is particularly true when hydrocarbons are present in reservoirs-rocks and in fluvial environments sequences where closely-spaced reflectors, which are not, strictly speaking, synchronous, may give continuous reflections due to the limited seismic resolution (ability to distinguish separate features or the minimum distance between 2 features so that the two can be defined separately).
Since migrated seismic lines became available for interpretation, the organization of the teams in charge of the geological interpretation of seismic data changed drastically due to massive arrival of geologists. At that time, geologists were trained to understand the differences between seismic lines and geological cross sections, in order to avoid misinterpretations induced by seismic artifacts. However, with time, training courses for geoscientists (a specialist in earth science.) became rare. Nowadays, the majority of geologists arriving in interpretation teams do not know the driving principles of interpretation. I hope that this seminar can help not only geologists but geophysicists as well.
Ex: 3- Offshore Norway
On the unmigrated seismic line illustrated on Plate 44, the recognition of the different sedimentary basins and stratigraphic phases requires from interpreters a certain a priori geological knowledge.
Plate 44- This old unmigrated seismic line comes from offshore Norway. So, to start the interpretation, theoretically from bottom to top, interpreters must recognize (i) type-rift basins and (ii) an Atlantic-type divergent margin (following the A. Bally’s basin classification). The rift-type basins are separated from the Atlantic-type margin a major unconformity, which corresponds to the breakup of the Pangea lithosphere. In addition, in the divergent margin, geoscientists must try to individualize the transgressive, that is to say, the backstepping and the regressive or forestepping phase. One should not forget that geoscientists just recognize on seismic lines what they known. By the same token, they must progress from the general to the particular and not the opposite.
The interpretation of such lines depends mainly on the geological knowledge (scientifical knowledge) of interpreters:
(i) Geological context ;
(ii) Basins classification (Bally’s classification) ;
(iii) Driving concepts of Sequential Stratigraphy ;
(iv) Driving mechanisms of seismic reflections, and so on.
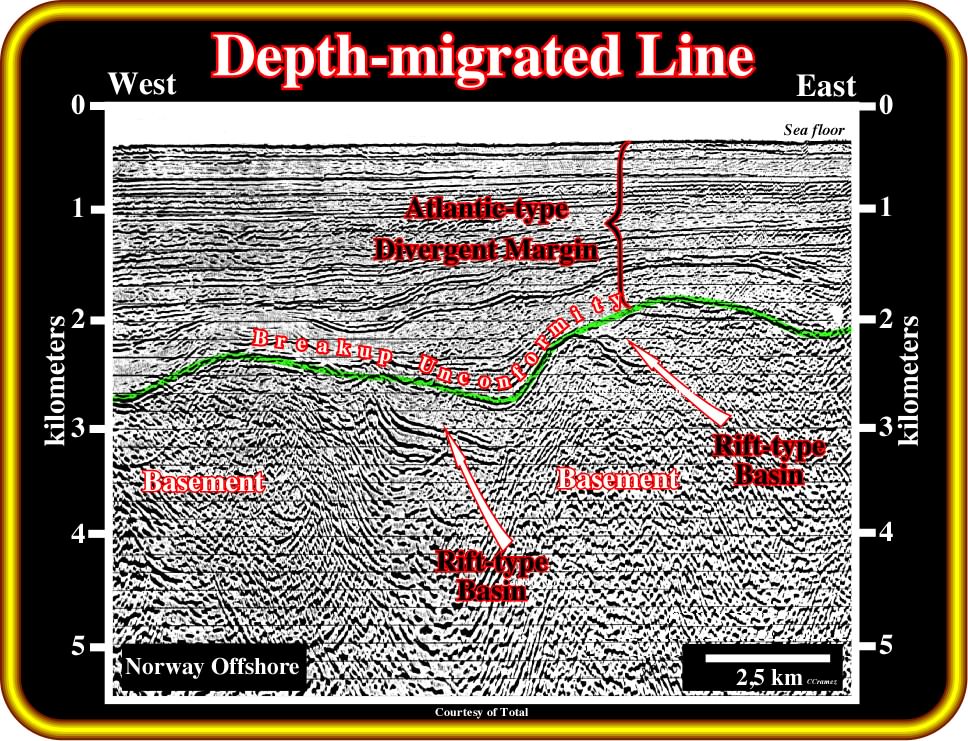
The depth migrated version of the previous line is shown in Plate 45. Its geometry looks similar to that of a geological cross-section. The geological interpretation is easier than on the previous unmigrated version. This is particularly true for junior geoscientists. Nevertheless, it must be noticed that:
a) The scales (horizontal and vertical) are different ;
b) The seismic lines are not at natural scale (1:1) ;
c) The vertical scale is, often, strongly exaggerated.
Plate 45- This line is a depth migration (65°) version (traditional wave equation migration from dip limitations and cannot accurately image dips greater than 65°) of the line illustrated previously (Plate 44). The vertical scale is exaggerated. Interpreters must take into account that geological laws require a natural scale, that is to say, the same vertical and horizontal scale. On this version, the infrastructure (basement), the rift-type basins and the Atlantic-type divergent margin are much more easy to recognize than on the unmigrated version (Plate 44). The breakup unconformity (picked in green) marks the bottom of the Atlantic-type divergent margin. The interface associated with such an unconformity changes laterally, since the margin sediments onlap not only the basement but the rift-type basin sediments as well.
As said previously, to migrate a seismic line correctly, it is necessary to define fully the velocity field of the ground (specify the value of velocity at all points). In practice, for purposes of migration, an estimate of the velocity field is made from prior analysis of the non-migrated seismic section, together with information from borehole logs (when available). In spite of this approximation almost invariably migration leads to major improvement in the seismic imaging of the reflector geometry.
Ex: 4- Offshore Angola
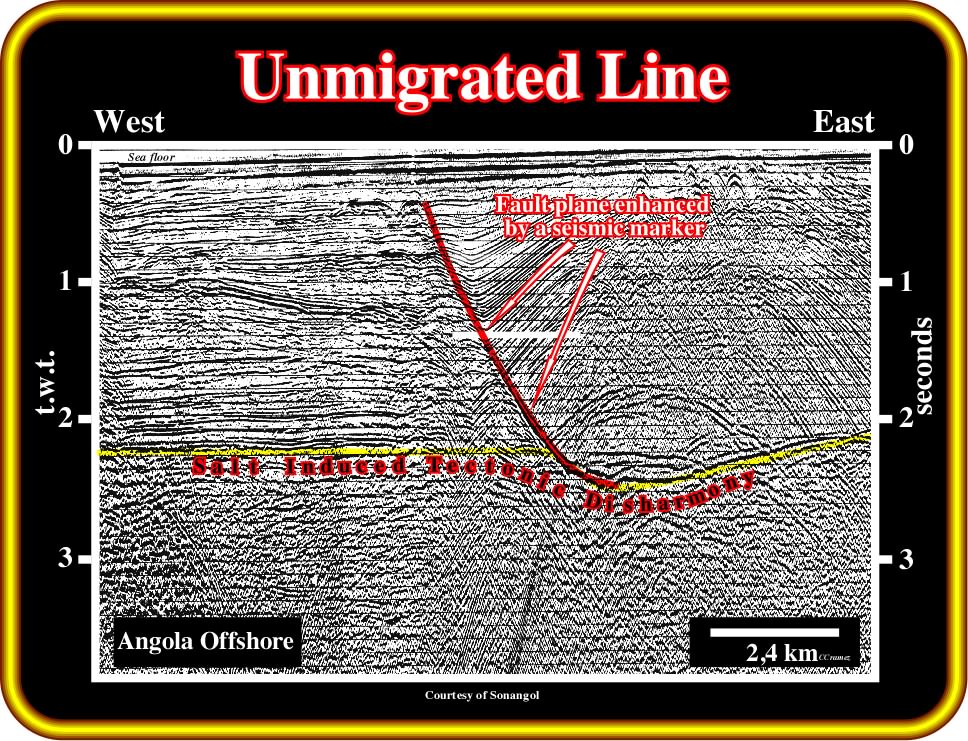
The line illustrated in Plate 46 comes from Kwanza offshore(Angola), in which salt tectonics induce huge antiform structures (extensional structures), which have attracted geoscientists (particularly explorationists, i.e., geoscientist working in hydrocarbon exploration) since the beginning of the 20th century (Sinclair Oil Company, 1904).
Plate 46- This old unmigrated line from offshore Angola, where a Cretaceous evaporitic salt layer was deposited near the bottom of an Atlantic-type divergent margin. The presence of such an evaporitic interval increases, strongly, the complexity of the seismic data. Halokinesis, associated with an extensional tectonic regime, developed a sharp tectonic disharmony at the base of the evaporites. The sediments overlying the evaporites are quite deformed, while the infrasalt strata are almost undeformed. This tectonic disharmony does not correspond to a major stratigraphic boundary. In other words, the segmentation of the Atlantic margin sediments into supra and infrasalt strata is just a tectonic disharmony. It does correspond to any major stratigraphic feature. The salt induced tectonic disharmony is much more evident in migrated data as illustrated on Plate 47. Notice that the lower part of the major listric fault zone is filled by salt, which is enhanced by a non chronostratigraphic seismic reflector. The marker associated to the salt induced tectonic disharmony shows a sharp pull-down below the suprasalt turtle-back structure (lateral velocity change between the limestones of the footwall and the sand-shales of the hangingwall of the listric fault).
In the 70’s, when only unmigrated lines were available, interpreters had a lot of problems to understand the tectonic complexity induced by halokinesis (salt tectonics mainly in absence of compressional tectonic stress). Nowadays, migrated versions of the old lines and new migrated data, as well as 3D, make interpretation easier. Nevertheless, interpreters must pay attention to potential pitfalls, such as : pull-ups, pull-downs, reflectors’ dips, etc., which are often associated with the available data. The interpretation of the migrated version (Plate 47) is much easier than the unmigrated version (Plate 46).
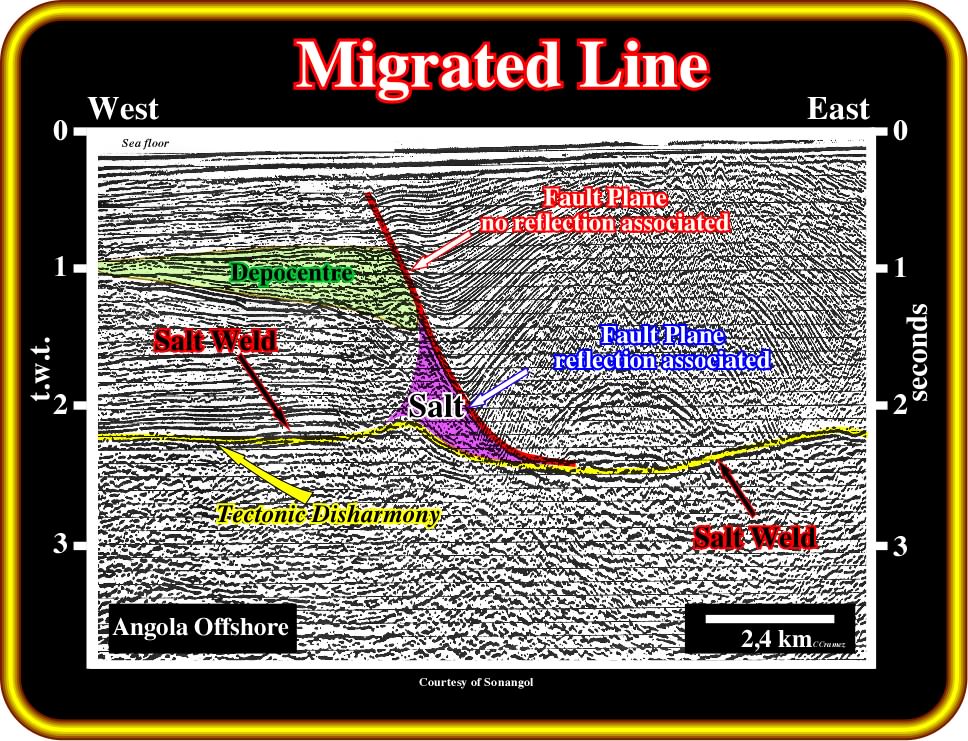
Plate 47- In this migrated version of the previous line, the majority of the diffractions (various phenomena which occur when a wave encounters an obstacle) have disappeared, depicts much better the seismic surfaces (surfaces defined by the reflection terminations) than the unmigrated version Plate 46). The tectonic disharmony, at the bottom of the evaporitic interval, is quite evident. Similarly, the geometric relationships and the internal configuration in the extensional antiform (turtle back structure), developed in the hangingwall of the listric growth-fault, are readily recognized. Also, it is easy to notice that, at the present time, the evaporitic interval is not continuous. A salt roller (low-amplitude, asymmetric salt structure comprising two flanks: a longer, gently dipping flank in conformable stratigraphic contact with the overburden and a shorter, more-steeply dipping flank in normal-faulted contact with the overburden), in the lower part of footwall of the listric fault, separates two quite evident salt welds (surface or zone joining strata originally separated by autochthonous or allochthonous salt). As theoretically expected, the sediments underlying the tectonic disharmony are almost undeformed, which contrasts with the post-salt sediments.
Actually:
- The majority of diffractions disappeared ;
- The reflectors are in a more correct position ;
- The vertical scale still is in time ;
- The dip of the reflectors are apparent and exaggerated ;
- Using exaggerated dips as criterion to predict facies and environment is dangerous ;
- Lithological and environment predictions require:
(i) Time-depth conversion ;
(ii) Data at natural scale, i.e., at 1:1 scale.
Comparing the unmigrated (Plate 46) and migrated (Plate 47) versions is easy to notice :
a) Migration removing hyperbolic interferences clarify the reflections ;
b) Hyperbolic features arising from reflection terminations, faulting or other ways, are shrunk to a point by the migration process ;
c) Antiform structures have a more naturalistic picture on migrated lines:
c.1) Apexes are not moved in position ;
c.2) Flanks are more abrupt ;
d) Fault planes and associated morphological traps by juxtaposition are moved up dip by migration (a better assessment of the potential closed area is possible) ;
e) On the unmigrated line, interpreters are left with the impression of faulting, but it lacks precision. On the migrated line, in the central part of the line, interpreters easily recognize an important curve normal fault (erroneously called listric fault by several geoscientists) with an eastward vergence and a decreasing hade ( the angle from a vertical to the fault plane) ;
f) On lower part the fault plane, where the hade (the angle that a structural surface makes with the vertical, measured perpendicular to the strike) is higher, a seismic reflector is associated with the fault plane ;
g) On the apex of the large antiform, several normal fault (extension) with opposite vergences are recognized ;
h) Non-primary reflections, such as (i) multiples, (ii) reflected refractions, etc., are merely distorted by the migration process, so they can mislead the interpreters (see later).
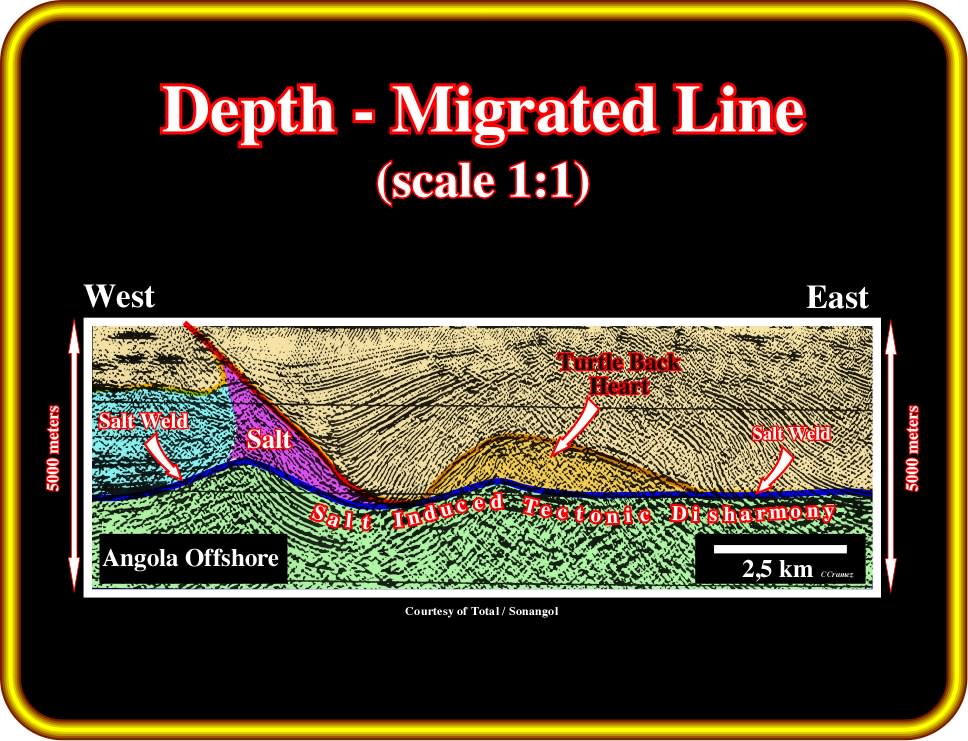
Plate 48- This depth-migration version of the previous seismic line is at natural scale (1:1). Theoretically, the dip of the reflectors correspond to the real dips of the bedding planes. Similarly, the dip of the listric fault plane is real. However, as you already probably noticed, this depth conversion is not perfect. The salt-induced tectonic disharmony should be more or less flat (or dipping slightly seaward) and not undulated, as illustrated above. In fact, when this depth-migration conversion was performed, due to raft-tectonics, geoscientists did not properly control the velocity intervals in Angola offshore. Due to halokinesis, in which tectonic inversions are frequent, the majority of the geometrical relationships (reflection terminations) are apparent. In fact, as we will see later, the reflection terminations on the tectonic disharmony are not downlaps but tilted onlaps. In other words, the reflection terminations are not pristine, but deformed by salt flowage. The assumption that the bottom of the salt is more or less subhorizontal and isochronous is valid just at small scale. Actually, in Angola offshore as well in Brazil offshore, the salt layer can aggradate (onlap) more than 500 milliseconds pre-salt margin sediments, particularly carbonate build-ups.
Notice that in Plate 48:
- The depth migrated seismic line is at natural scale ;
- The horizontal and vertical scales are metric and equals ;
- The dips of the reflectors are real.
- Geological laws, such Goguel‘s law, Walter’s law, etc., were respected in the proposed tentative interpretation of the seismic line.
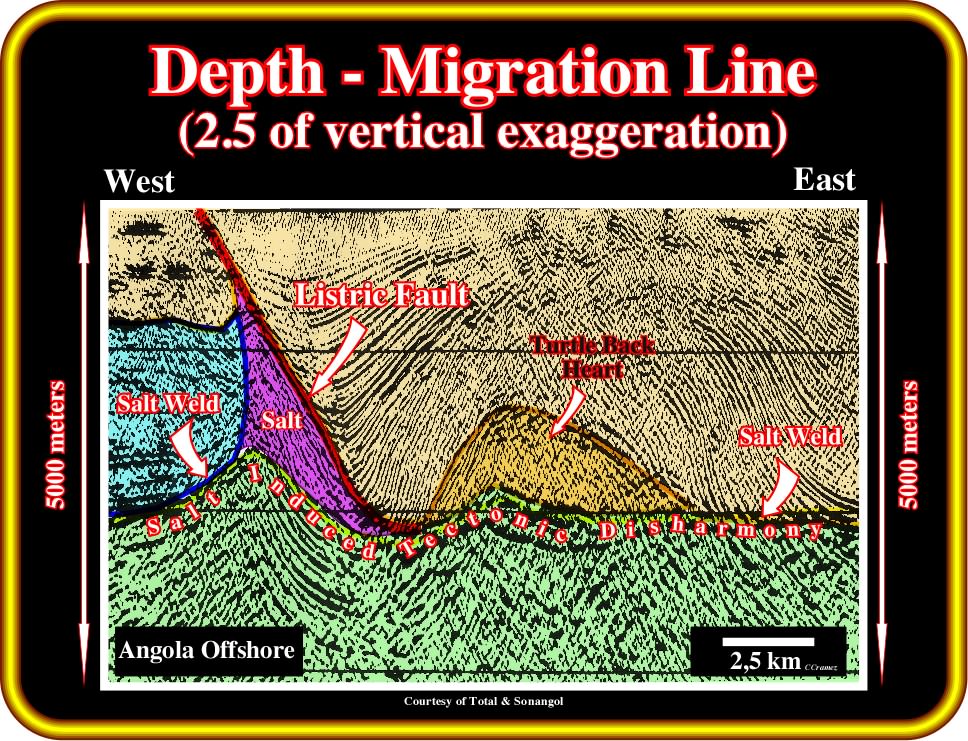
Plate 49- The previous depth migrated line is here illustrated with a vertical exaggeration of 2.5 times. Geoscientists and particularly those using workstations or PCs for interpretation of seismic data should never forget that Geology is scale dependent. Indeed, aprogradational interval, for instance, highlights a continental slope or as deltaic slope (prodelta). The interpretation depends of vertical and horizontal scales. On the other hand, geological laws, as Goguel’s law, Anderson’s fault law, etc, can only be applied at natural scale data. Nevertheless, this kind of anamorphosed representation is quite useful to show the importance of a given phenomenon. In this particular case, the anamorphosis enhanced the pull-up induce by the salt roller in the footwall of the listric faults as well the small pull-up induced by the core of the turtle back structure (hangingwall).
Notice that in this version (Plate 49):
-The dips of the chronostratigraphic lines (primary seismic reflection) do not correspond to the dips of the beds on the ground. They are 2.5 times exaggerated. Dipmeters values (electrical-log) match only with the dips of depth-migrated lines when depicted at natural scale (1:1).
The majority of seismic lines used are vertically exaggerated. Under such circumstances, Anderson‘s Law of faulting must be used carefully, since on normal seismic lines (time lines), seismic surfaces associated with fault planes have a much higher dip.
to continue press
![]()