
Universidade Fernando Pessoa
Porto, Portugal
Seismic-Sequential Interpretation
F) Geological Models and Seismic Responses
Since current data processing and interpretation yield seismic sections resembling geologic cross-sections, inexperienced geologists and geophysics are often greatly tempted to read geology more or less directly from the seismic data. Unfortunately, as seen previously, serious errors may result in such approach. This is especially true in areas of complex tectonics (high dips), rapid changes in lithology (density and velocity), irregular surfaces and complex near surface conditions. The following geological models and their time responses indicate why so many errors are frequently found in the geological interpretations of seismic lines:
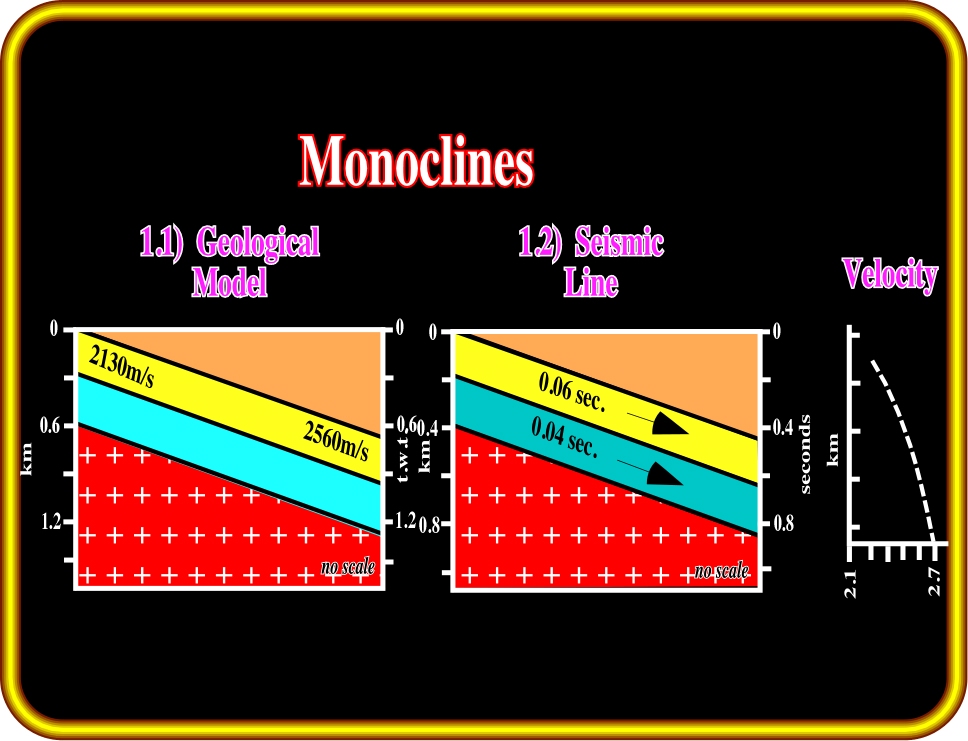
Plate 94- This sketch illustrates a monocline model and its seismic response. Tilted isopach time intervals do not show, in depth sections, a constant thickness, except when the tilting (sedimentary or tectonic) is post-compaction.
Actually, when the tilting is precompaction, there is an increasing of the velocity interval with depth, and so one can say that in time seismic lines (by far the more used) a constant time-thickness emphasizes an increasing depth-thickness, since the velocity interval is greater in the more buried sediments.
A mathematical geological model of a precompaction tilted stratigraphic column and its wave equation seismic response are illustrated below (Plate 94). The time thickness of each sedimentary package is thinning downdip. However, in the mathematical depth model the thickness is constant, just the velocity interval increases downward.
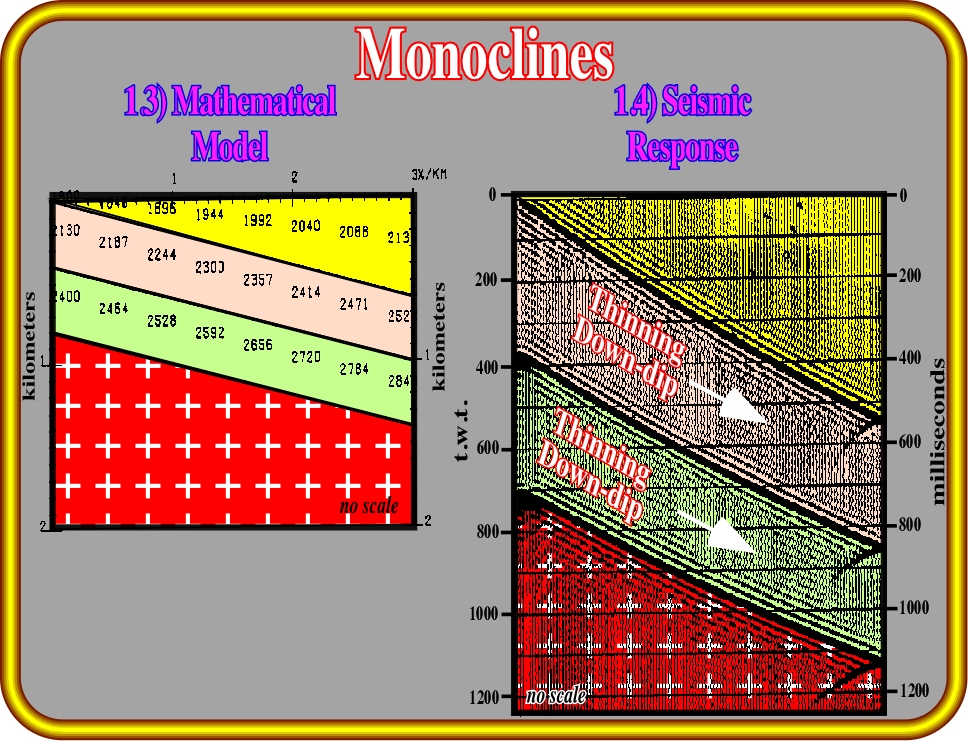
Plate 95- In the mathematical model, three isopach interval are considered. However, in each interval, due to differential burial the compressional wave velocity increases down-dip. In the uppermost interval (yellow), the velocity ranges from 1804 to 2136 m/s. In the second interval (rose), the velocity is higher. It ranges from 2130 m/s in the less buried sediments, to 2520 m/s in the more deeply buried sediments. In the green interval, overlying the basement, the velocities change from 2400 to 2840 m/s. In spite of the fact that in the model, the intervals are isopachous, they are thinning down-dip on the seismic response.
F.2- Normal Faults (Growth Faults)
On a seismic line, the majority of the normal faults have a geometry similar to that illustrated on Plate 96, that is to say, the reflector of the upthrown block, below the fault plane, is pulled down, while on the ground, or in the geological depth model (see below) the reflectors are roughly horizontal.
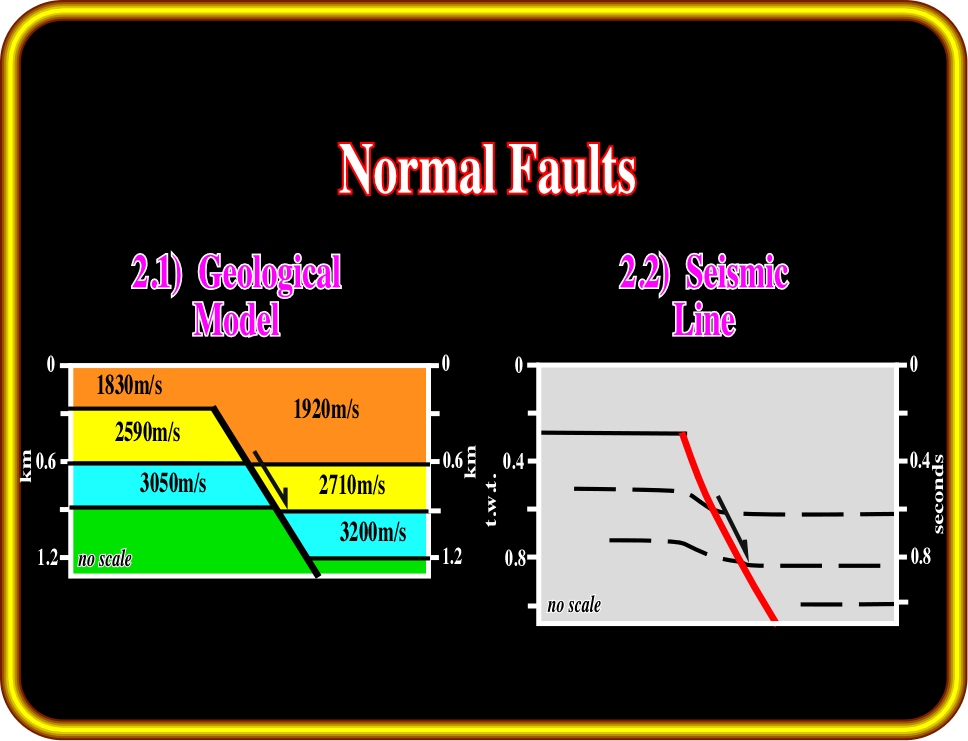
Plate 96- Above, a geological model of a normal fault and its seismic response are illustrated. Theoretically, due to the downward relative movement of the hangingwall, intervals with quite different interval-velocities are juxtaposed, which has important consequences on the seismic response. The footwall reflectors below the fault plane (area of a lateral velocity changing) will be pulled down, since, at same level, the velocity interval in the hangingwall is smaller.
The explanation of this misleading geometry is easily explained in Plate 97. Indeed, due to the fault movement, there is juxtaposition between high velocity sediments of the upthrown faulted block and lower velocity sediments of the downthrown block.
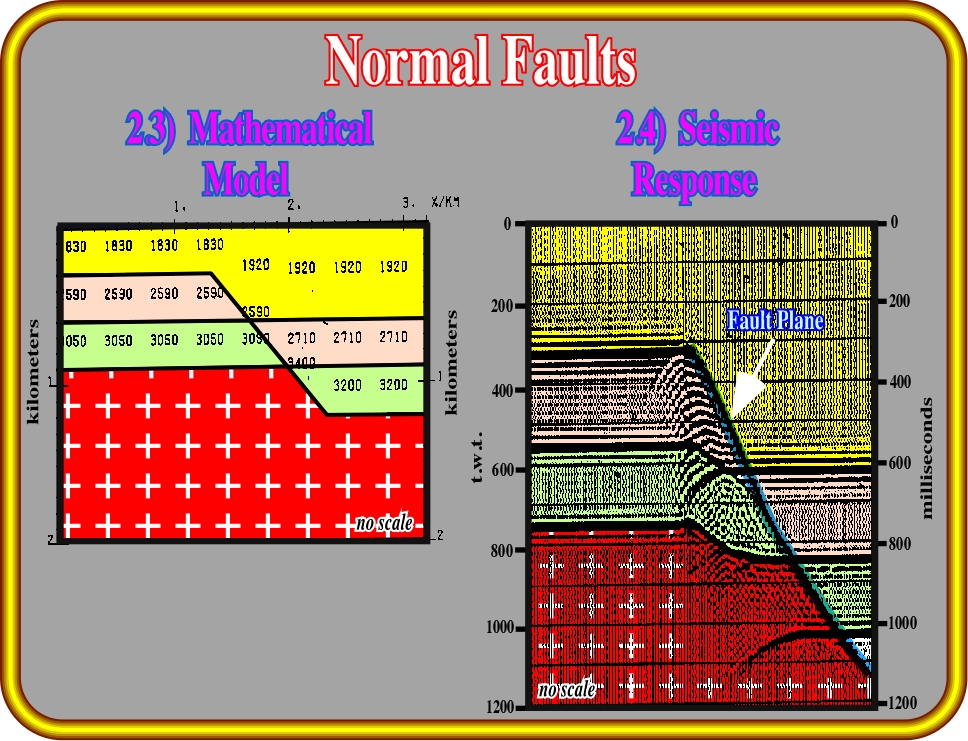
Plate 97- On the mathematical model, three sedimentary intervals are considered above the basement. All intervals are affected by a normal fault. Hence, the sediments of the hangingwall (downthrown faulted block) are denser. They reached higher depths. Therefore, their compressional wave velocities are higher than the sediments of the footwall. Subsequently, on the seismic response, the reflectors of the footwall are pulled-down below the fault plane, where there is a lateral change of interval-velocity.
This seismic artifact, induced by lateral changes in the interval velocity, is easily recognized on seismic lines, as illustrated below on the seismic line from offshore Angola (Plate 98). Indeed, as the sediments of the downthrown block of the fault-growth have a lower velocity (mainly shales) than the sediments of the upthrown block (mainly carbonates), not only the reflections below the fault plane are pull-downed, but the reflection associated which the salt weld as well as (downthrow block).
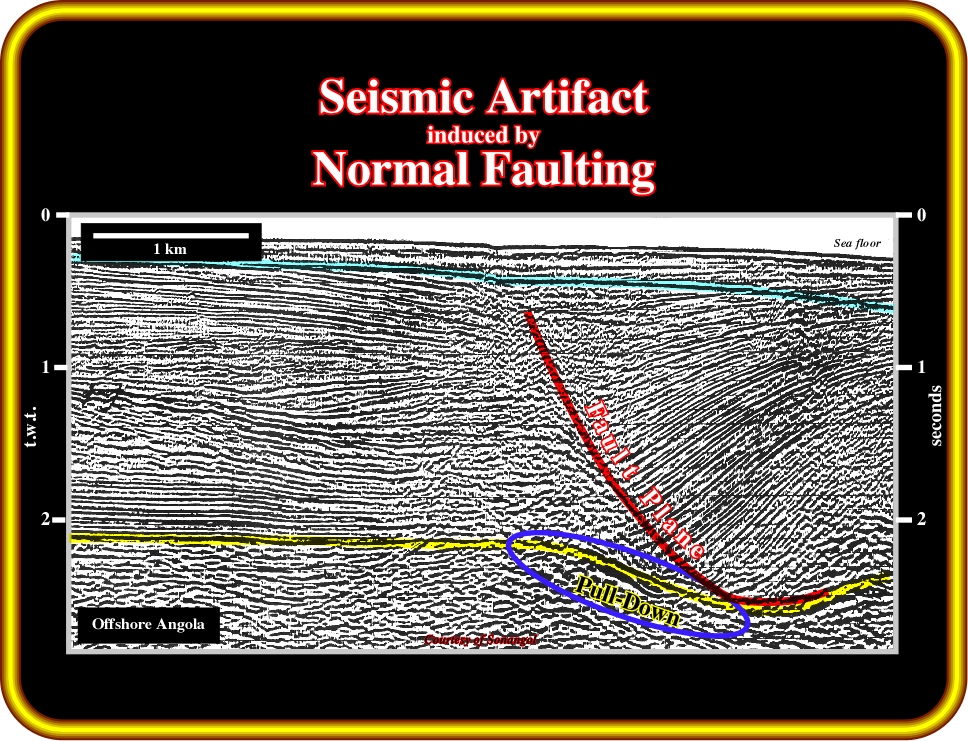
Plate 98- On this seismic line from offshore Angola, the pull-down of the yellow marker (bottom of the evaporitic interval) is induced by the lateral change of the interval-velocity created by the normal fault which limits a Upper Tertiary depocenter. Indeed, such a fault put limestones (upthrown block) and shales (downthrown block in juxtaposition.
F.3- Reverse Faults (Thrust Faults)
As shown in the geological model below, the geometry of the different sedimentary facies is parallel and horizontal and the interval-velocities are laterally constant. On the other hand, due to the fault movement, the upthrown block was uplift, and so, sedimentary packages with different velocity intervals are juxtaposed.
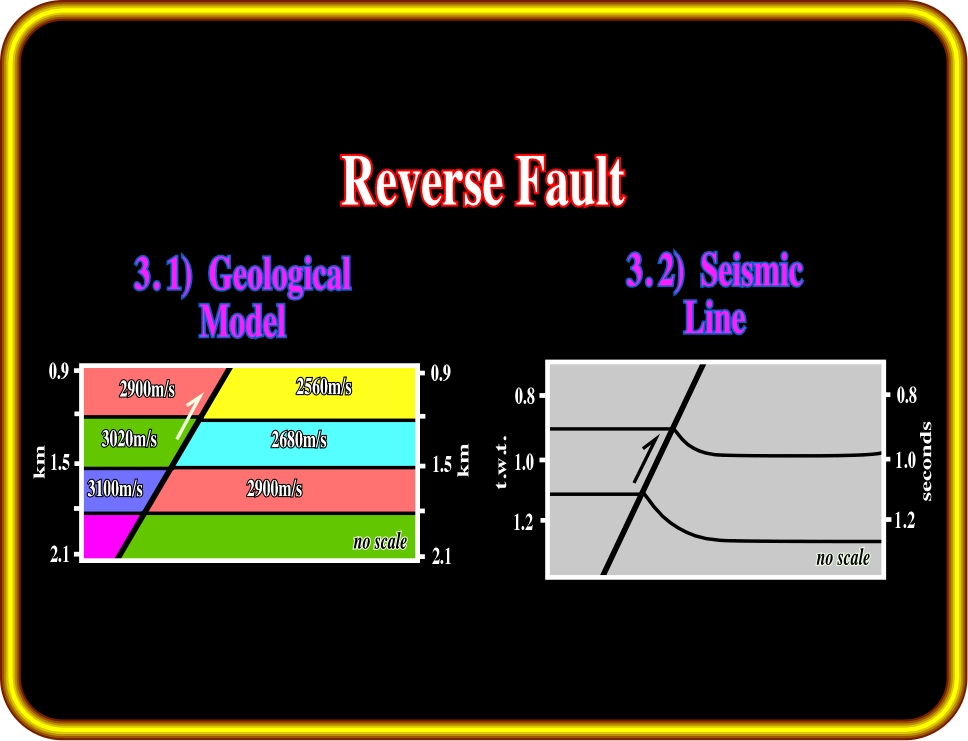
Plate 99- Above, the geological model of a reverse fault and its likely seismic response is depicted. As illustrated, the reflectors of the footwall are pulled-up due to a lateral change of the interval-velocities.
The principal consequence of the lateral, and abrupt changing of the velocity interval is the pull-up of the seismic reflectors below the fault plane, that is to say, of the footwall. Plate 100 illustrates the velocity model used to find the more likely seismic response (time) of the previous model.
It is particularly important to notice that on a seismic line, the trace of the reverse fault plane is not emphasized by an obvious reflection, but marked by the discontinuities between straight dipping reflector (on the right) and the pulled-up reflectors on the left (hangingwall). In other words, interpreters should not interpret the pull-up of the reflectors as a geological uplift associated with a compressional tectonic regime (i.e. as an antiform trap, for instance).
If you have doubts, to decide between a pull-up and a structural tectonic feature, do not forget that a depth conversion can solve the problem:
(i) If, the antiform like feature disappears on the depth-converted section that means that it was a pull-up induced by a lateral velocity change.
(ii) If, on the contrary, the antiform like structure persists on a depth converted line, it may be interpreted as sedimentary shortening in the footwall .
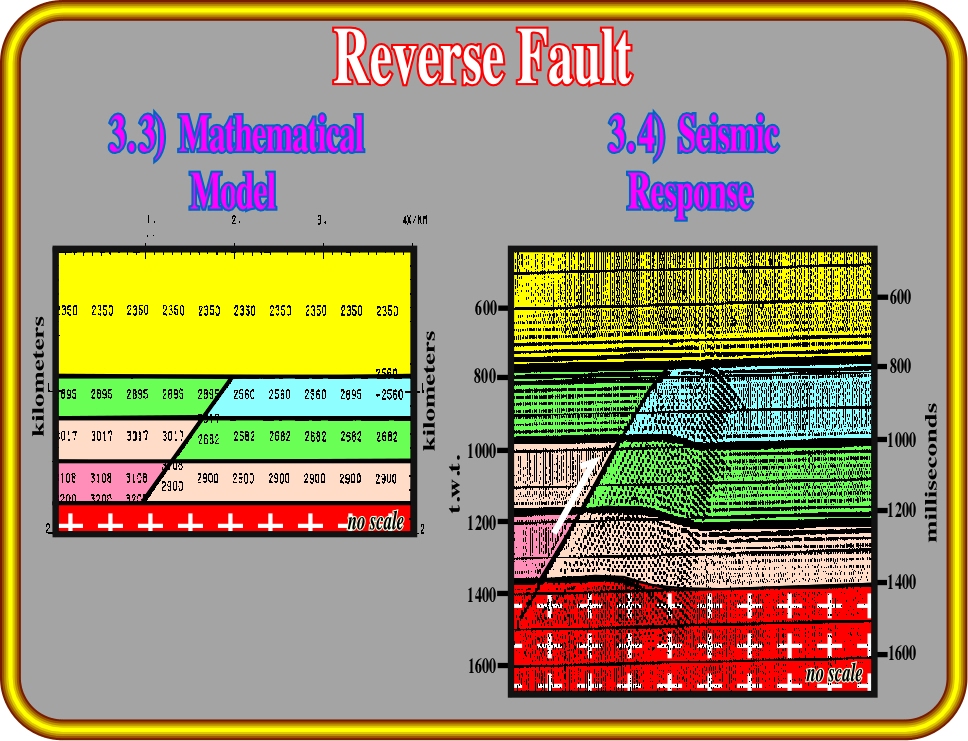
Plate 100- The seismic response of a mathematical model of a reverse fault, in which the sediments of the hangingwall are denser than those of the footwall, corroborates the hypothesis that the reflectors below the fault plane are pulled-up creating the common illusion of an anticline structure (see Plate 101).
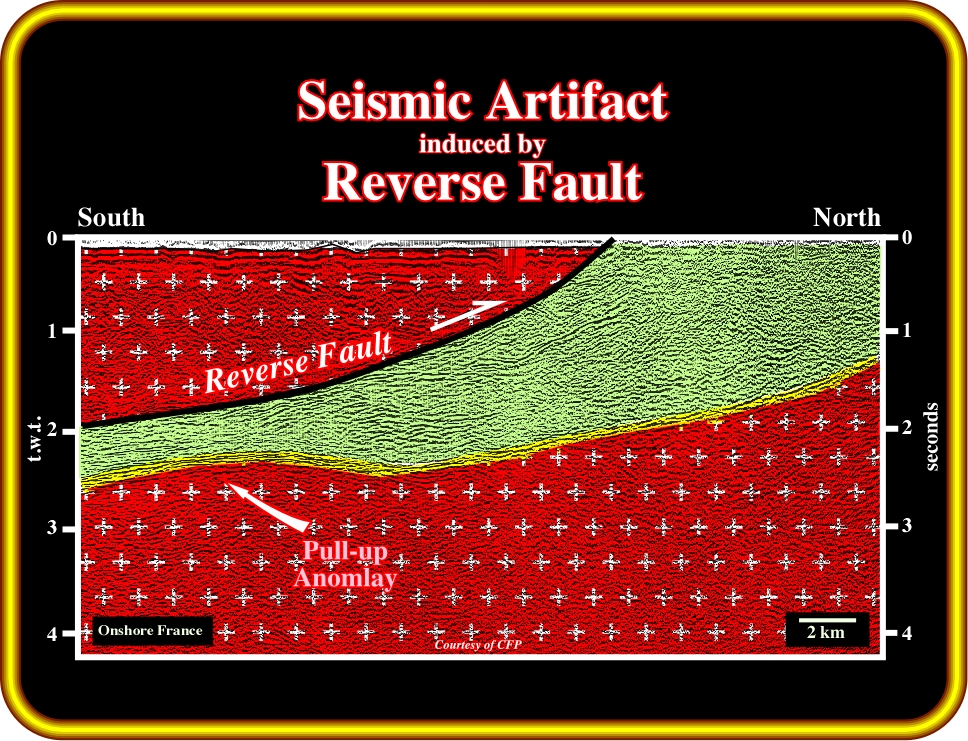
Fig. 101- This seismic line from onshore France illustrates a seismic artifact associated with a thrust fault, that is to say, an apparent anticline structure under the reverse fault plane. In spite of the evidence of the seismic pull-up, “explorationists” drilled a wildcat on such an artifact thinking that they were testing a large under-thrust structural trap. Actually, in certain basins, as we will see later, there are prolific petroleum traps under reverse and thrust faults, hence explorationists must always test their interpretations by time-depth conversions.
If you recognize an antiform feature in the footwall block of a reverse fault you must admit two possibilities:
(i) a seismic artifact and
(ii) an anticline.
Then, you must imperatively test both hypotheses and reject the one which is falsified by testing. In petroleum exploration, avoiding such scientific tests can be highly dangerous and expensive.
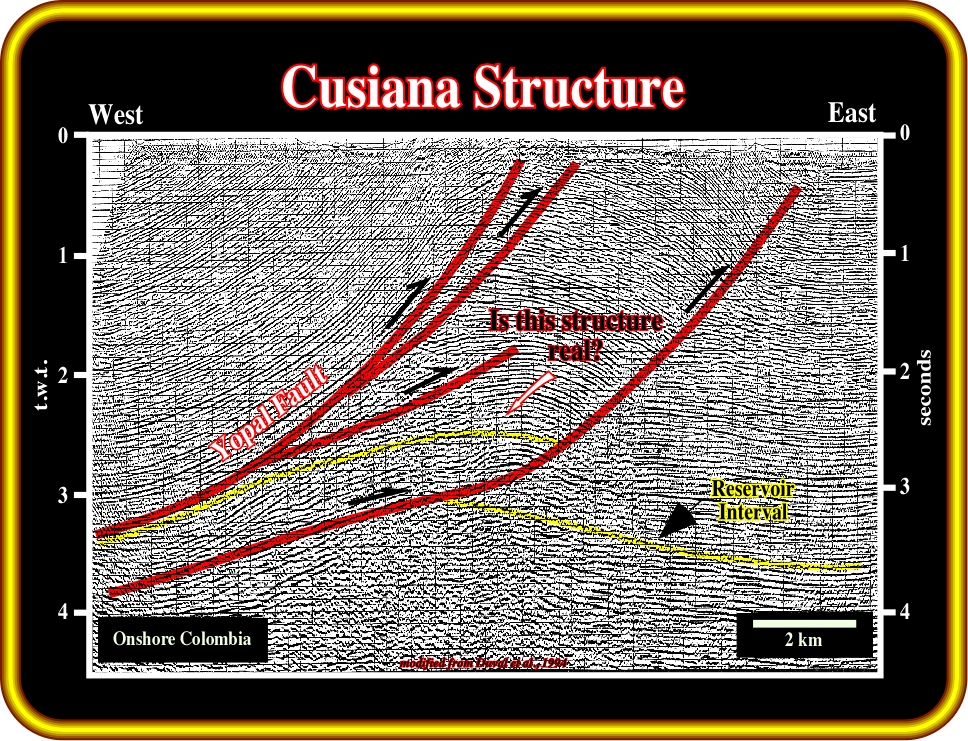
Plate 102- This seismic line through Cuisiana #2A (discovery well), in the Colombia foothills, was drilled by an international consortium composed of BP, Total and Triton, in order to test the anticline structure under upper thrust-faults. However, before drilling, several time-depth conversions corroborated the hypothesis advanced by certain explorationists that the sub-thrust antiform was a real compressional structure and not a seismic artifact induced by the hanging wall.
The Cusiana prospect, which is located on the footwall block of a very important reverse fault, the Yopal fault, was proposed by Triton, who held 100% of the exploration rights, to several major oil companies. However, the majority of the companies interpreted the structure as a pull-up due to a lateral velocity change induced by the Yopal fault, and refused Triton‘s farmout. Plate 103 illustrates a typical example of how seismic artifacts can be tested by a time depth-conversion. These examples from the Colombian onshore clearly illustrate the danger for explorationists to make strategic decisions without testing all proposed geological hypothesis.
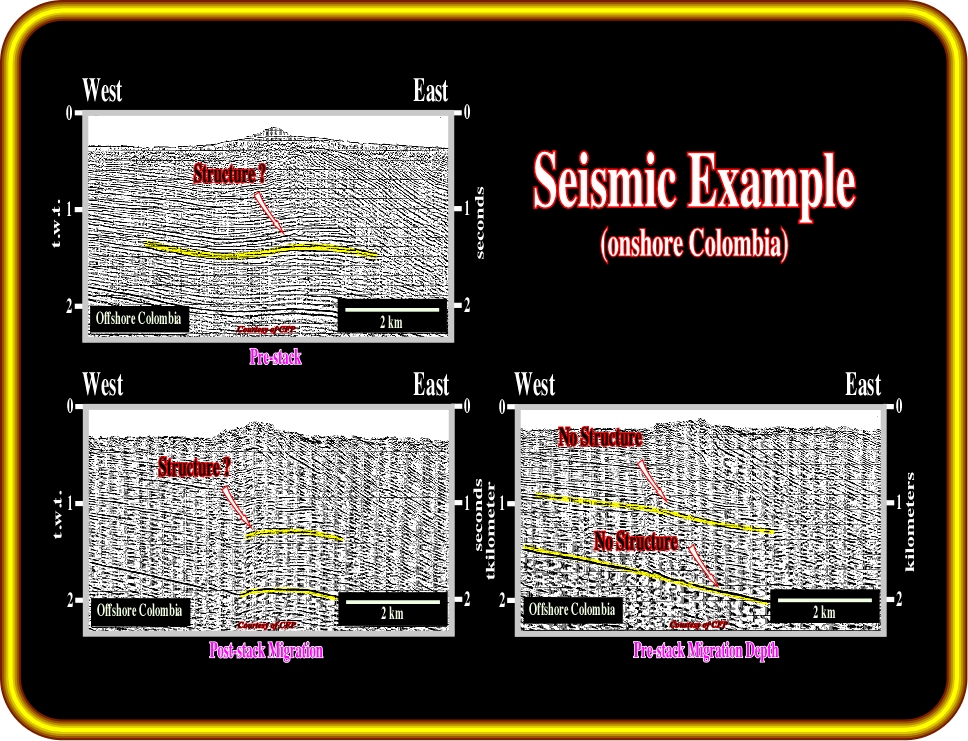
Plate 103- Note all time-depth conversions corroborate anticline structures below the thrust faults. In this particular example, coming, as the previous line, from the Colombia foothills, a nice antiform structure (that is to say a potential structural trap) is recognized on the pre-stack section. The same potential structure is also recognized on the pre-stack migrated version, just under the fault plane, which should make the interpretation questionable. Finally, the pre-stack migrated depth versions strongly falsify the hypothesis of a sub-thrust structure. Actually, the sub-thrust sediments are undeformed and not shortened.
to continue press
![]()