Porto, Portugal
Contents:
2.1- Salt Density
2.2- Salt Plasticity
2.3- Salt Dissolution
2.4- Salt Reduction
      2.4.1- Volume Loss
      2.4.2- Lateral Flow
2.5- Salt Movements
      2.5.1- Isopachous and Homogeneous Overburden
      2.5.2- Variable Thickness of Overburden
      2.5.3- Variable Lateral Density of Overburden
               a) Compressive Strength
               b) Tensile Strength
      2.5.4- Tectonic Tilting
              a) Overburden less Dense than Salt
              b) Overburden Denser than Salt
Contrary to other sedimentary rocks, the density of salt does not vary with depth. It ranges between 2.15 and 2.17 depending of its composition (fig. 28). Indeed, the salt density varies slightly with its composition. The density of the salt formed from evaporation of hydrothermal enriched brines is slightly greater than salt evaporating from meteoric brine.
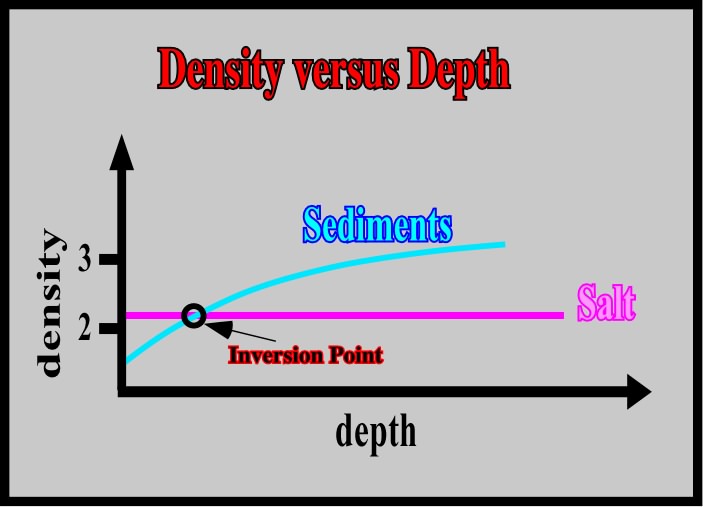
Fig. 28- In the shallow part of sedimentary basins, between the surface and 1500 meters depths, the density of the salt, which is more or less constant, is higher than the density of the sediments. However, below the inversion point, the density of the sediments is higher than the salt density.
As all sedimentary rocks (except salt) become compacted with depth. Their density increases. In basins with a layer (autochthonous or allochthonous), there is always a given depth, or inversion point (in the field, it is more correct to speak about an inversion zone that an inversion point), defining two different domains:
(i) An upper domain, in which the salt density is higher that of the density of the sediments, and
(ii) A lower domain, in which the density of the sediments is higher than the density of the salt.
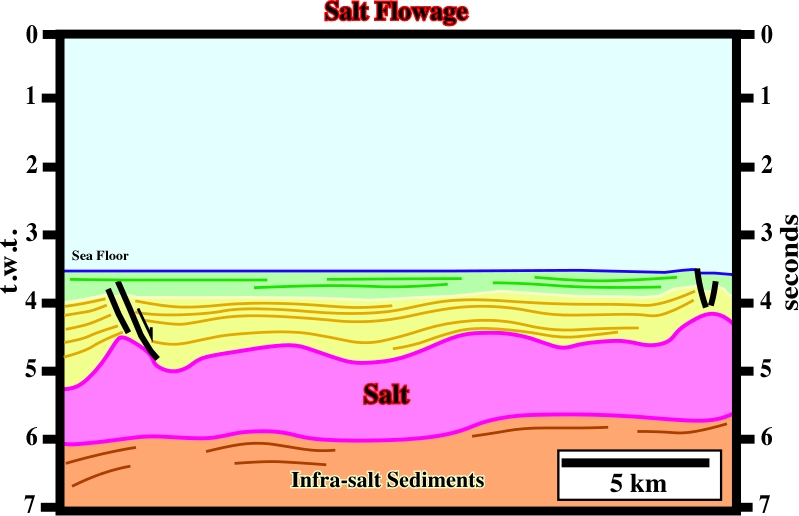
Within the upper domain, as the pressure produced by the salt against the sediments is not balanced by the pressure produced by the sediments against the salt, the salt has the propensity to flow laterally. Within the lower domain, the salt has a propensity to flow upward, because, at the same level, the confining pressure in the sediments is always higher than the confining pressure within in the salt. This explains the hypothesis that salt domes with vertical walls are physical impossibility. They exist only on paper as inaccurate interpretations of seismic data.
Salt behaves as a plastic material. It undergoes no permanent deformation if the applied stress is smaller than a characteristic yield stress. It flows readily when the applied stress is at, or slightly above, the yield stress (one can idealize plastic behavior mathematically by assuming that there is no deformation at all (the material is rigid) below the yield stress and that during the deformation, the stress cannot rise above the yield stress except during acceleration of the deformation. This model describes a perfectly plastic material or a rigid-plastic material). Salt deformation starts beyond a certain pressure threshold, ranging between roughly 50 and 150 bars, depending on the nature and composition of the salt. The Loeme salt ( in Kwanza-Congo basin) and the Louan salt (in Gulf of Mexico) seem to start deformation under lower pressure than the Messinian salt (Mediterranean basin).
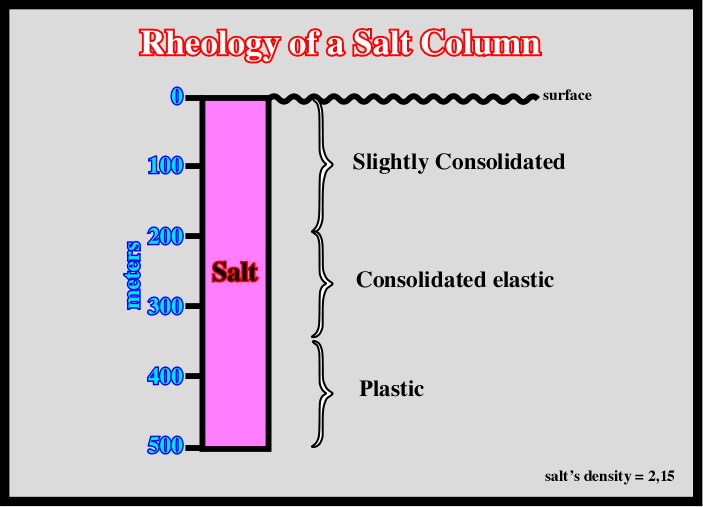
Fig. 29- Salt can flow without or under a small overburden thickness. In absence of significant tectonic stress, a relatively thick salt column (> 400 m) shows different rheologies. From top to bottom: (i) slightly consolidated, (ii) Consolidated elastic and (iii) Plastic. The deeper plastic interval can flow just due to the height of the upper intervals.
Theoretically, in an outcropping column of 500 meters of salt, assuming a salt’s density of 2,15, the ![]() v of the geostatic pressure (
v of the geostatic pressure (![]() g) at 230 meters depth (as said previously, at a given point, the geostatic or lithostatic pressure, which corresponds to the height of the rock column, can be represented by a vertically oblong biaxial ellipsoid;
g) at 230 meters depth (as said previously, at a given point, the geostatic or lithostatic pressure, which corresponds to the height of the rock column, can be represented by a vertically oblong biaxial ellipsoid; ![]() vertical and
vertical and ![]() horizontal), is 50 bars, while at the bottom, it is 107 bars. So, plastic salt deformation can occur within a salt layer even in the absence of overburden. A column of 500 meters of salt, for instance, can be considered as a vertical superposition of three salt intervals in terms of rheology (fig. 29). From bottom to top:
horizontal), is 50 bars, while at the bottom, it is 107 bars. So, plastic salt deformation can occur within a salt layer even in the absence of overburden. A column of 500 meters of salt, for instance, can be considered as a vertical superposition of three salt intervals in terms of rheology (fig. 29). From bottom to top:
a) Plastic b) Consolidated elastic and c) Slightly consolidated.
In other words, in absence of a tectonic stress and significant overburden thickness, salt deformation is possible due to the geostatic pressure of the upper salt intervals. It is difficult to mention buoyancy to explain movements within the salt, since density of the salt is constant in depth.
Salt dissolution has been recognized on the ground and on seismic data. In the North Sea, Arbenz (1968) and Lohmann (1972) explained particular structures, recognized on seismic lines, as an aftermath of salt dissolution. Indeed, when salt is dissolved at surface, or nearby, a potential void is created inducing deposition or development of extensional structures in order to solve the volume problem (fig. 30 & 31). Actually, under wet climates, if a salt dome reaches the surface or the sea bottom, it will be subjected to dissolution. The central part of the dome, prominent and broken, will be preferentially attacked. Rounded depressions will be form and sooner they will become deep funnels that widen and join over the salt, creating a vast salt-dissolution basin with hillocks of insoluble material.
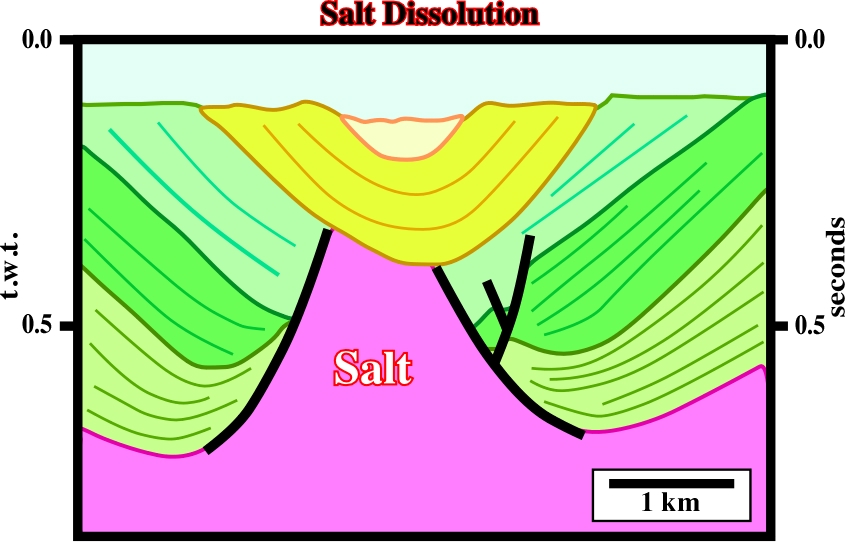
Fig. 30- On surface or at sea bottom, at the vertical crest of a salt dome, a more or less circular collapsed basin is often formed as a consequence of salt dissolution by meteoric waters. On this line, the uppermost sedimentary intervals can be explained by salt dissolution on top of the salt dome. Salt dissolution creates a local relative sea level fall, which increases the accommodation and favors deposition just above the top of the dome.
When a salt dome is not outcropping but covered by a relatively thin and permeable sedimentary interval, its roof can be washed. Geologists call this subrosion. The role of the fractures above the dome is quite important. It controls the shape, development and verticality of the walls of subterranean dissolution basins. A depocenter is gradually created over the permeable cover, whereas leaching creates a more or less horizontal salt-cover interface. Independently of the cap rock (often, salt domes are capped by an insoluble mixture of calcite and anhydrite (gypsum and sulphides, when altered); this mineral cap is called cap rock. Its thickness reaches sometimes several hundred metes what creates important positive effect in magnetic and seismic data), the thickness of the salt-dissolution basins can reach more than 500m (Série des Cirques, in N’Daminzé dome, Gabon) or 10-50 m as above the Rumania’s domes.
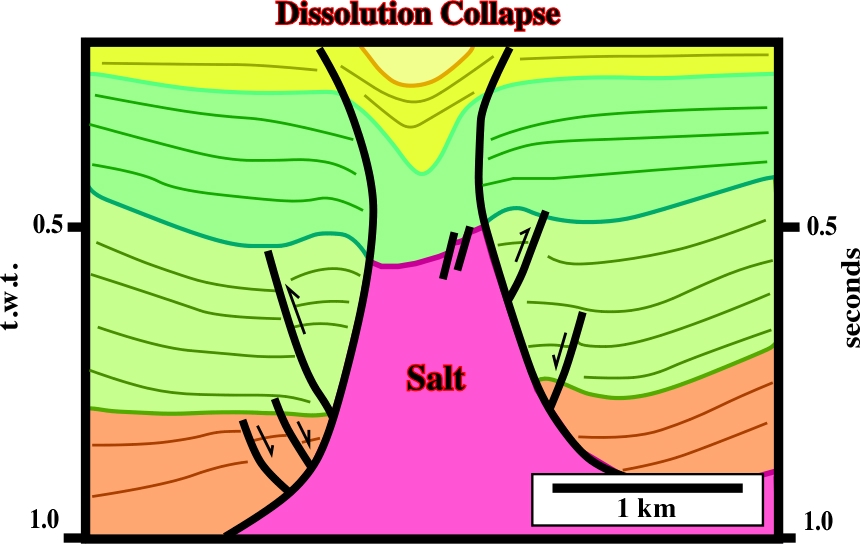
Fig. 31- A salt-dissolution basin, over the top of the salt dome, is quite evident. The salt dome was squeezed. Similarly, folding and reverse faulting shortened the sediments juxtaposing the flanks of the dome. Just above of the dome, the topography of the sea floor (not visible on this line) has sub-circular trough morphology, similar to that of the Grand Saline dome, in onshore Texas. Notice that such a morphology can also be created by a salt collapse induced by lengthening of the overburden.
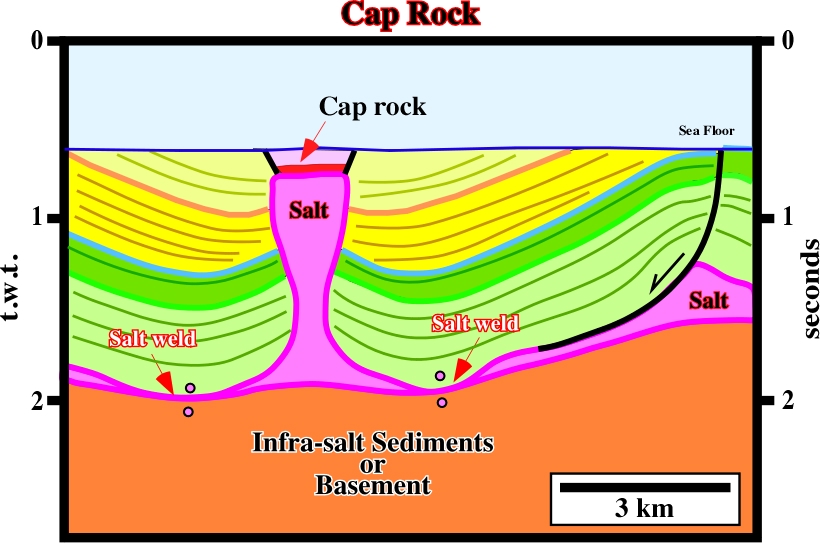
Fig. 32- Cap rocks are often located on the top of the salt dome reaching the surface, or the sea bottom. They are easily recognized on seismic data. Indeed, they create a sharp change in the acoustical impedance profile, which produce sub-horizontal high amplitude seismic reflectors.
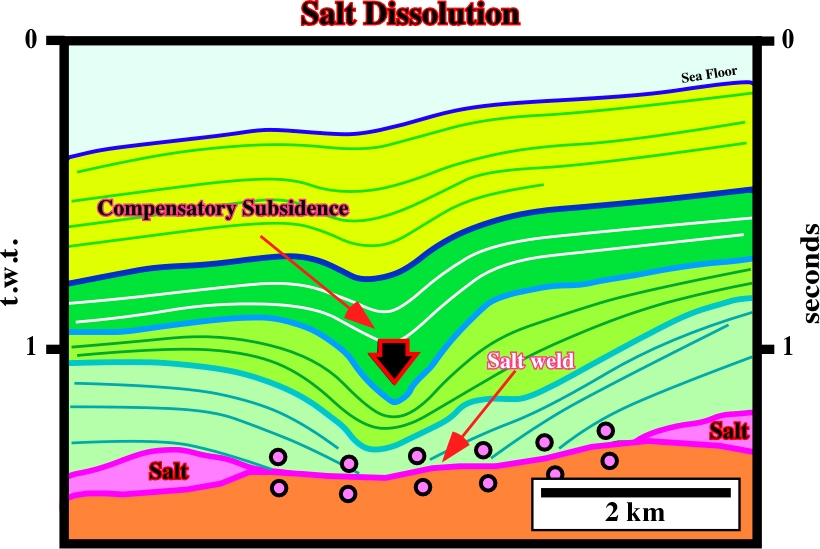
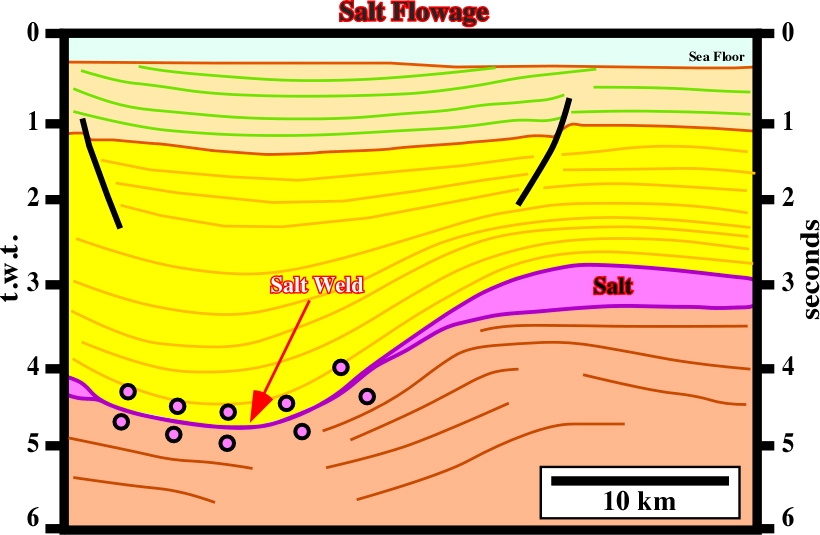
Fig. 33- Salt dissolution below permeable intervals, with an active aquifer, can produce antiform structures bounded by salt welds, as suggest on this line. In certain cases, they are difficult to interpreted, as illustrated in fig. 34.
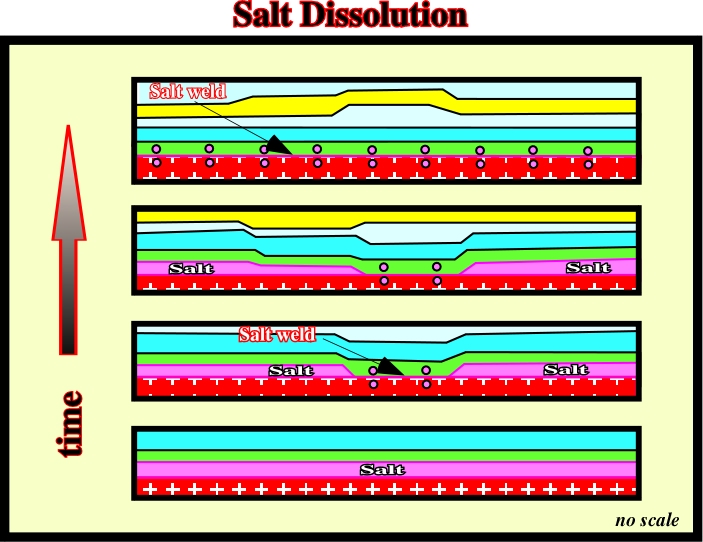
Fig. 34- This sketch, taken from Arbenz (1968), suggests one of the more likely hypotheses explaining particular antiform structures occurring in North Sea. In Arbenz’s hypothesis, successive salt dissolutions transform a continuous and isopachous salt layer into a wide salt weld with development of the antiform extensional structures in the overburden. Alternative hypotheses have been proposed. However, Arbenz’s hypothesis is, by far, the more difficult to refute.
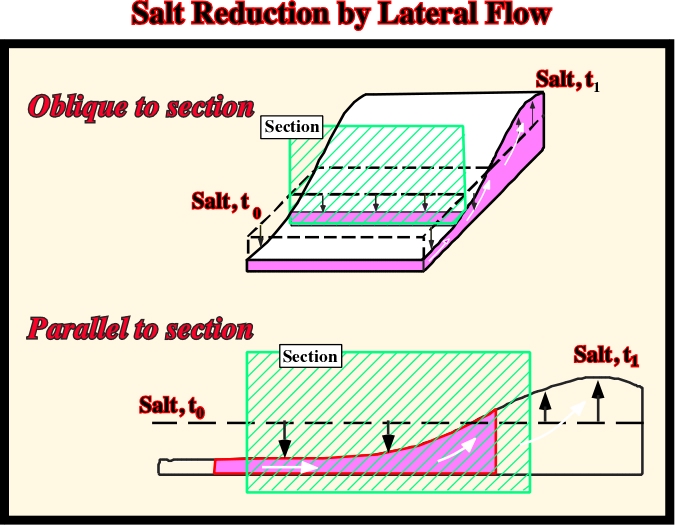
Salt reduction can be made whether by (i) volume loss (2.4.1) or (ii) lateral flow (2.4.2) as illustrated in figs. 35 to 41.
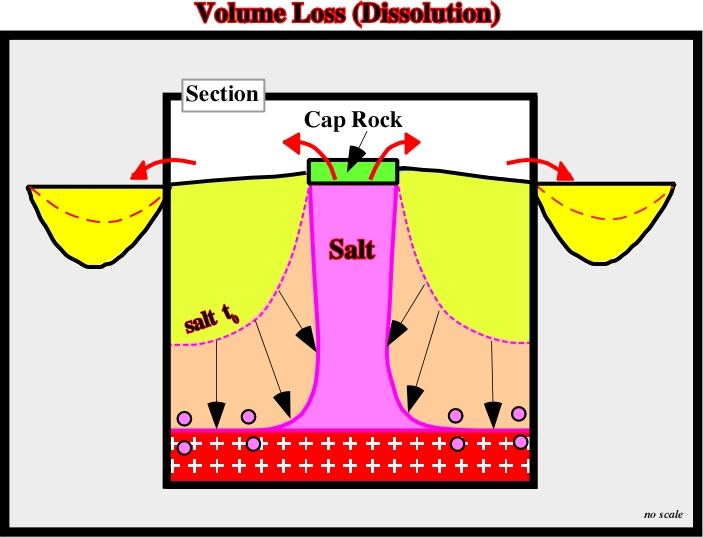
Fig. 36- Salt reduction can take place by dissolution of the upper part of a salt dome with development of a significant cap rock, as illustrated above. The flanks of the dome retracted from the original position of the salt (t0) to the present time position. Salt welds can be formed disconnecting the salt dome from the mother layer.
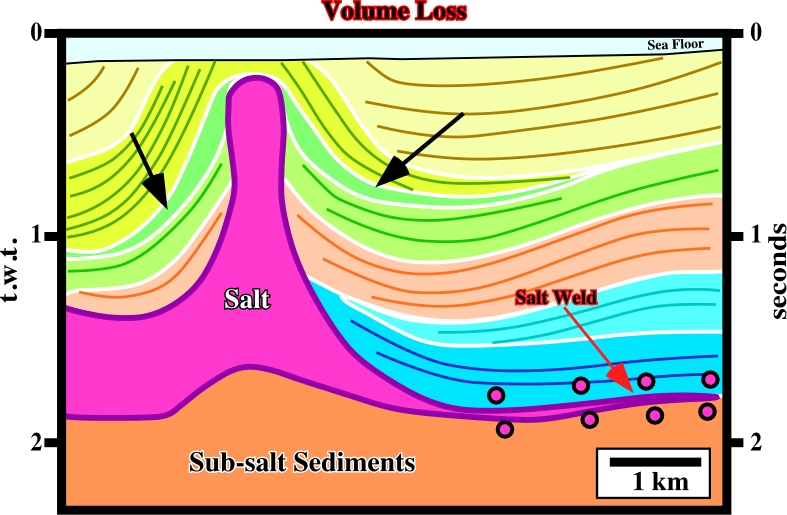
Fig. 37- On this line, some of the upper sedimentary intervals, particular the dark green, can be explained by volume reduction created by salt dissolution. Other hypotheses can be proposed to explain the differential subsidence responsible of the deposition of the upper intervals of the overburden.
Whenever a salt interval is overlain by overburden whose average density exceeds that of the salt, there is a mechanically unstable situation. Different geological situations can be considered:
In absence of overburden, whenever the difference in pressure (![]() P) between two given points, not very distant, within a salt layer (with plastic properties), is zero, there is no salt movement. The same is true when the overburden is isopachous and homogeneous (fig. 42).
P) between two given points, not very distant, within a salt layer (with plastic properties), is zero, there is no salt movement. The same is true when the overburden is isopachous and homogeneous (fig. 42).
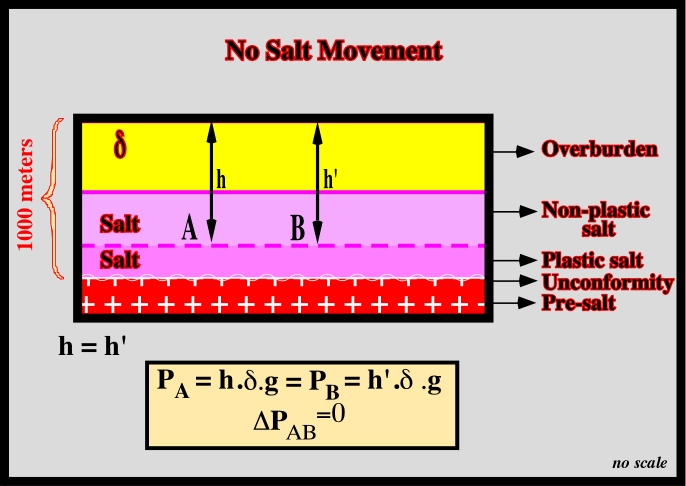
Indeed, as illustrated in fig. 42 and 43, even if the thickness of the salt interval is relatively small, the loading of the overburden can be enough to create, within the salt layer, two intervals with different rheologies:
(i) An upper interval with a non-plastic behavior.
(ii) A lower interval with plastic behavior.
In the lower salt interval, the salt can flow laterally, if, at same depth, there is a different pressure between two points A and B. However, when the salt and the overburden are isopachous and homogeneous, the lithostatic pressure (![]() g = P = h.d.g) (h= depth of the given points, d= average density of the sedimentary column above the given points and g = the gravitational constant), at the given points, is the same. Subsequently, there is no salt movement or salt flowage.
g = P = h.d.g) (h= depth of the given points, d= average density of the sedimentary column above the given points and g = the gravitational constant), at the given points, is the same. Subsequently, there is no salt movement or salt flowage.
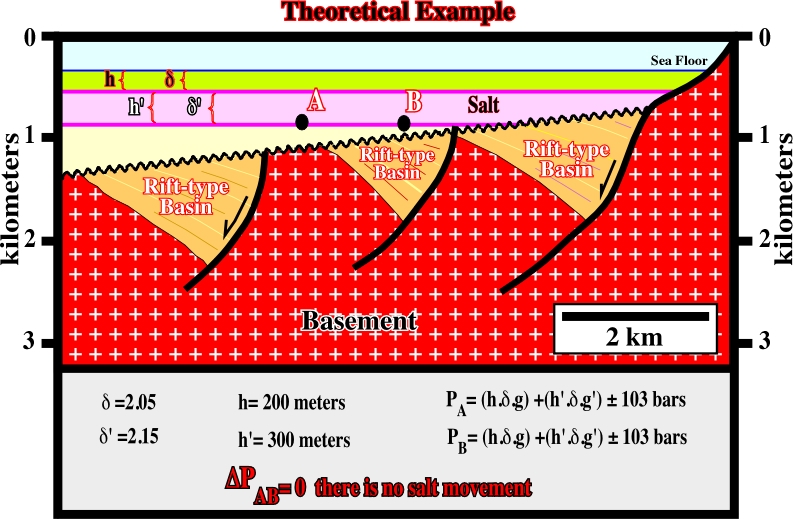
Fig. 43- Theoretically, the geostatic pressure at points A and B, located at the base of the salt interval, is the same. Therefore, in absence of a significant tectonic stress, there is no salt movement. There is no difference in pressure in isobaths within the salt layer.
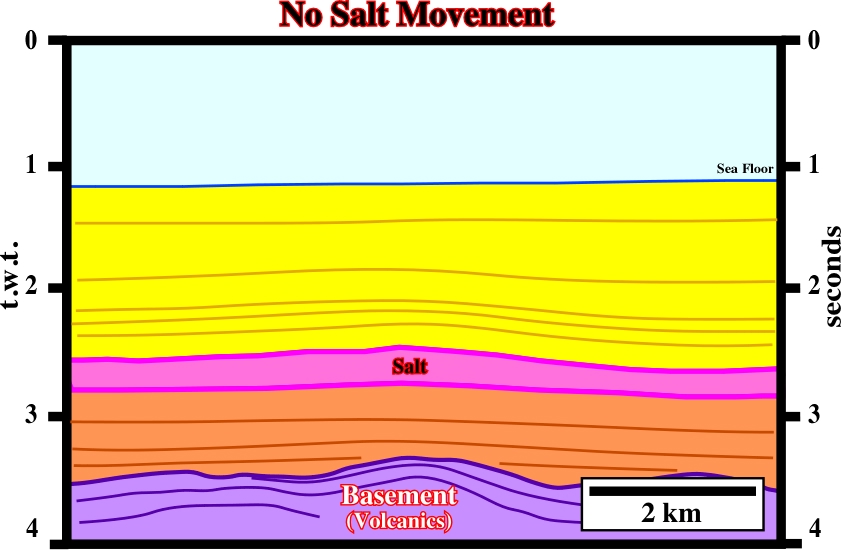
Fig. 44- There is no significant salt flowage in the area covered by this line. All points, within the salt layer, lying on the same isobath have more or less the same geostatic pressure. If there is a pressure difference, it is not sufficient enough to overbalance the friction strength at the bottom of the plastic salt.
If a difference in pressure (P) exists between two not very distant points, and in same isobath, within a salt interval with plastic properties, salt movements can take place. In subsurface, salt movements occur when the force (f) created by difference in pressure (DP), between two points, is greater than zero. However, DP must overcome:
a) The friction, at the base of the salt, and
b) The resistance of the overburden.
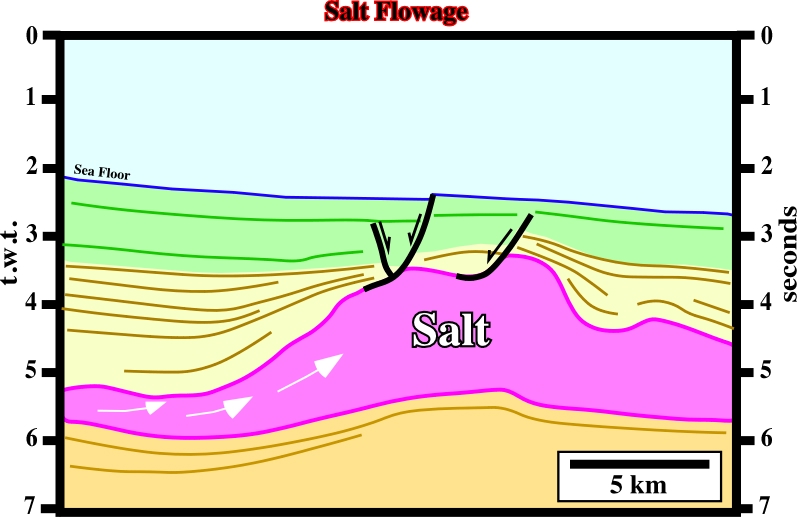
When the thickness of the overburden (fig. 45), or the water depth, changes laterally (fig. 46), within a plastic salt interval, salt can flow from high-pressure to the lower pressure areas. Such hypotheses are quite frequent in sedimentary basins, particularly in divergent margins whether Atlantic type or non-Atlantic type. Non-Atlantic divergent margins are those developed in basins associated with the formation of the megasutures (compressional setting), particularly when extension is big enough to break-up the lithosphere and initiate sea floor spreading (e.g. Mediterranean basins). In fact, the sedimentary prisms become condensed seaward with geological conditions of starved basins and the water depth strongly increases basinward of the shelf break.
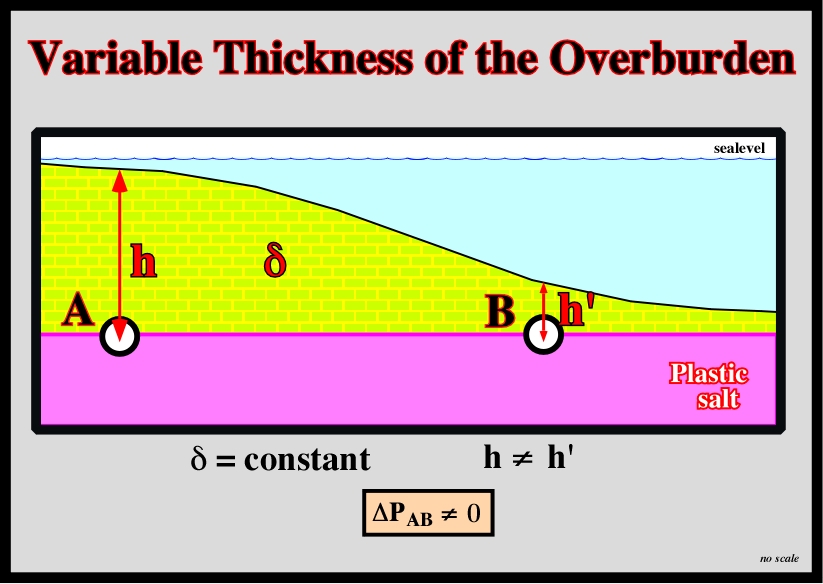
Fig. 45- Assuming a more or less constant density of the overburden, a progressive increasing of the water depth and a plastic salt layer, it is always possible find two point (A and B), not to distant, on the top of the salt or within the salt, with different of pressure (
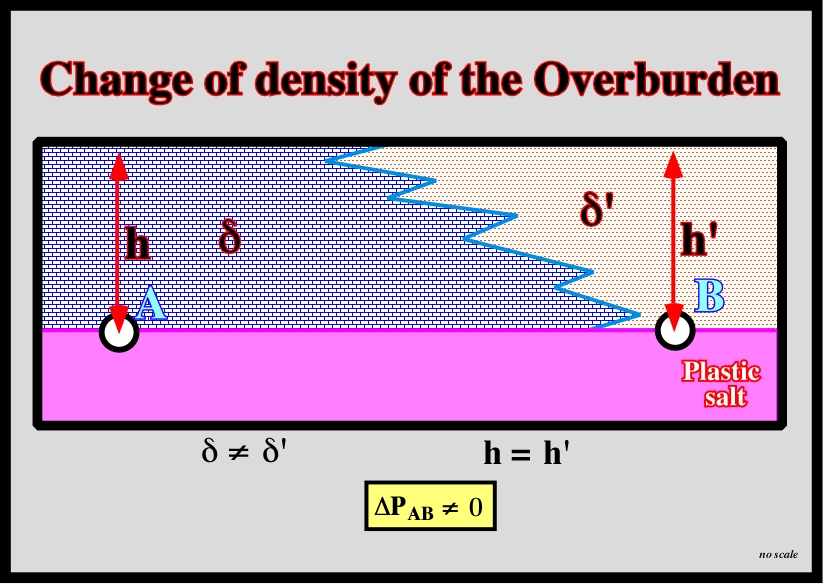
P) big enough to induce salt flowage from A (high pressure) to B (lower pressure). Similar salt displacement can be induced just by density variation (change of facies) of the overburden, as illustrated in figs. 47 and 48.
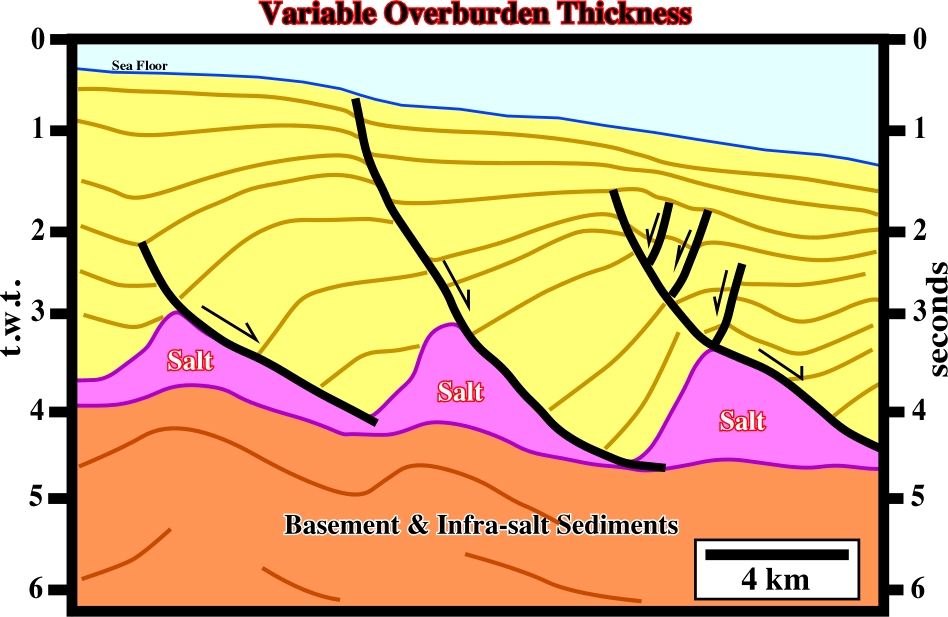
Fig. 46- The differential loading of the overburden had partially caused the salt layer to flow down-dip, where the geostatic and confining pressure are progressively smaller, since the water depth increases.
2.5.3- Change of Density of the Overburden
A lateral density or facies change of the overburden can also induce salt flowage. In the South Atlantic margins, during the initial stage of the sea floor spreading, shelf-carbonates and slope shales mainly composed the overburden. Therefore, and independently of the water depth, the change in facies between the shelf and slope environments is a major factor to create a down-dip salt flowage (fig. 47). In spite of the fact that the overburden is often composed by compacted strata (carbonate or sandstone), it must be noted that such rocks are readily fractured by traction (see table III). Compressive and tensile strength of the overburden must be taken into account to better understand the associated salt structures.
(Table III)
Rock………………….………..Compressive Strength……………..……..Tensile Strength
Basalt 3100/3200 kgf/cm2 200 kgf/cm2
Sandstone 500/600 kgf/cm2 20/30 kgf/cm2
Limestone 200/300 kgf/cm2 15/20 kgf/cm2
Dolomite 800 kgf/cm2 20 kgf/cm2
As a limestone or a dolomite capping a salt layer, is easily broken under traction (20/30 kgf/cm2), a small positive anomaly on the top of the salt can break the overburden.
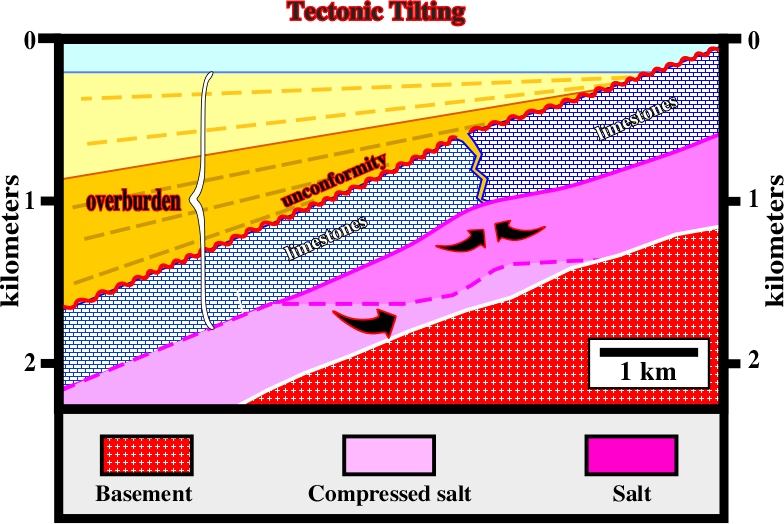
Physically speaking, a tectonic tilting of the salt, as illustrated in fig. 49, is equivalent to a thickness variation of the pre-tilting overburden.
When the top of the salt layer has a tectonic dip, the salt moves in a direction, which depends on the average density of the overburden:
When the average density of the overburden is lesser than that of the salt, the salt moves down-dip (fig. 50).
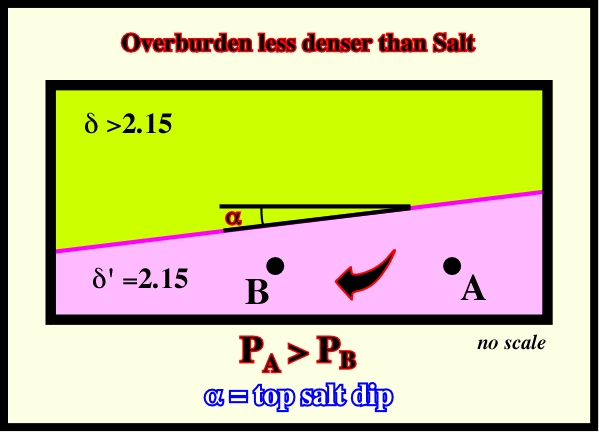
Fig. 50- When the overburden is less dense than the salt, the salt moves down-dip, indeed ![]() g at A is higher that
g at A is higher that ![]() g at B.
g at B.
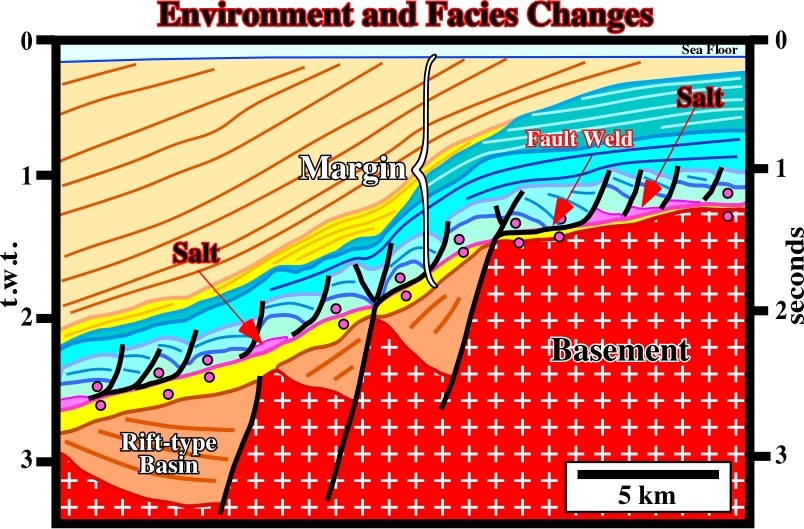
Fig. 51- The down-dip salt flowage, recognized on this line, is mainly due to the seaward tilting of the margin and to the fact the overburden is, in average, less dense than the salt. In addition, as shown previously (fig. 47), the environment and facies changes have also contributed to the salt movement, which locally, created an important compensatory subsidence (see thickness variation in bleu interval).
(ii) Overburden denser than the salt
When the average density of the overburden is greater than the density of the salt, the salt moves up-dip (fig. 52). For an overburden thicker than 1 /1.5 km, the average density is higher than 2.15, thereby the salt tends to flow up-dip. Nevertheless, as generally, salt movements are initiated under much less thick overburden, the salts flows down-dip.
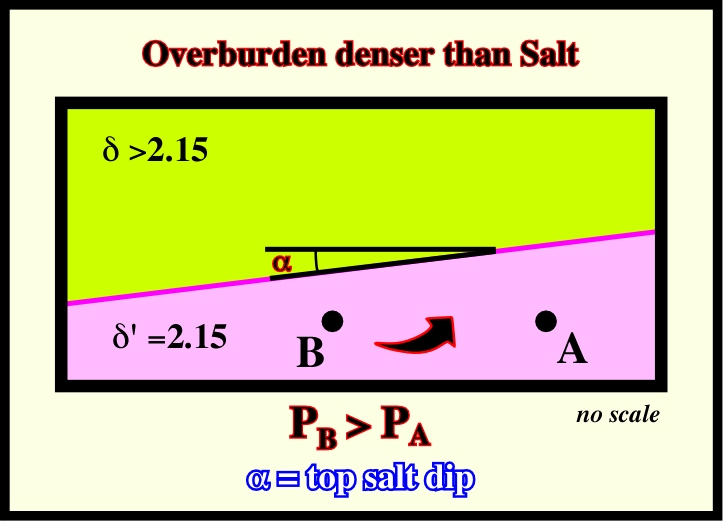
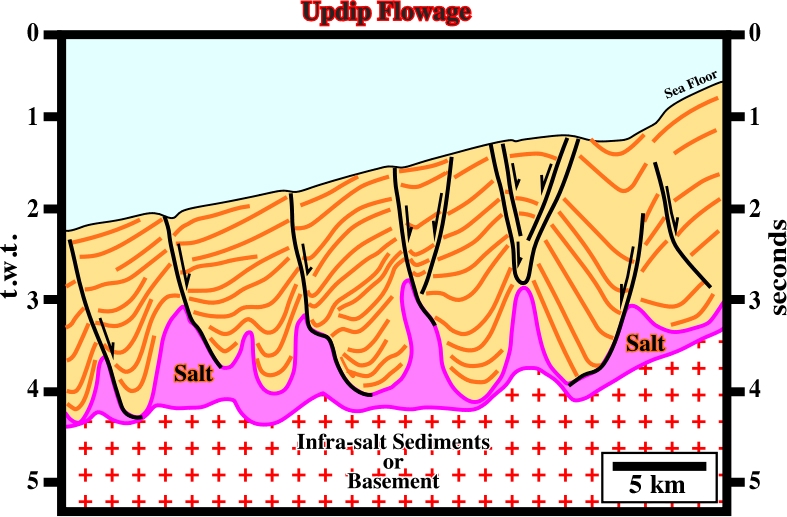
Fig. 53- The landward dipping faults suggest a local up-dip movement of the salt layer. The lower section of the overburden must be denser than the salt. Therefore, a limestone facies is likely. On the other hand, the divergent internal configuration of the lower part of the overburden implies that it is coeval with the salt flowage.
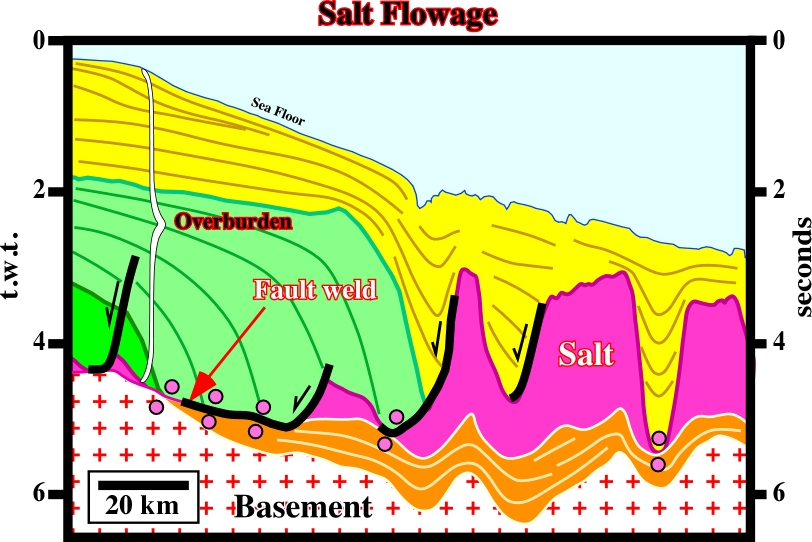
Fig. 54- In spite of the fact that the growth faults, recognized on this line, dip landward, as in the fig. 53, in this particular case, it is difficult to hypothesize an up-dip salt flowage. Indeed, it is likely that the sedimentary loading obliged the salt to move seaward, that is to say, down-dip, creating successive salt ridges, which favor the development of depocenters thinning landward . Notice the growth faults limiting the salt ridges and the amplitude of the welding on the left part of the line.
to continue press
next
![]()
Send E-mails to ccramez@compuserve.com or cramez@ufp.pt with questions or comments about these notes.
Copyright © 2001 CCramez
Last modification:
Março 19, 2006