Porto, Portugal
3- Growth of Salt Domes (cont.)
3.7- Geological Model of a Salt Dome (without significant overburden extension)
Trusheim’s model was advanced to explain salt structures observed in Central Graben (North Sea). In this model there is no significant extension of the overburden (fig. 79). The salt flows mainly by density contrast and differential pressure.
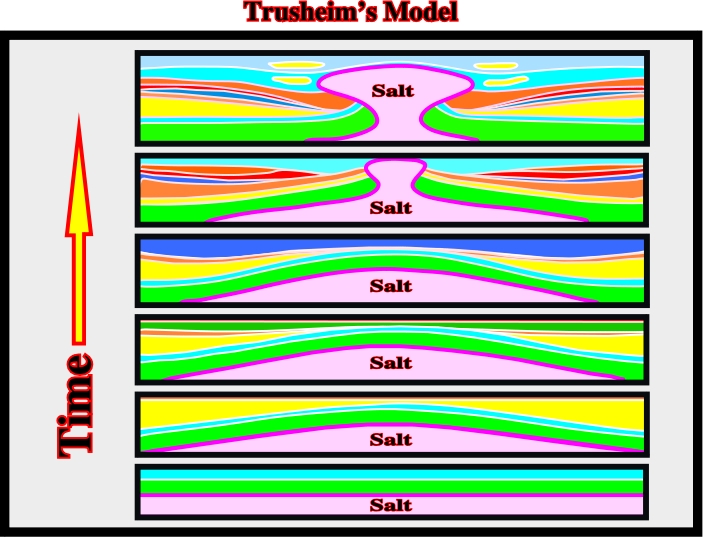
In Trusheim’s model, three main geological stages can be recognized:
a) Mound Stage: the salt flowage creates a salt mound.
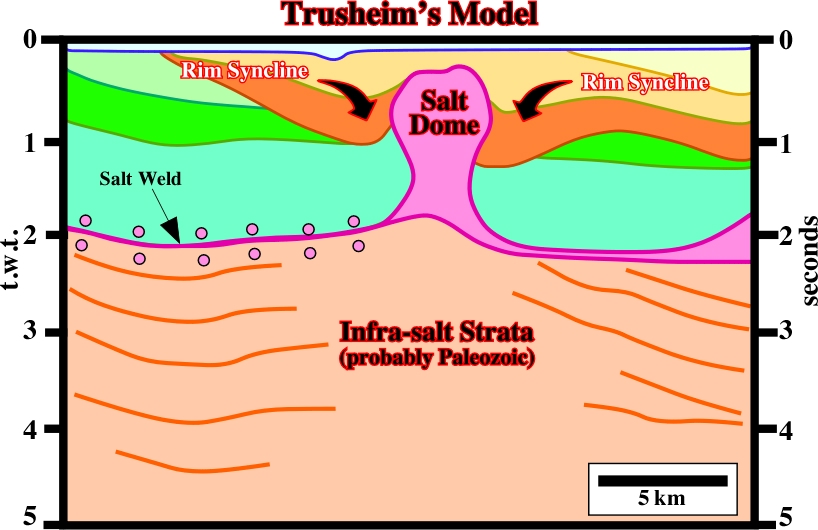
b) Salt Dome Stage; the upward salt flowage creates a salt dome and adjacent rim synclines (overburden depocenters).
c) Post-Dome Stage; the upper part of the salt dome flows laterally creating an overhang, enhancing the turtle-back structures.
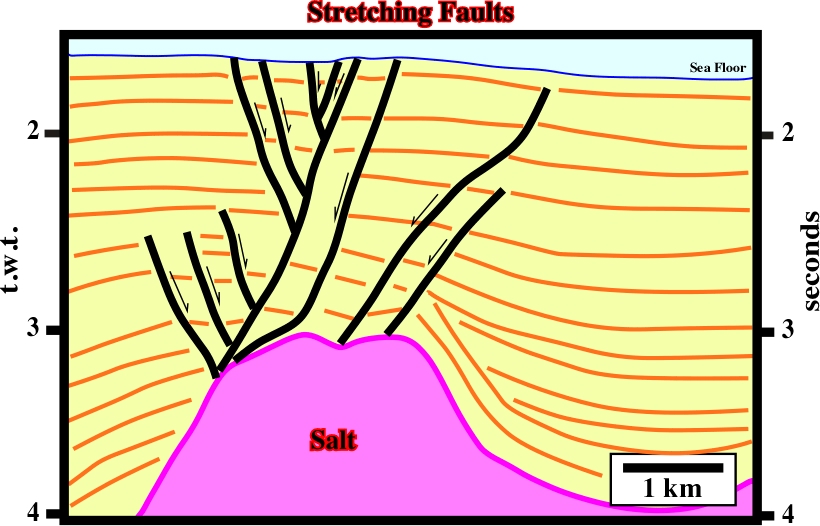
The seismic lines illustrated in the next figures are examples of salt structures, which can easily be explained by the Trusheim’s model. Indeed, the tectonic disharmony, at the bottom of the salt layer, as well as prekinematic and synkinematic sedimentary intervals of the overburden are recognized without difficulty. Rim synclines are located around the salt structures, where the compensatory subsidence is higher, within the synkinematic overburden intervals.
3.8- Geological Model of a Salt Dome (with significant overburden extension)
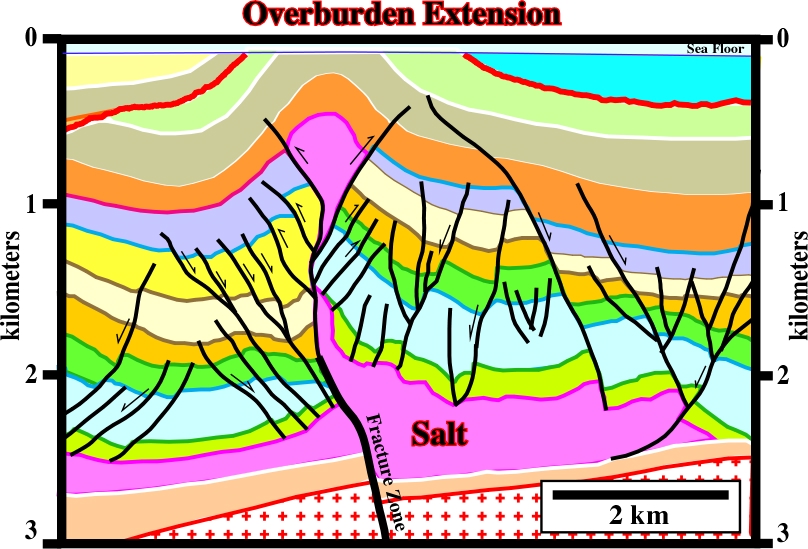
In this model, proposed by Vendeville and Jackson (1992), salt domes are developed in association with a lengthening of the overburden, thereby, one cannot speak in halokinesis but in salt tectonics, since a significant tectonic stress is taken into account, as illustrated below (fig. 82).
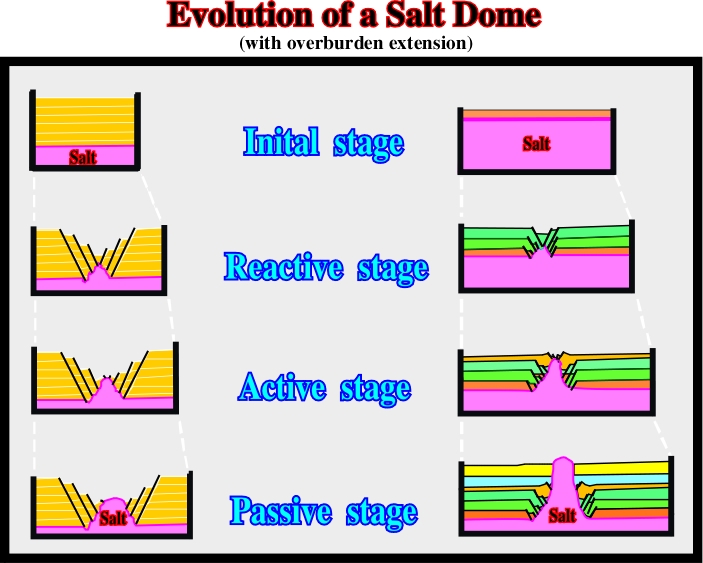
Fig. 82- Geological model proposed to explain some diapiric salt structures when the overburden and the salt mother layer are lengthened by an extensional tectonic regime (
1 vertical).
This geological model explains a lot of salt structures observed in the South Atlantic margins particularly in the offshore Angola. The authors considered three main evolutionary stages:
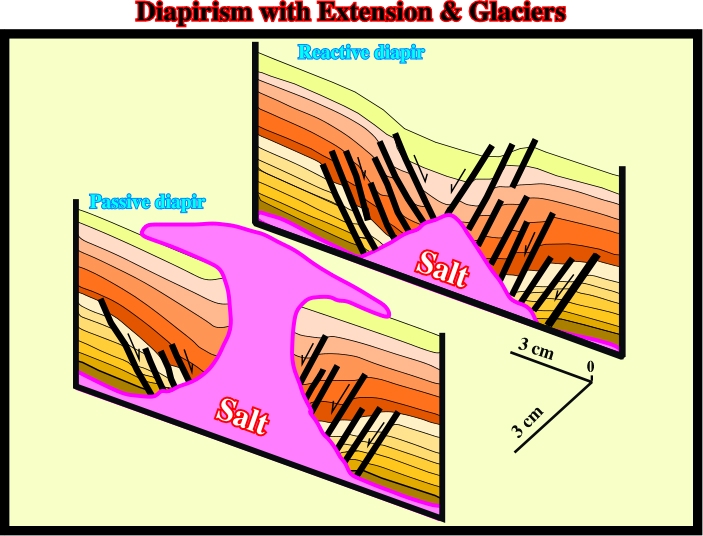
(i) Reactive Stage
The overburden is extended (normal faulting). Small anomalies at the top of the salt can locally extend the overburden by normal faulting.
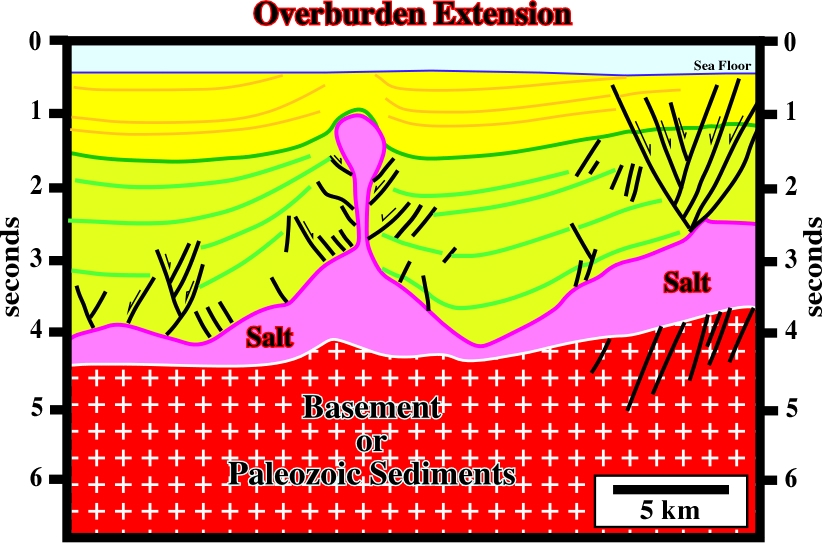
(ii) Active Stage
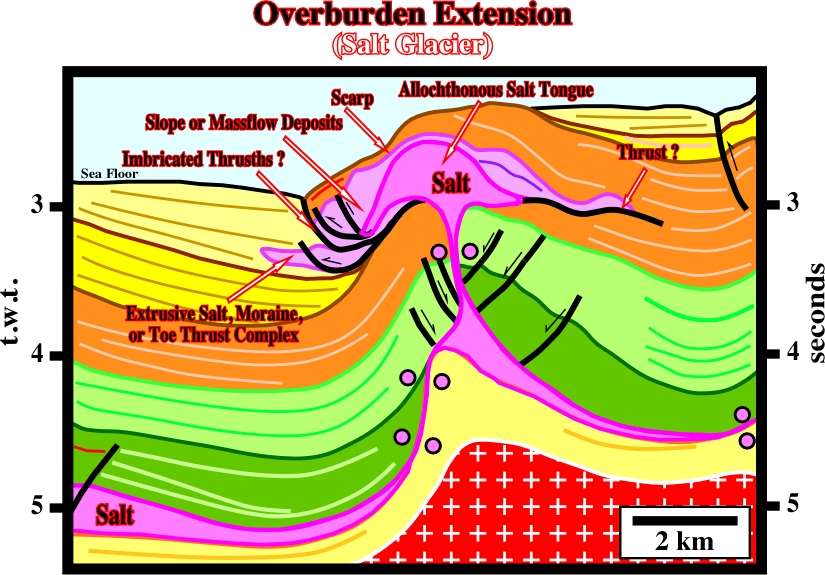
The salt flows upward and arrives at the surface (or sea floor).
(iii) Passive Stage
This passive stage creates apparent diapirism. The salt does not deform the sediments of the overburden. Salt flows upward as sedimentation progresses on the condition that the salt dome is connected with the mother layer.
Salt movements induce local extensional tectonic regimes in the overburden characterized by ![]() 1 vertical. According to the Mohr’s theory, the sediments are lengthened by normal-faults striking parallel to
1 vertical. According to the Mohr’s theory, the sediments are lengthened by normal-faults striking parallel to ![]() 2, , as illustrated in Currie’s model (fig. 87). Salt movements induce local extensional tectonic regimes in the overburden characterized by
2, , as illustrated in Currie’s model (fig. 87). Salt movements induce local extensional tectonic regimes in the overburden characterized by ![]() 1 vertical. According to the Mohr’s theory, the sediments are lengthened by normal-faults striking parallel to
1 vertical. According to the Mohr’s theory, the sediments are lengthened by normal-faults striking parallel to ![]() 2, as illustrated in Currie’s model (fig. 87).
2, as illustrated in Currie’s model (fig. 87).
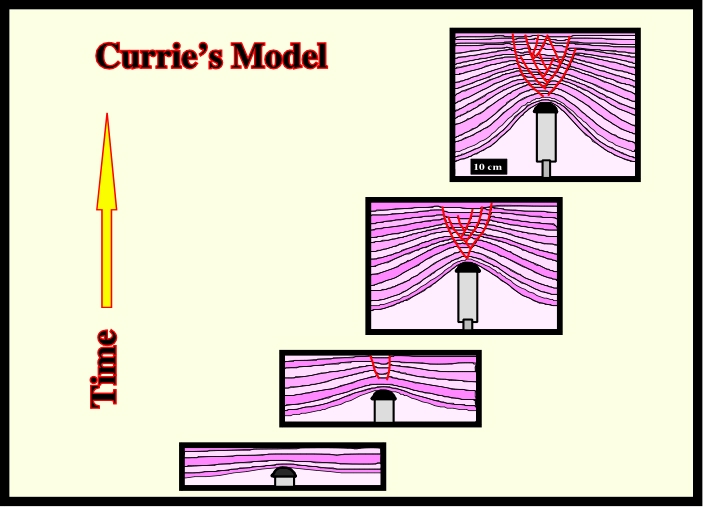
Fig. 87- In Currie’s experiment, the extension produced by the normal faulting is higher than the apparent shortening produced by the piston uplift. In addition, the westward fault displacements are balanced by the eastward displacements. In other words, the sum of the positive (right vergence) and the negative (left vergence) throws is zero.
Depending on the shape of the salt, the ellipsoid of effective stresses can be triaxial or biaxial:
a) When the ellipsoid is triaxial,
b) When the ellipsoid is biaxial,
In salt basins, these two geological situations are mainly associated with salt walls and salt circular diapirs, which, by definition, have different geometrical sections. The first have an elongate geometry, while the latter have a circular geometry.
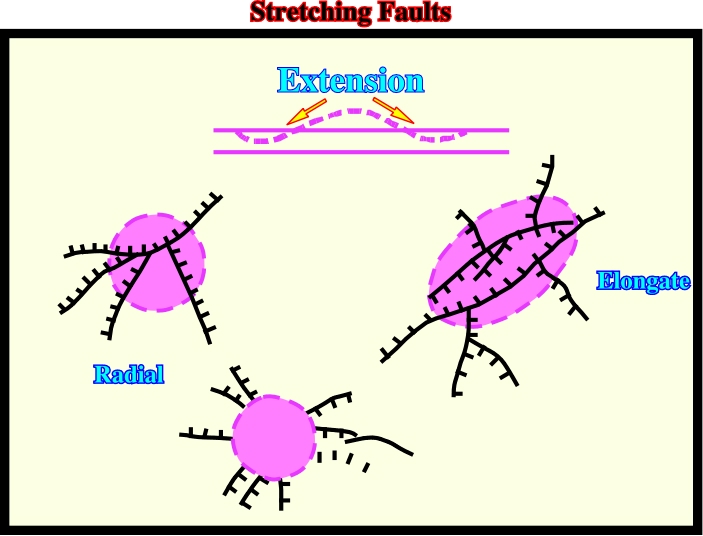
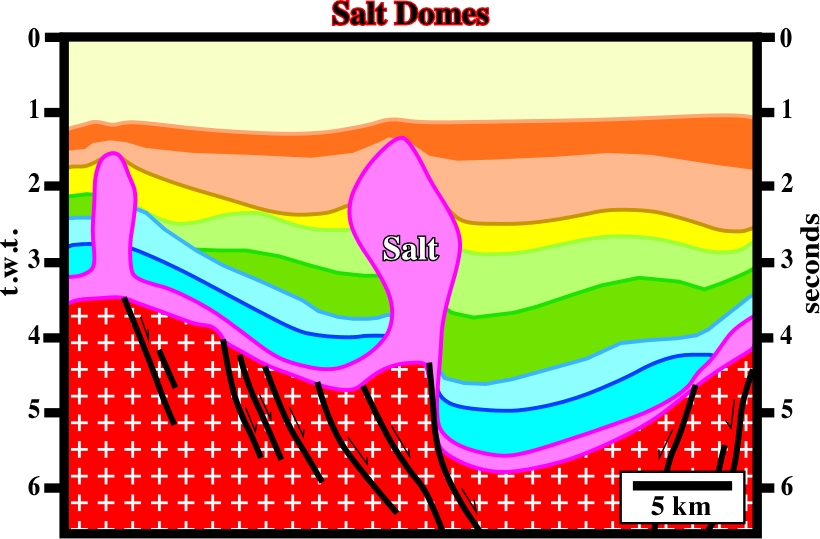
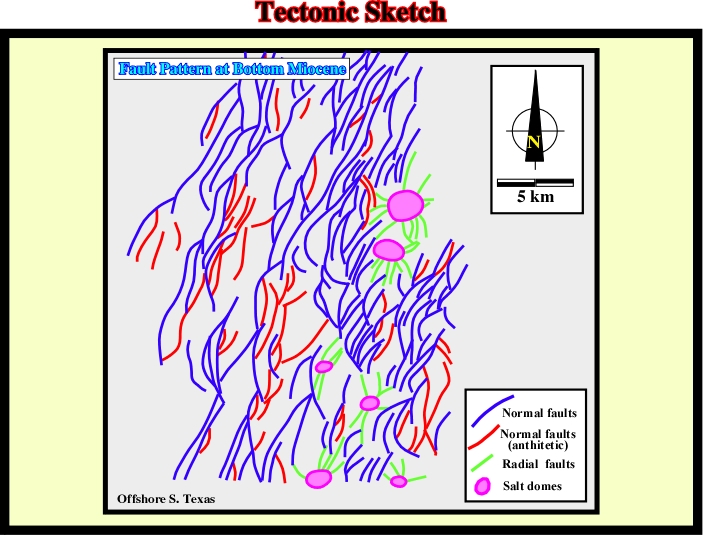
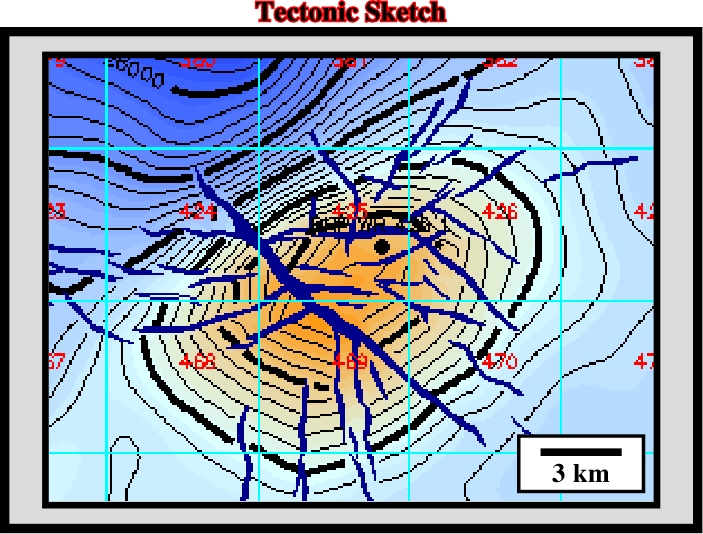
Fig. 89- In this tectonic sketch, from the conventional offshore Angola, not far from Luanda, the salt bodies correspond to elongated salt walls. The associated normal faults strike parallel to the regional
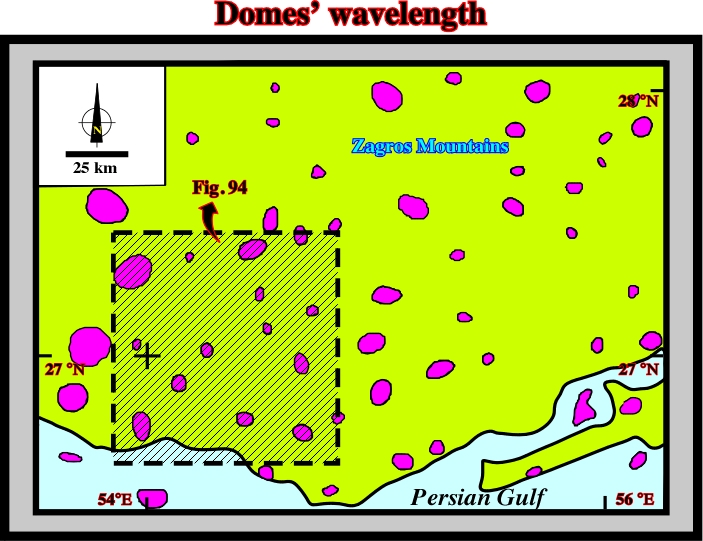
3.10- Dome Perturbation Wavelength
Taking a look to the aerial photo (fig. 94) and the map illustrated in fig. 95, where are located the principal salt domes of the Zagros Mountains, and adjacent Persian Gulf, it is easily to recognize the distance between the salt domes is more or less constant.
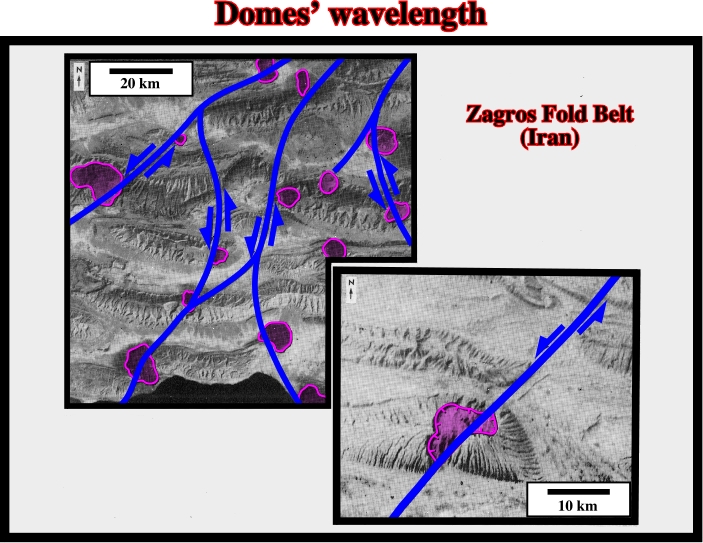
Such a hypothesis begs two questions: (i) Is that a simple coincidence? and (ii) Is the salt dome distribution controlled by some physical principle?
The answer to these question was given by Goguel (1983), when he hypothesize that two domes can be formed, without any interference, only when they are fed by salt located within the double’s radius (fig. 96). The Goguel’s hypothesis is the application in Geology of the Rayleigh-Taylor instability in compressible Newtonian fluids, which can be summarized as follows: The Rayleigh-Taylor instability is an inherent instability in a layer of viscous fluid of uniform density overlying a compositionally less dense layer. Small perturbations in the horizontal interface become amplified at a rate represented by an eigenvalue Special value of a variable parameter, for which the solution of an equation is nontrivial) that depends on the thickness, density, and viscosity of every layer, size of initial perturbation, and time elapse.
The Rayleigh-Taylor instability physical principle points out:
a) When two Newtonian fluids, with different densities, are superposed and the denser is on the top, with time, the lighter will change to the top. (at room temperature and pressure, a rock clearly reacts to stress very different from a material such as water. If a stress is applied to a fluid, it begins to flow. When the stress is removed, the flow stops, but the fluid does not return to its undeformed configuration, and the deformation is said to be non-recoverable. The larger the applied stress, the faster the fluid flows, which suggests a relationship between the stress and the strain rate. This type of behavior is most simply idealized as a linearly viscous, or Newtonian, constitutive equation, and the appropriate one-dimensional equation for constant-volume deformation relates the normal deviatory stress D
b) The beginning of such an inversion starts with the development of small positive equidistant anomalies on the surface of the lighter fluid.
c) The equidistance between the anomalies is the double of the radius of each anomaly, which is function of:
(i) The density contrast between the fluids.
(ii) The height of the denser fluid.
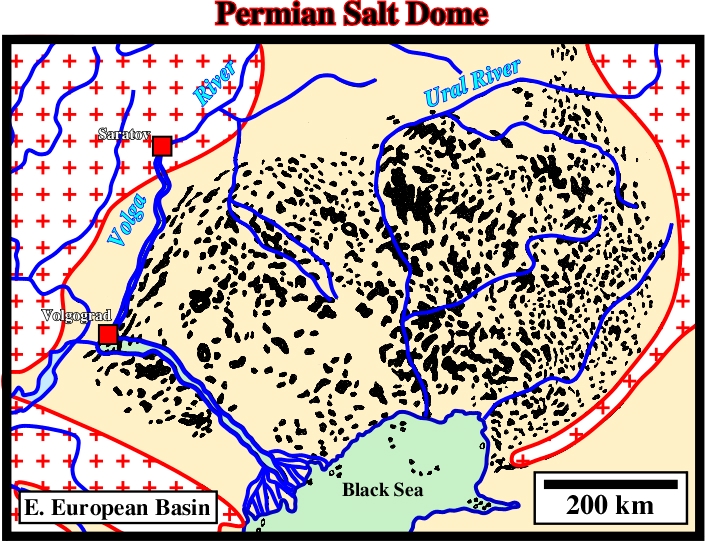
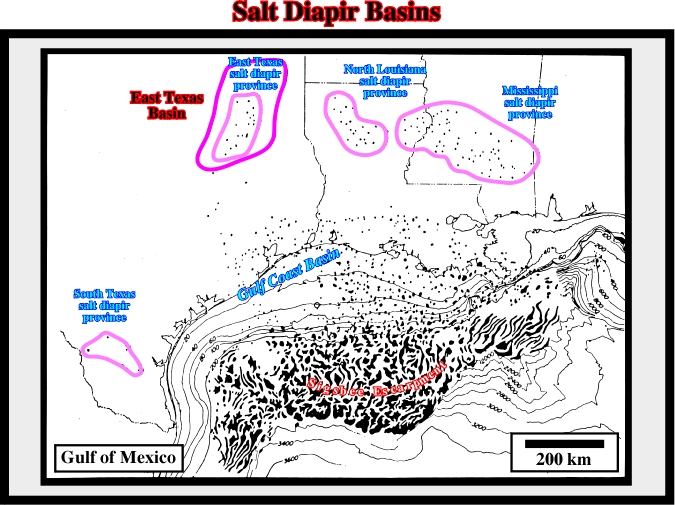
Therefore, in salt basins, and particularly on the flat areas of these basins, the distribution of the salt domes seems to obey the Rayleigh-Taylor instability, as suggested in certain areas of the offshore Gabon (fig 97), in the Permian Eastern European Salt Basin (fig. 98) and in certain areas of the Gulf of Mexico (fig. 99).
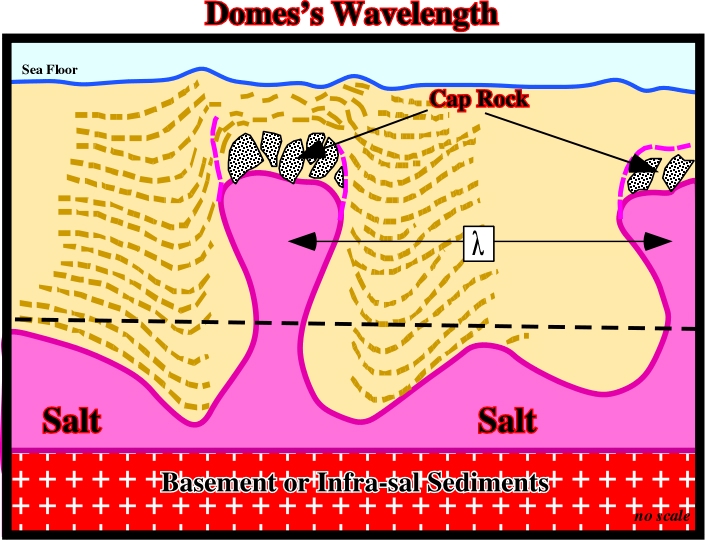
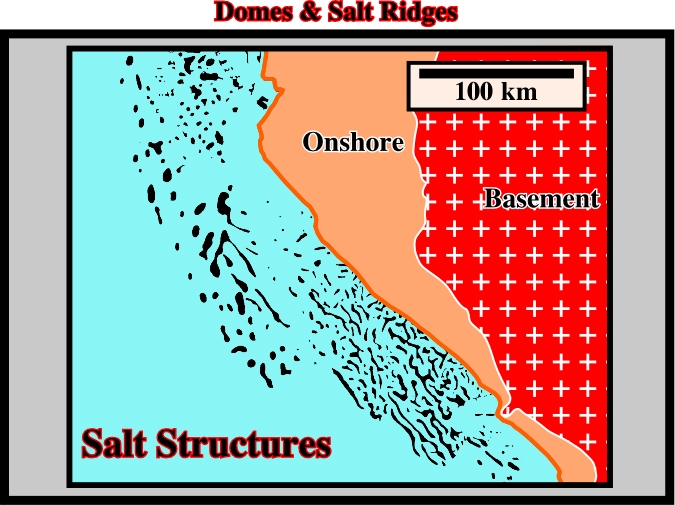
Fig. 97- The mapping of the salt structures in the offshore Gabon suggests that only locally the Rayleigh-Taylor instability can be invoked to explain the salt dome distribution (northern part of the map). The majority of the salt structures have a linear geometry (salt ridges), which strongly suggests an extensional tectonic regime with
The implications of the domes’ wavelength in petroleum exploration are quite important, particularly on the trapping hydrocarbon parameter. Indeed, the examples illustrated in next figures, clearly indicates that “Theory precedes Observation”, that is to say, that the knowledge of the Rayleigh-Taylor instability allows seismic interpreters to propose more consistent and less refutable geological interpretations (by definition a geological hypothesis must be refutable. The best geological hypothesis is the more difficult to refute. There is not such thing as a true geological hypothesis or theory).
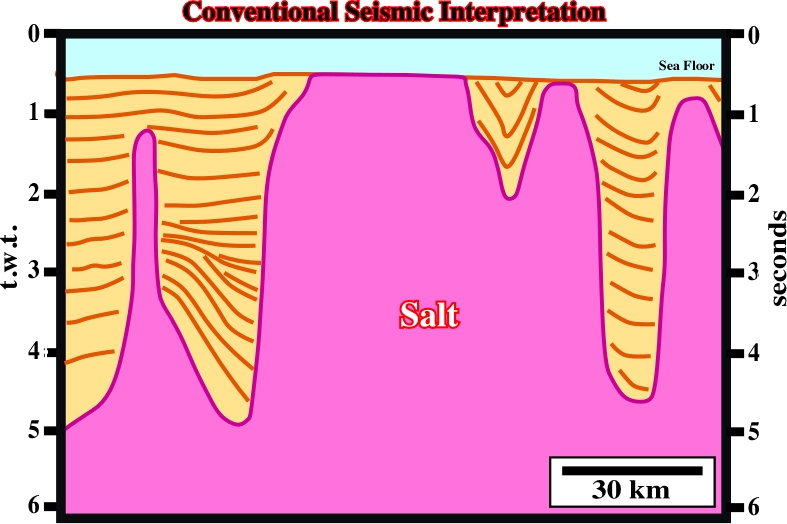
Fig. 100- In Nordkap Basin, several years ago, this kind of conventional inductive interpretation was paramount. The majority of the oil companies stopped the HC exploration in the area, invoking a lack of significant structural traps. Seismic interpreters proposed so huge salt domes that they became potential targets for storage of HC or radioactive waste. At that time, interpreters ignored the Rayleigh-Taylor instability principle and the basic principles of salt tectonics. (see fig. 101).
In fact, several years ago, the hydrocarbon potential of the Nordkap basin (offshore North Norway) was considered as very weak. Such petroleum hypothesis was advanced on the basis of the absence of traps, particular structural traps with significant closed surfaces. The other hydrocarbon parameters were neglected. Indeed, taking into account the geographic location of the Nordkap basin, the killer hydrocarbon parameter was considered to be the size of the potential hydrocarbon accumulations. So, the search for petroleum traps was made on a wide seismic grid by seismic interpreters unknowing the geological setting of the area. The surprise came, when younger interpreters, with a good geological and physical background, took a quick look at few regional seismic lines of the area:
a) They recognized a lot of huge morphological traps by juxtaposition.
b) Their geological interpretations of the seismic lines, and particularly the pick of the limits of the salt, were completely different of those proposed previously, as illustrated in fig. 101
Actually, the conventional interpretations, as the one shown in fig. 100, which do not take into account the Rayleigh-Taylor instability, imply:
(i) A thickness of the salt domes (plus mother salt layer) higher than 15-20 km, which is much higher than the total thickness of the sedimentary basin.
(ii) An absence of evident trapping mechanism.
The alternative-interpretations proposed by explorationists having a good geological knowledge of the area and knowing the meaning of (i) the second law of the thermodynamics (Goguel’s law) and (ii) the Rayleigh-Taylor instability, is illustrated bellow (fig. 101).
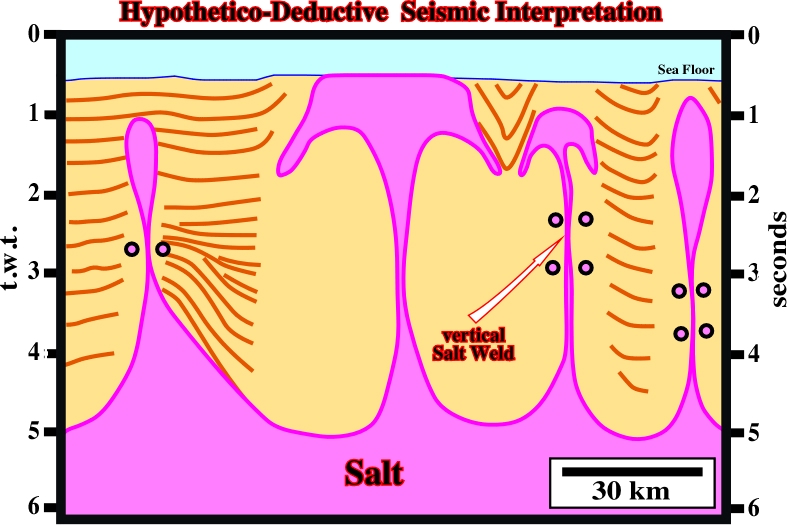
Such an interpretation indicates that the majority of the diapiric structures are not in a dome stage (see later), but in a post-dome stage. They show well developed overhangs. Indeed:
- They are not cylindrical.
- Their stem has a relative small radius.
- They are roughly equidistant.
- Some of them are, or can be, completely disconnect of the mother salt layer.
On the other hand, this kind of interpretation suggests the possibility of huge morphological traps by juxtaposition under and against the salt of the overhang. Thus, at the hydrocarbon stand point, may be the Nordkap basin has no potential at all, but the killer parameter is not the trapping, but eventually the absence of a generating petroleum sub-system.
to continue press
next
![]()
Send E-mails to ccramez@compuserve.com or cramez@ufp.pt with questions or comments about these notes.
Copyright © 2001 CCramez
Last modification:
Março 19, 2006