

12) Velocity Lateral Changes
Seismic lines are bad copies of geological reality. Tentative geological interpretations of seismic lines are far from showing the geological reality: they have a time vertical scale and a lot of lateral velocity changes inducing a lot of pitfalls.
Since current data processing and interpretation yield seismic sections resembling geologic cross-sections, inexperienced geoscientists are, often, greatly tempted to read geology, more or less, directly from the seismic data. Unfortunately, serious errors may result in such approach. This is especially true in areas with irregular surfaces, complex weathering, complex tectonics (high dips), rapid changes in lithology (density and velocity), sharp changes in water depth, etc.
In onshore, the recorded reflection times on seismic traces, have to be corrected for the time differences introduced by near-surface irregularities. These irregularities have the effect of shifting reflection events on adjacent traces out of their true time relationships. The two major sources of irregularity are:
(i) Elevation differences between individual shots and detectors and
(ii) Weathered layer, which are heterogeneous surface layers (a few meters to several tens of meters thick) with abnormally low seismic velocities.
Static corrections (a bulk shift of a seismic trace in time during seismic processing) take into account the topography and the weathered-zone. In the case of a sharp topography, as the velocity interval of the sediments is higher than the velocity of the seismic waves in the air, in reference to a horizontal datum, the seismic waves spend more time at the vertical of topographic highs than topographic lows. As generally the weathered zones have a low velocity, it is quite obvious than the interface weathered / non-weathered sediments will be pull-down in the areas where the weathered zones are thicker. The same is true for salt domes or organic build-ups, in which the seismic waves, often, have a high velocity, induce important pull-ups of the horizons associated with their bottoms and below.
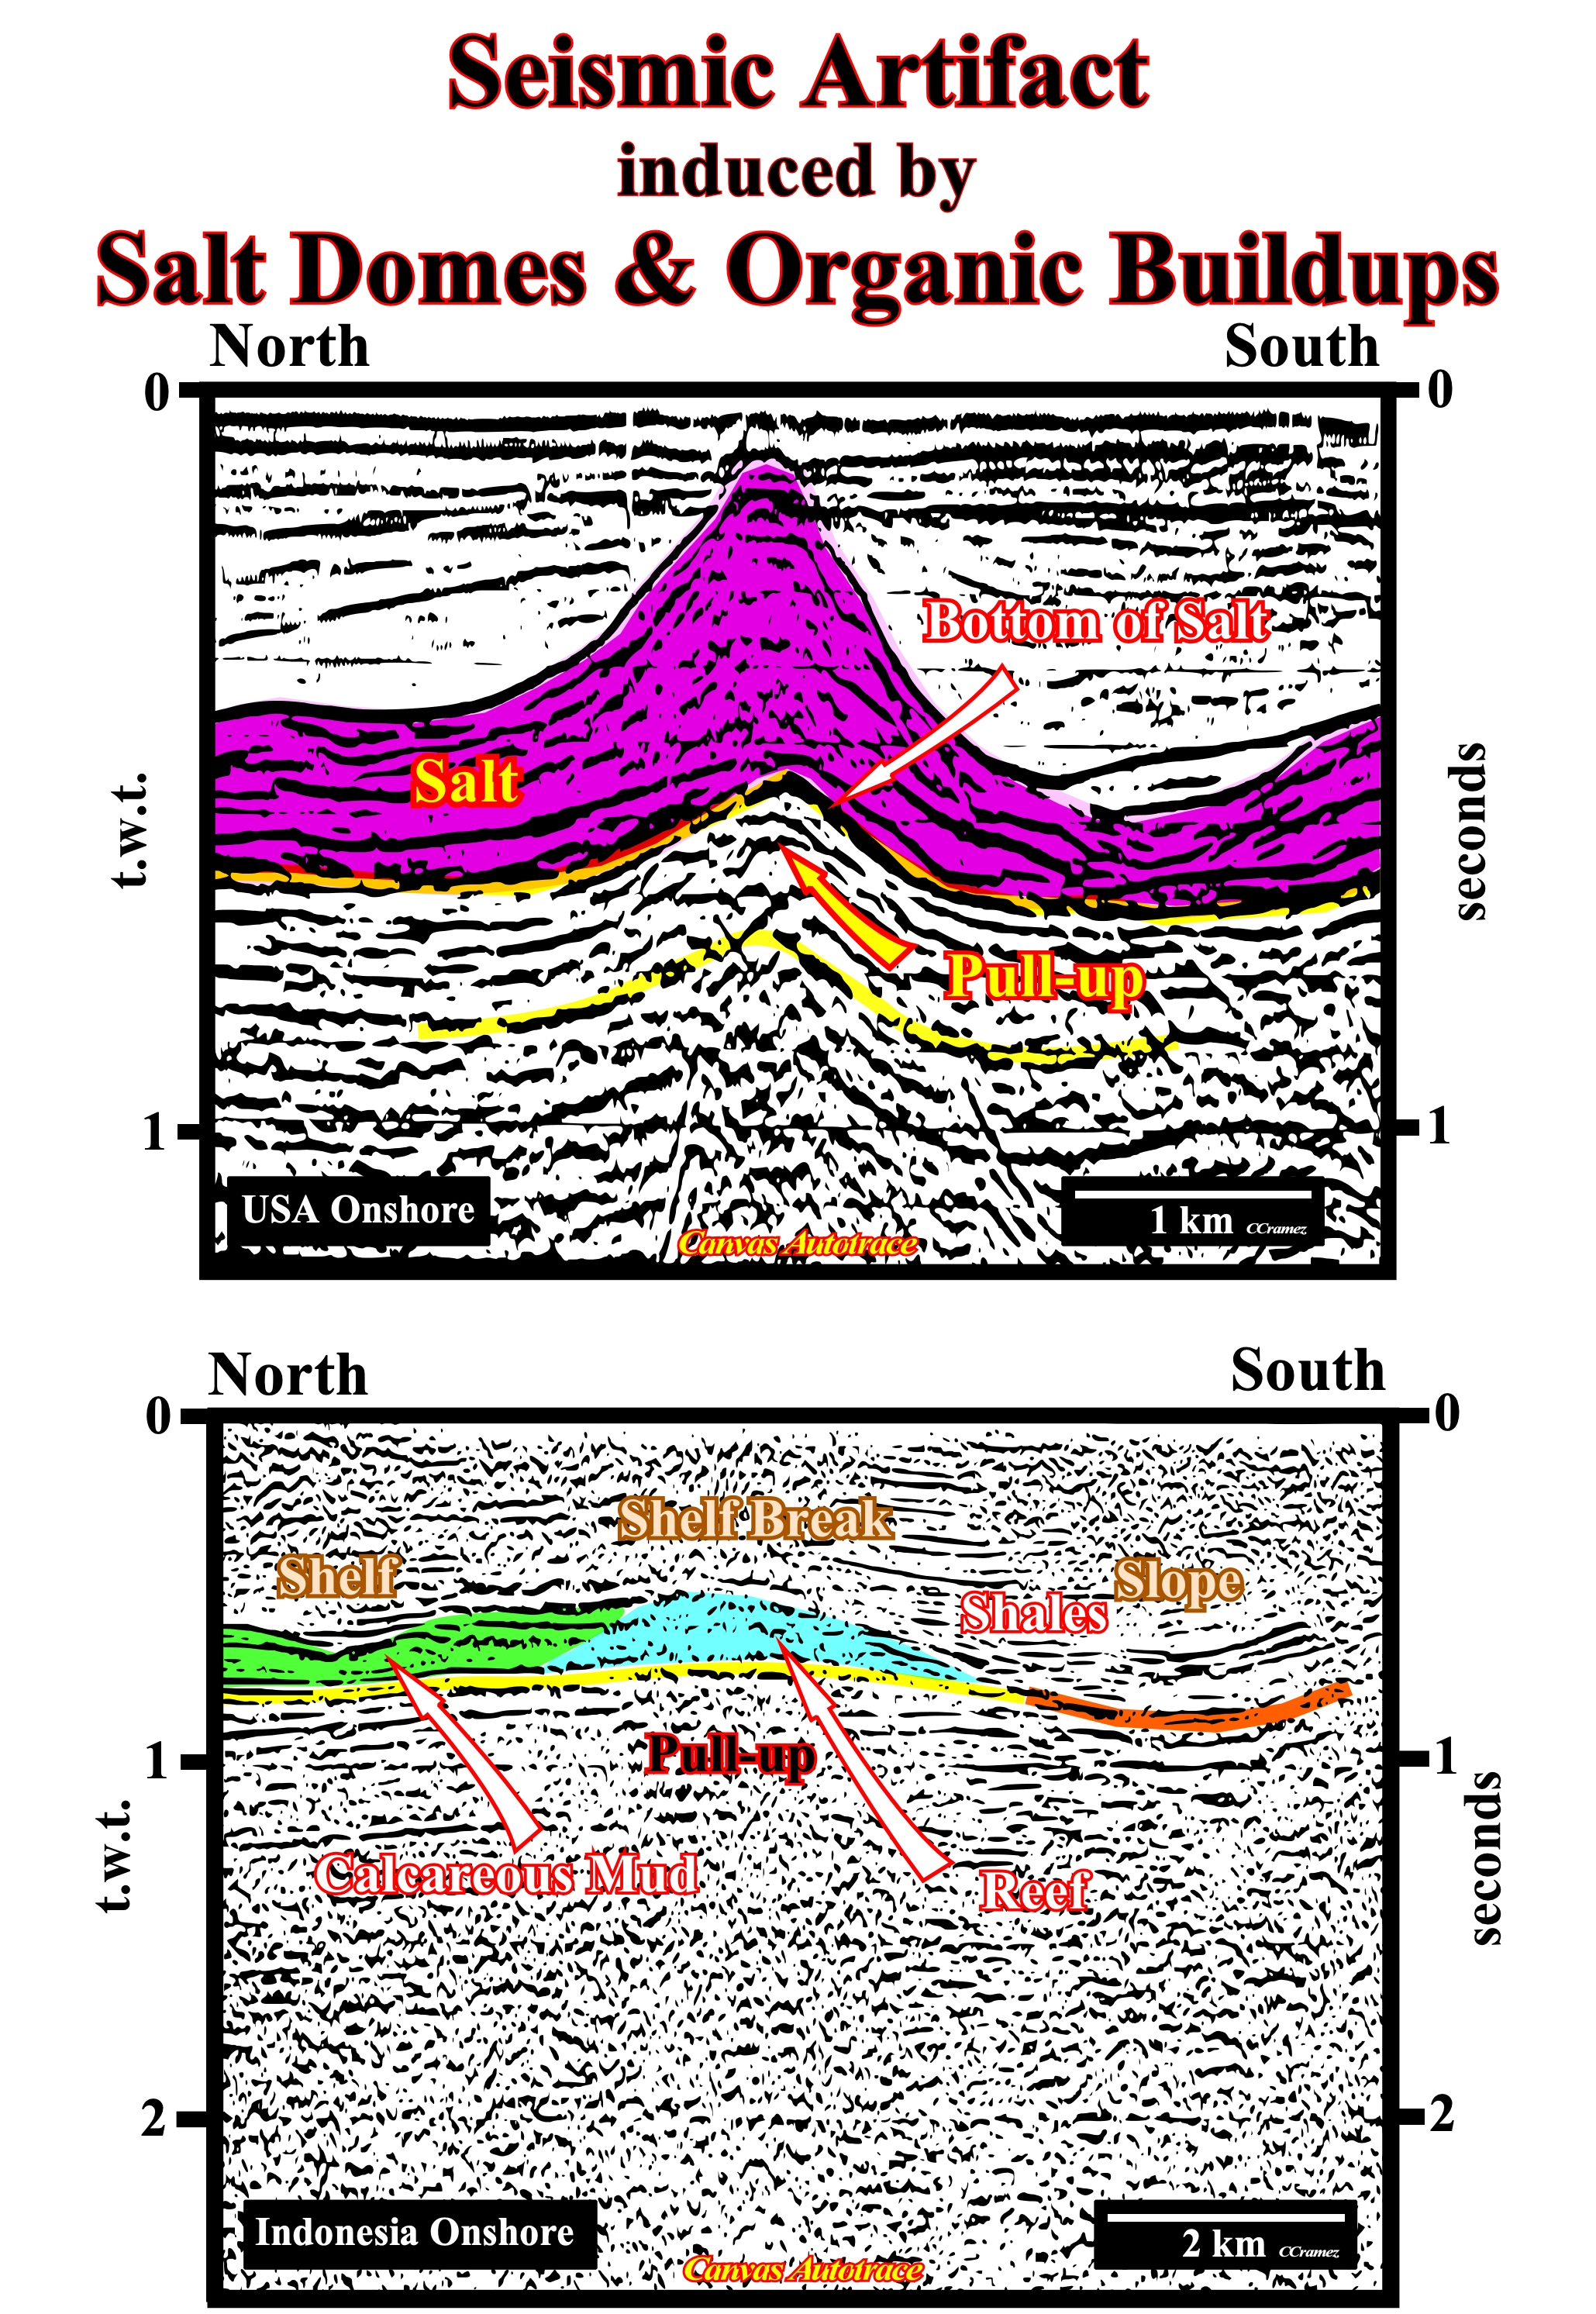
Figure 047 - The upper preliminary tentative geological interpretation of Canvas autotrace of a Louisiana onshore (USA) seismic line illustrates the seismic artifact induced by a non isopachous evaporitic interval. The bottom of the salt layer is pulled-up where the salt interval is thicker. The seismic waves traveling through a thicker high velocity interval (± 5000 m/s) spend less time, so that the base of the salt is pulled-up, i.e., it is higher. Without a corrected time-depth conversion, it is sometimes dangerous to assume, a priori, a flat salt bottom. Indeed, in Angola and Brazil offshore, salt steps are, often, observed in association with major fracture zones and presalt carbonate buildups, which are fossilized by the onlapping of the salt. On the Canvas autotrace illustrated on the bottom of this figure, which comes from an Indonesia onshore seismic line, the shelf break of the upper colored interval seems to emphasize the development of a reef (in blue). The bottom of the shelf limestone is pulled-up. This pullup is enhanced by the pulldown of the reflectors associated with the seaward slope shales (in south). In certain basins, as for instance, in the geographic Michigan basin (USA), the recognition of reefal anomalies is mainly based in the absence of reflectors. In other words, when, in a continuous and high amplitude marker, emphasizing a limestone interval, an abrupt interruption of the reflector occurs, during few kilometers, it may be due to the presence of a local porous reef.
In offshore, the changes in water depth induce a typical seismic artifact, particularly on the distal parts of the seismic lines of continental platforms and upper continental slope, where, often, submarine canyons are, often, carved by turbiditic currents (induced by relative sea level falls).
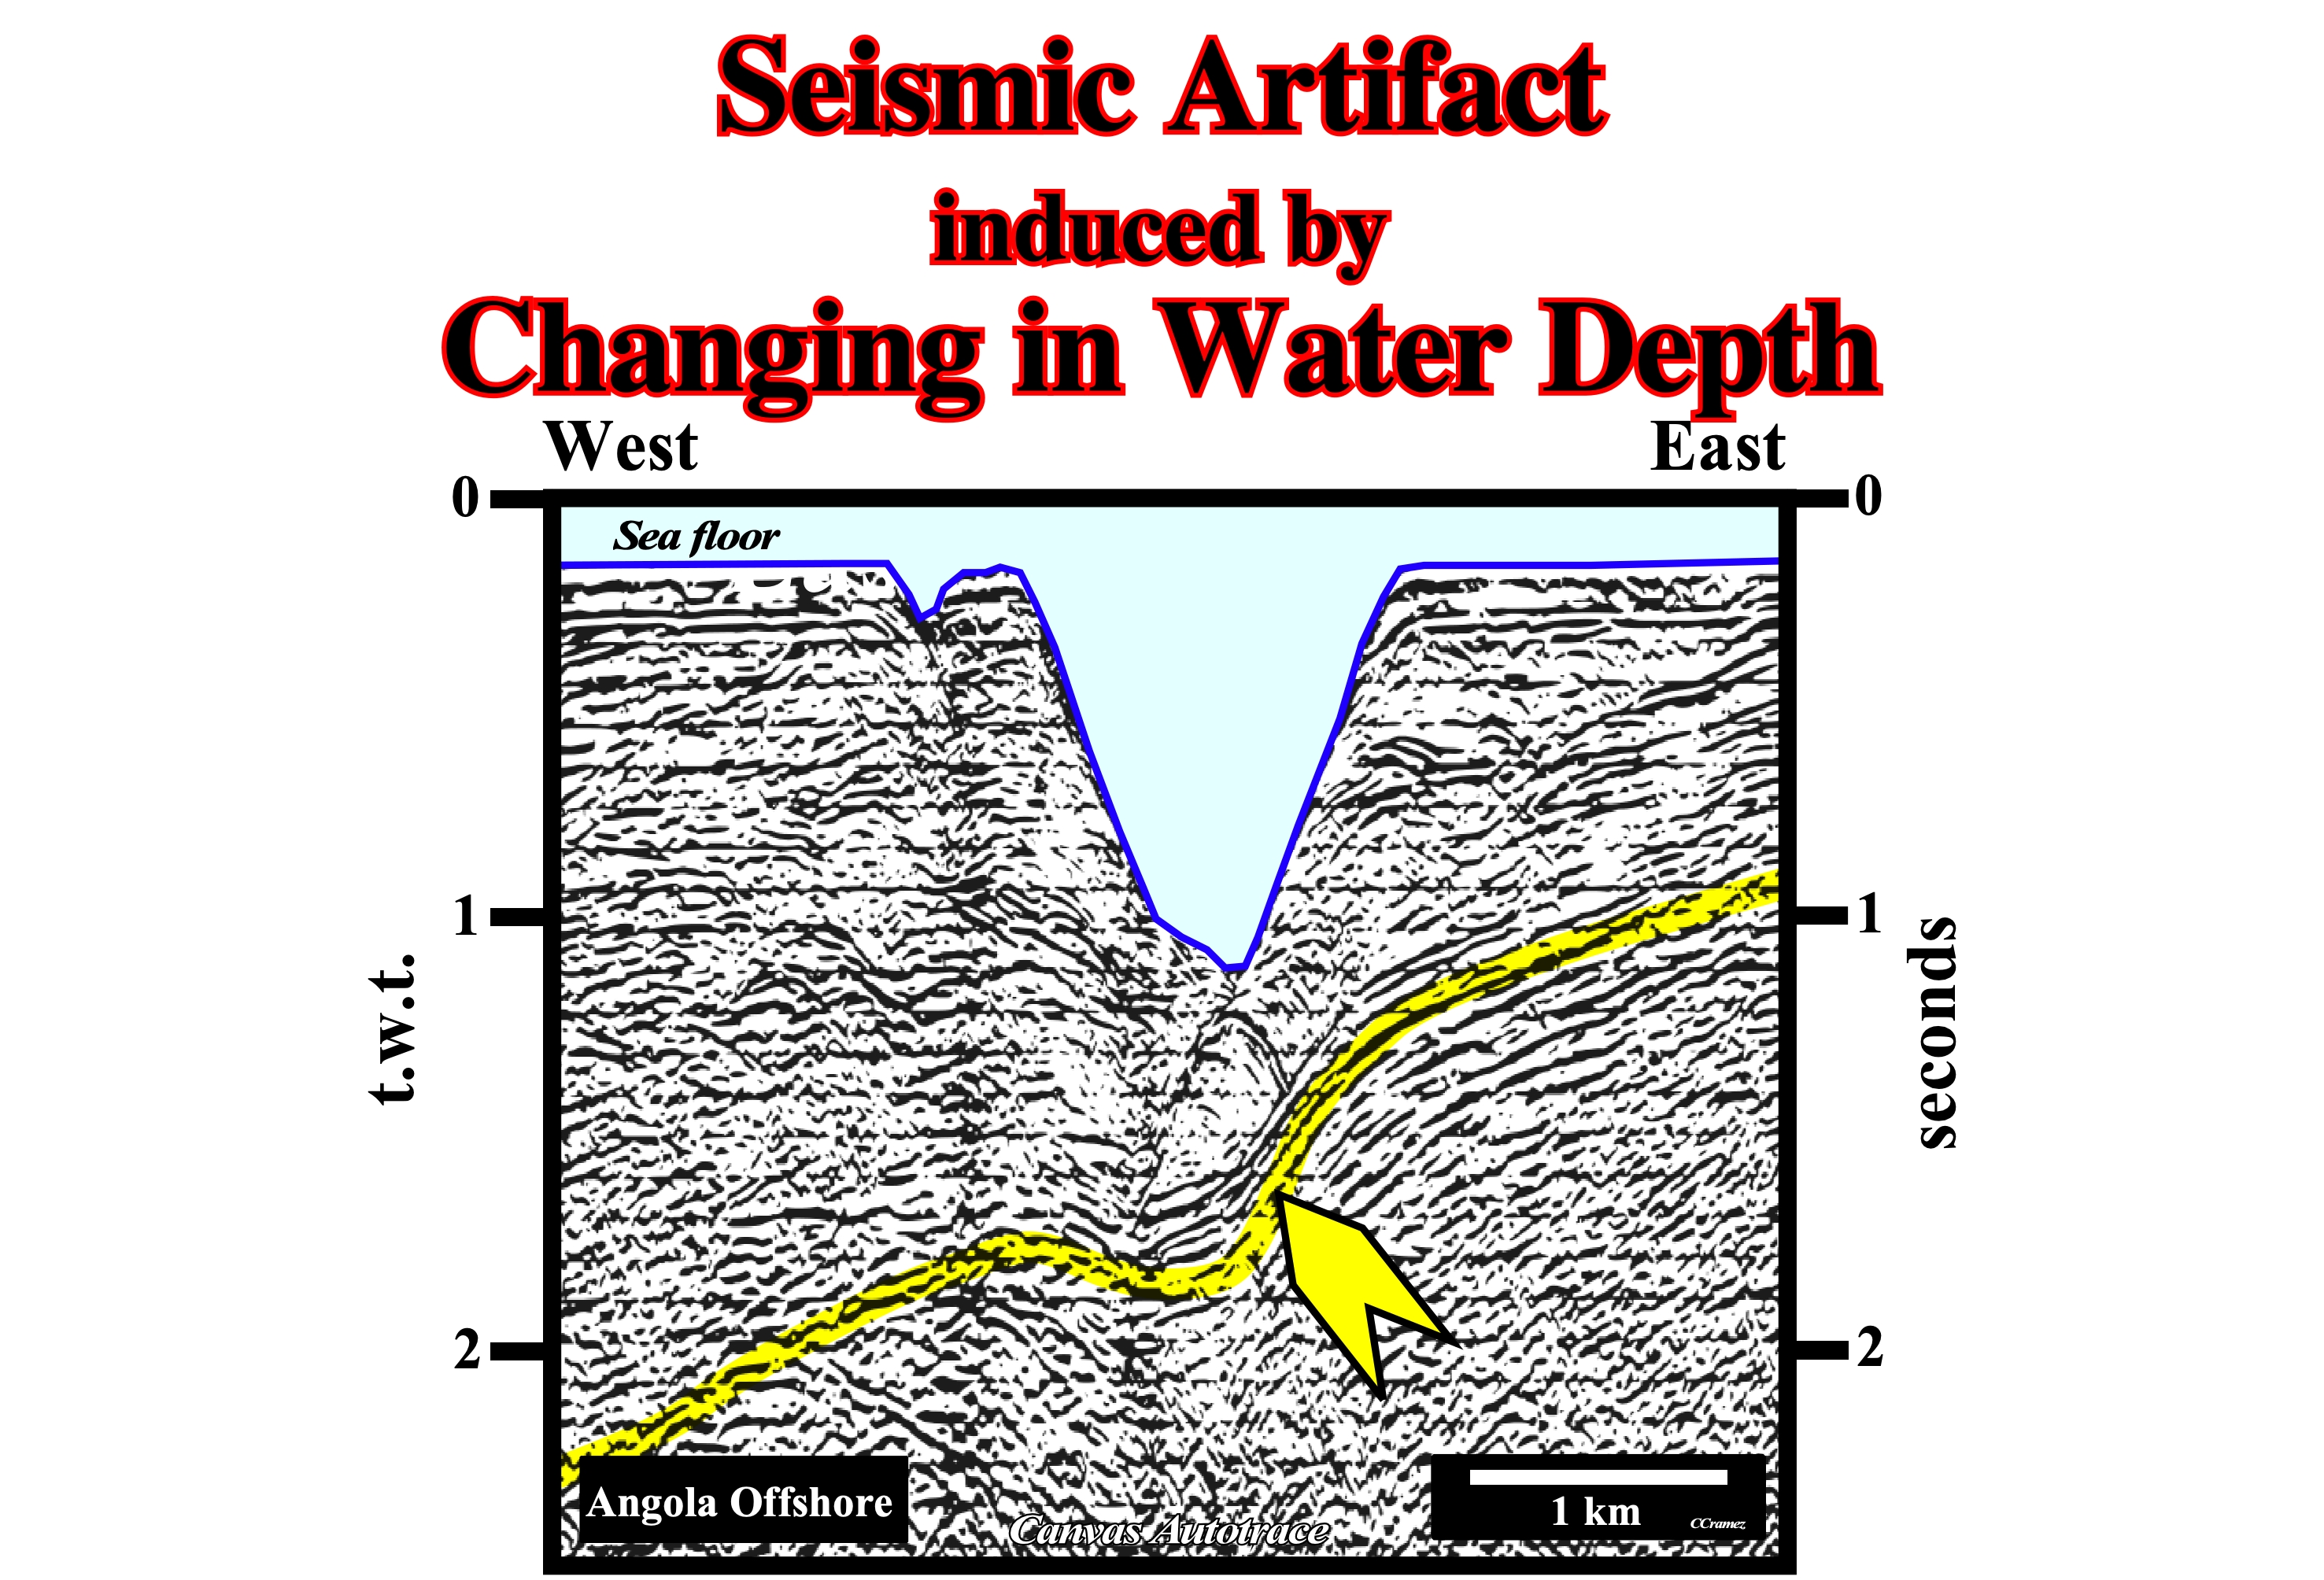
Figure 048 - On this Canvas autotrace of a seismic line shot in the northern Angola offshore, nearby the mouth of the Congo River, the water-depth variation induces local pull-down of reflectors. In fact, the seismic waves travel slower through water than through sediments. The pull-down of the reflectors directly below the submarine Congo canyon is, here, obvious. Pull-downs do not have any geological meaning (in terms of geometry). In a depth section, the yellow reflectors keep the regional seaward dip recognized all along the profile, which can be even calculated in this small line. Notice that such a seaward dipping is, mainly, the result of the Late Tertiary uplift of the eastern part of the margin.
Sharp change in water depth, such as illustrated in figure 049, induces lateral variations of the velocity interval (sediments - water). Consequently, the seismic waves are, progressively, retarded in deeper water and the time trajectory will be longer. Hence, the associated reflections are, gradually, pulled-down seaward.
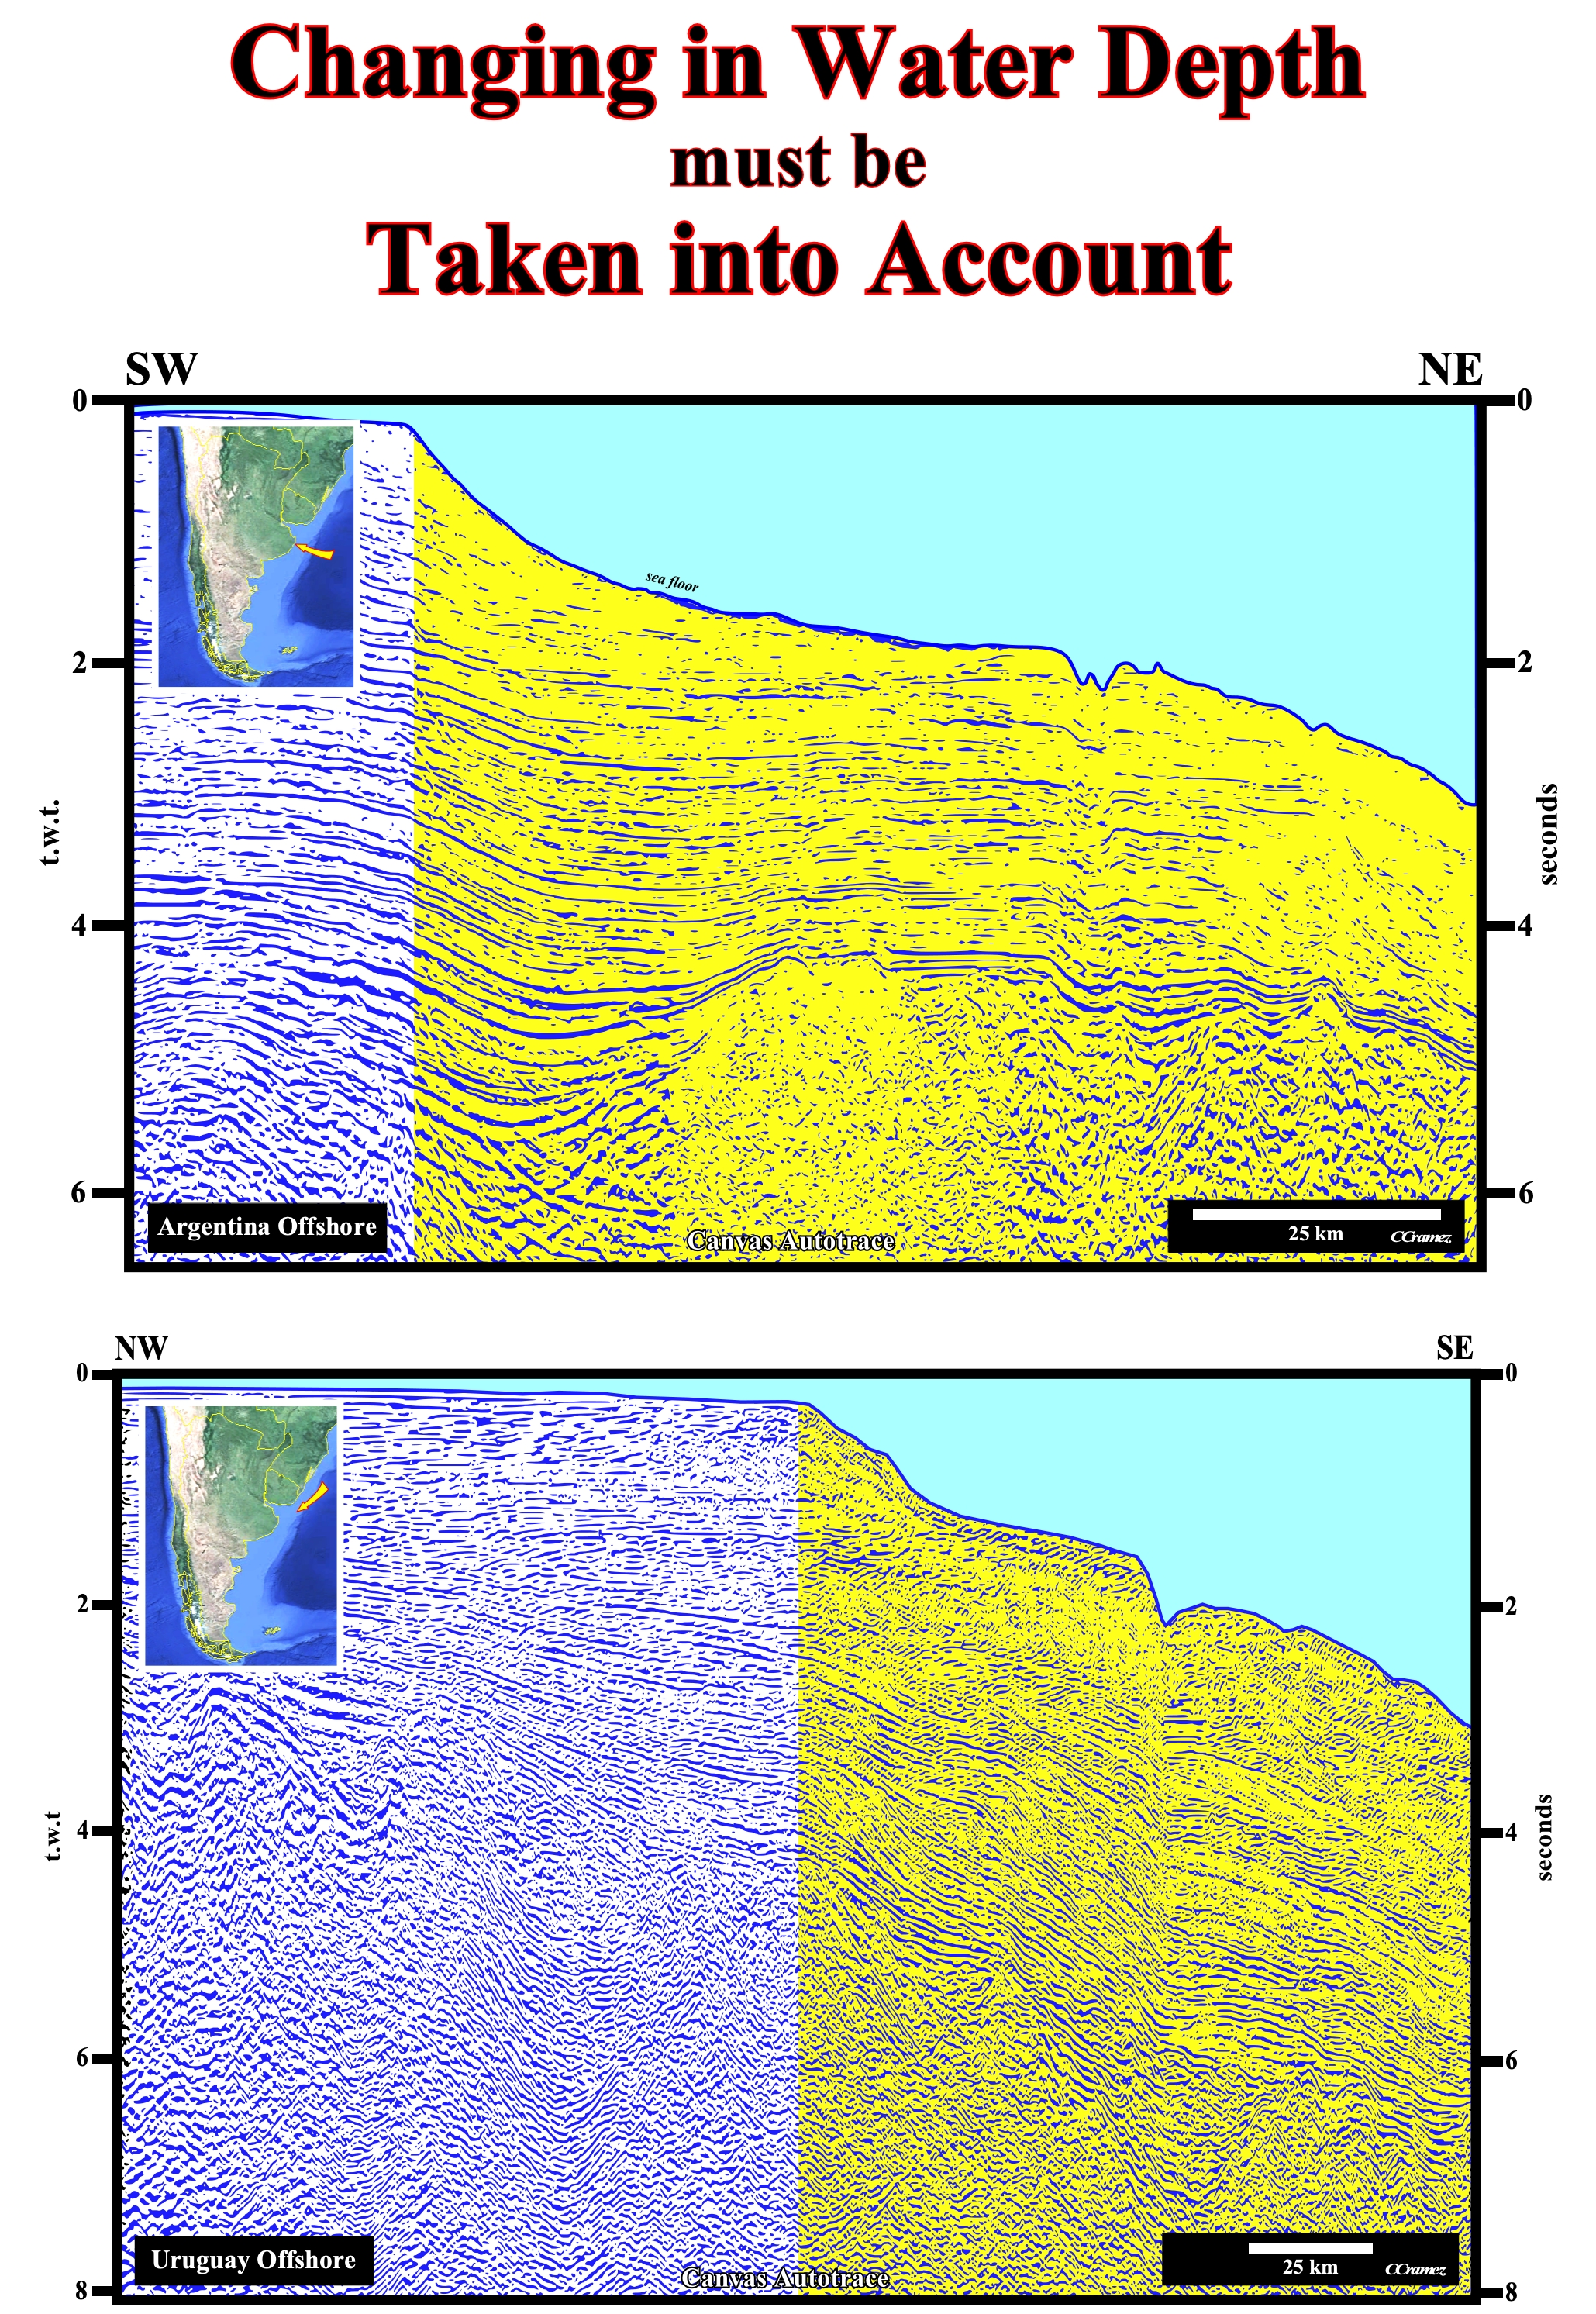
Figure 049- On these Canvas autotraces from southern-eastern South America offshore seismic lines, it is evident, the geoscientists in charge of the tentative geological interpretation must take into account the sudden change in water depth, induced by the abrupt passage from the shelf to the continental slope and the continuous seaward dipping of the continental slope. Local variations of the water-depth induced by submarine valleys and canyons, which are visible in both seismic lines, must also be taken into account on the tentative interpretations. The seismic artifacts (mistaken perception of a seismic observation caused by an error in analysis or interpretation rather than by some inherent property of the observed) induced by the submarine valleys and canyons, which are local and visible from the sea floor to the bottom of the lines, are easier to recognize than those associated to the continuous dipping increasing of the continental slope. On the above autotraces, seaward of the shelf break, geoscientists must, at least, in a mental manner, calculate the bottom of sea floor in depth, knowing that the velocity of the seismic waves in the water is, around, 1.4-1.5 km s-1, while in a sandstone it ranges between 1.4-4.3 km s-1, in a limestone between 5.9-6.1 km s-1 and 5.5-6.0 km s-1 in a granite. They can, also, take half of the water depth, at the eastern end of the lines, and trace a regional depth till the shelf break. Even with all these under-reckonings, it is quite obvious that in depth, the dip of the seismic reflectors, in the yellow area, will be much smaller if not inverted, which change, completely, the geometry of the potential traps and the migration paths of the generated hydrocarbons.
In fact, of all the categories of seismic pitfalls, the most elementary but, also, the most important is the one related to velocities, since the majority of the seismic lines are, still, presented in double travel time and to construct consistent depth sections, it is, sine-qua-non, to have a precise and detailed knowledge of interval velocities. The geoscientists plays a very vital role in estimating an accurate velocity field for transforming the seismic times to depth. Needless to say that if a small discrepancy of the order of 10 m in the depth estimation of reservoir-rock can make a tremendous pecuniary impact (of the order of millions of dollars) on the economical aspect of a prospect, guess what happens when geoscientists forget to take into account the water depth variations, as illustrated in the example below (figure 050).
This example comes from the western Palawan offshore (Philippines), where, in the 70’s, several oil companies explored the conventional offshore (water depth less than 200 m). It can be summarized as follows :
(i) An exploration well was supposed to test the hydrocarbon potential of a structural high ;
(ii) The structural high was identified on unmigrated seismic lines ;
(iii) The original seismic line, where the well was located, is illustrated in the upper part of figure 050 by a Canvas autotrace;
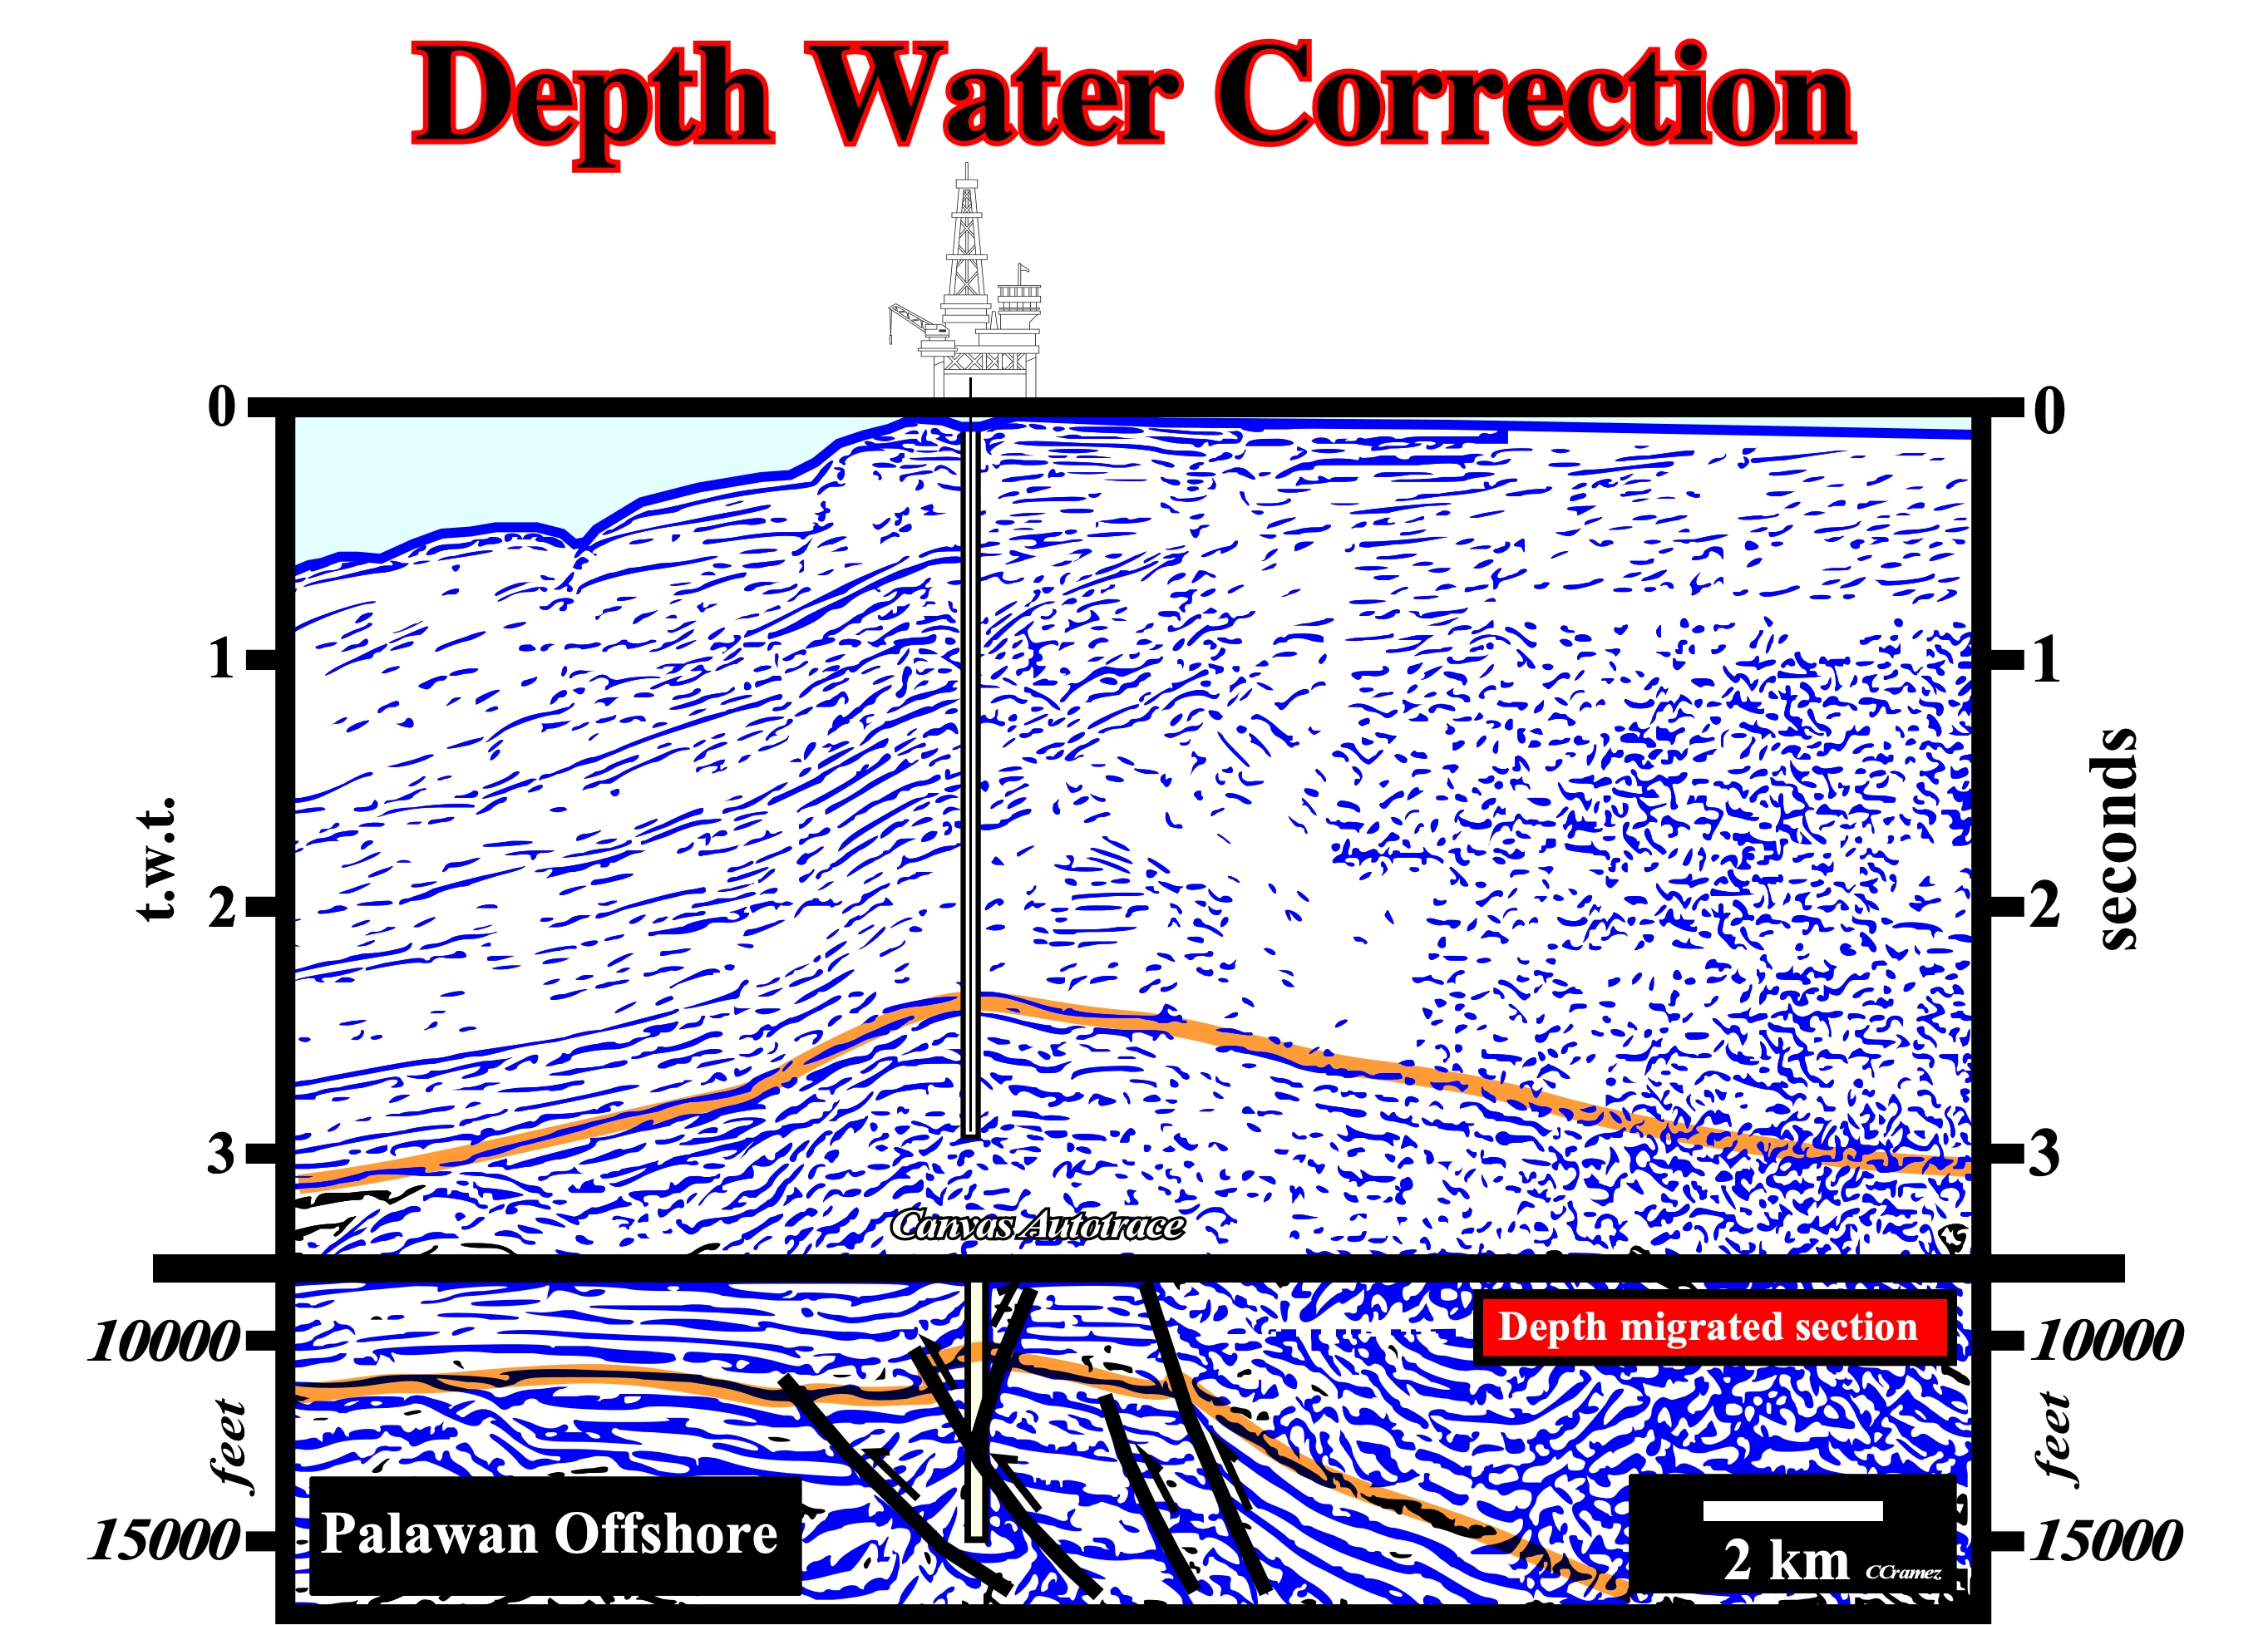
Figure 050- In the upper part, is illustrated a Canvas autotrace of an unmigrated time version of the seismic line, where an exploratory well was drilled. In the lower part, is shown the Canvas autotrace of a post-drilling depth migrated version at the level of the potential reservoir interval. The depth version, strongly, suggested the time-structural high corresponds to a seismic artifact and not to a real antiform structure (extensional structure created by lengthening of the sediments and not by shortening). In other words, the drilled prospect was not a structural trap, but a morphological trap by juxtaposition. The geoscientists in charge of the evaluation of such a lead (trap which may contain hydrocarbons) not only forgot that the western Palawan offshore is located within the Meso-Cenozoic megasuture, i.e., located in a compressional geological setting, but also they did not take into account that the abrupt increasing in the water-depth induces a significant pull-down of the seismic horizons located below the present shelf break (limit between the continental platform and continental slope).
(iv) On the seismic line (in time), the structural high was located directly above the present limit between the continental shelf (less than 200 m water depth) and the upper slope environment, i.e., above an abrupt change in the water depth (bathymetry) ;
(v) The structural high was interpreted as a potential reef anomaly located nearby a shelf break (the depositional coastal break is far away landward of the shelf break since the basin, at that time, as today, had a significant continental platform defined between zero and 200 meters of water depth) ;
(vi) The exploratory well was drilled and suspended around 200 m below the apex of the structural high of the potential reservoir-rock (upper part of figure 050).
(vii) The results of the well were negative: no indications of hydrocarbons and no reservoir-rocks were recognized.
(viii) After the negative results of the well, a depth-migration of few seismic lines was performed. A depth-time conversion of the line where the wildcat was located is illustrated in the lower part of figure (the vertical scale is in feet and not in t.w.t.) .
(viii) Comparing the two seismic versions, geoscientists readily understood : The time-structural high corresponds to a seismic artifact induced by the abrupt water-depth and facies change in the sediments overlying the potential reservoir-rock.
In conclusion : When tentatively interpreting a seismic line, in geological terms, geoscientists must take into account that : (i) Generally, they are work with time sections and not with depth sections and (ii) Seismic artifacts should remain after seismic processing or even could be generated by it. If horizontal and vertical subsurface velocities were everywhere constant, a seismic line would be roughly, the image of its underlying geological cross-section. However, under such conditions seismic profiles would show no reflections at all. Fortunately, the real world is different :
- Firstly, ground compaction of stratigraphic layers under their own weight causes velocities to increase, naturally, with depth. The deeper the depth of burial of a geological level the faster is the velocity of propagation of the acoustic waves through it. Hence, seismic time-sections are progressively squashed from top to bottom.
- Secondly, seismic velocities are, also, depend on horizontal and vertical varying lithology. These variations are superimposed on the normal vertical distortion due to compaction. The only way to approach a geological cross-section is to convert time-sections into depth-sections at natural scale (1:1). This implies a good understanding of the local velocity field and, the use of an iterative velocity model (as for depth migration).