

14) Angular Unconformities, Subcrops & Paleogeographic Maps
An angular unconformity is just a tectonically enhanced cryptic unconformity, i.e., an erosional surfaces induced by a relative sea level fall. Hydrocarbons traps associated with angular unconformities are independent of the mapping of the unconformity. They are defined by the maps of the reservoir-rock, sealing-rock and hydrocarbon migration paths.
Angular unconformities are erosional surfaces induced by significant relative level falls that were, locally, enhanced by the tectonics. In sequential stratigraphy, geoscientists call them tectonically enhanced unconformities to better emphasis the role of the relative sea level changes. Laterally, all tectonically enhanced unconformities change to cryptic unconformities (unconformities induced by eustasy). In fact, the unconformities are just, recognized, easily, in the distal parts of the continental platform, near the shelf break, where the evidence of erosion (submarine canyons and incised valleys) is, often, present.
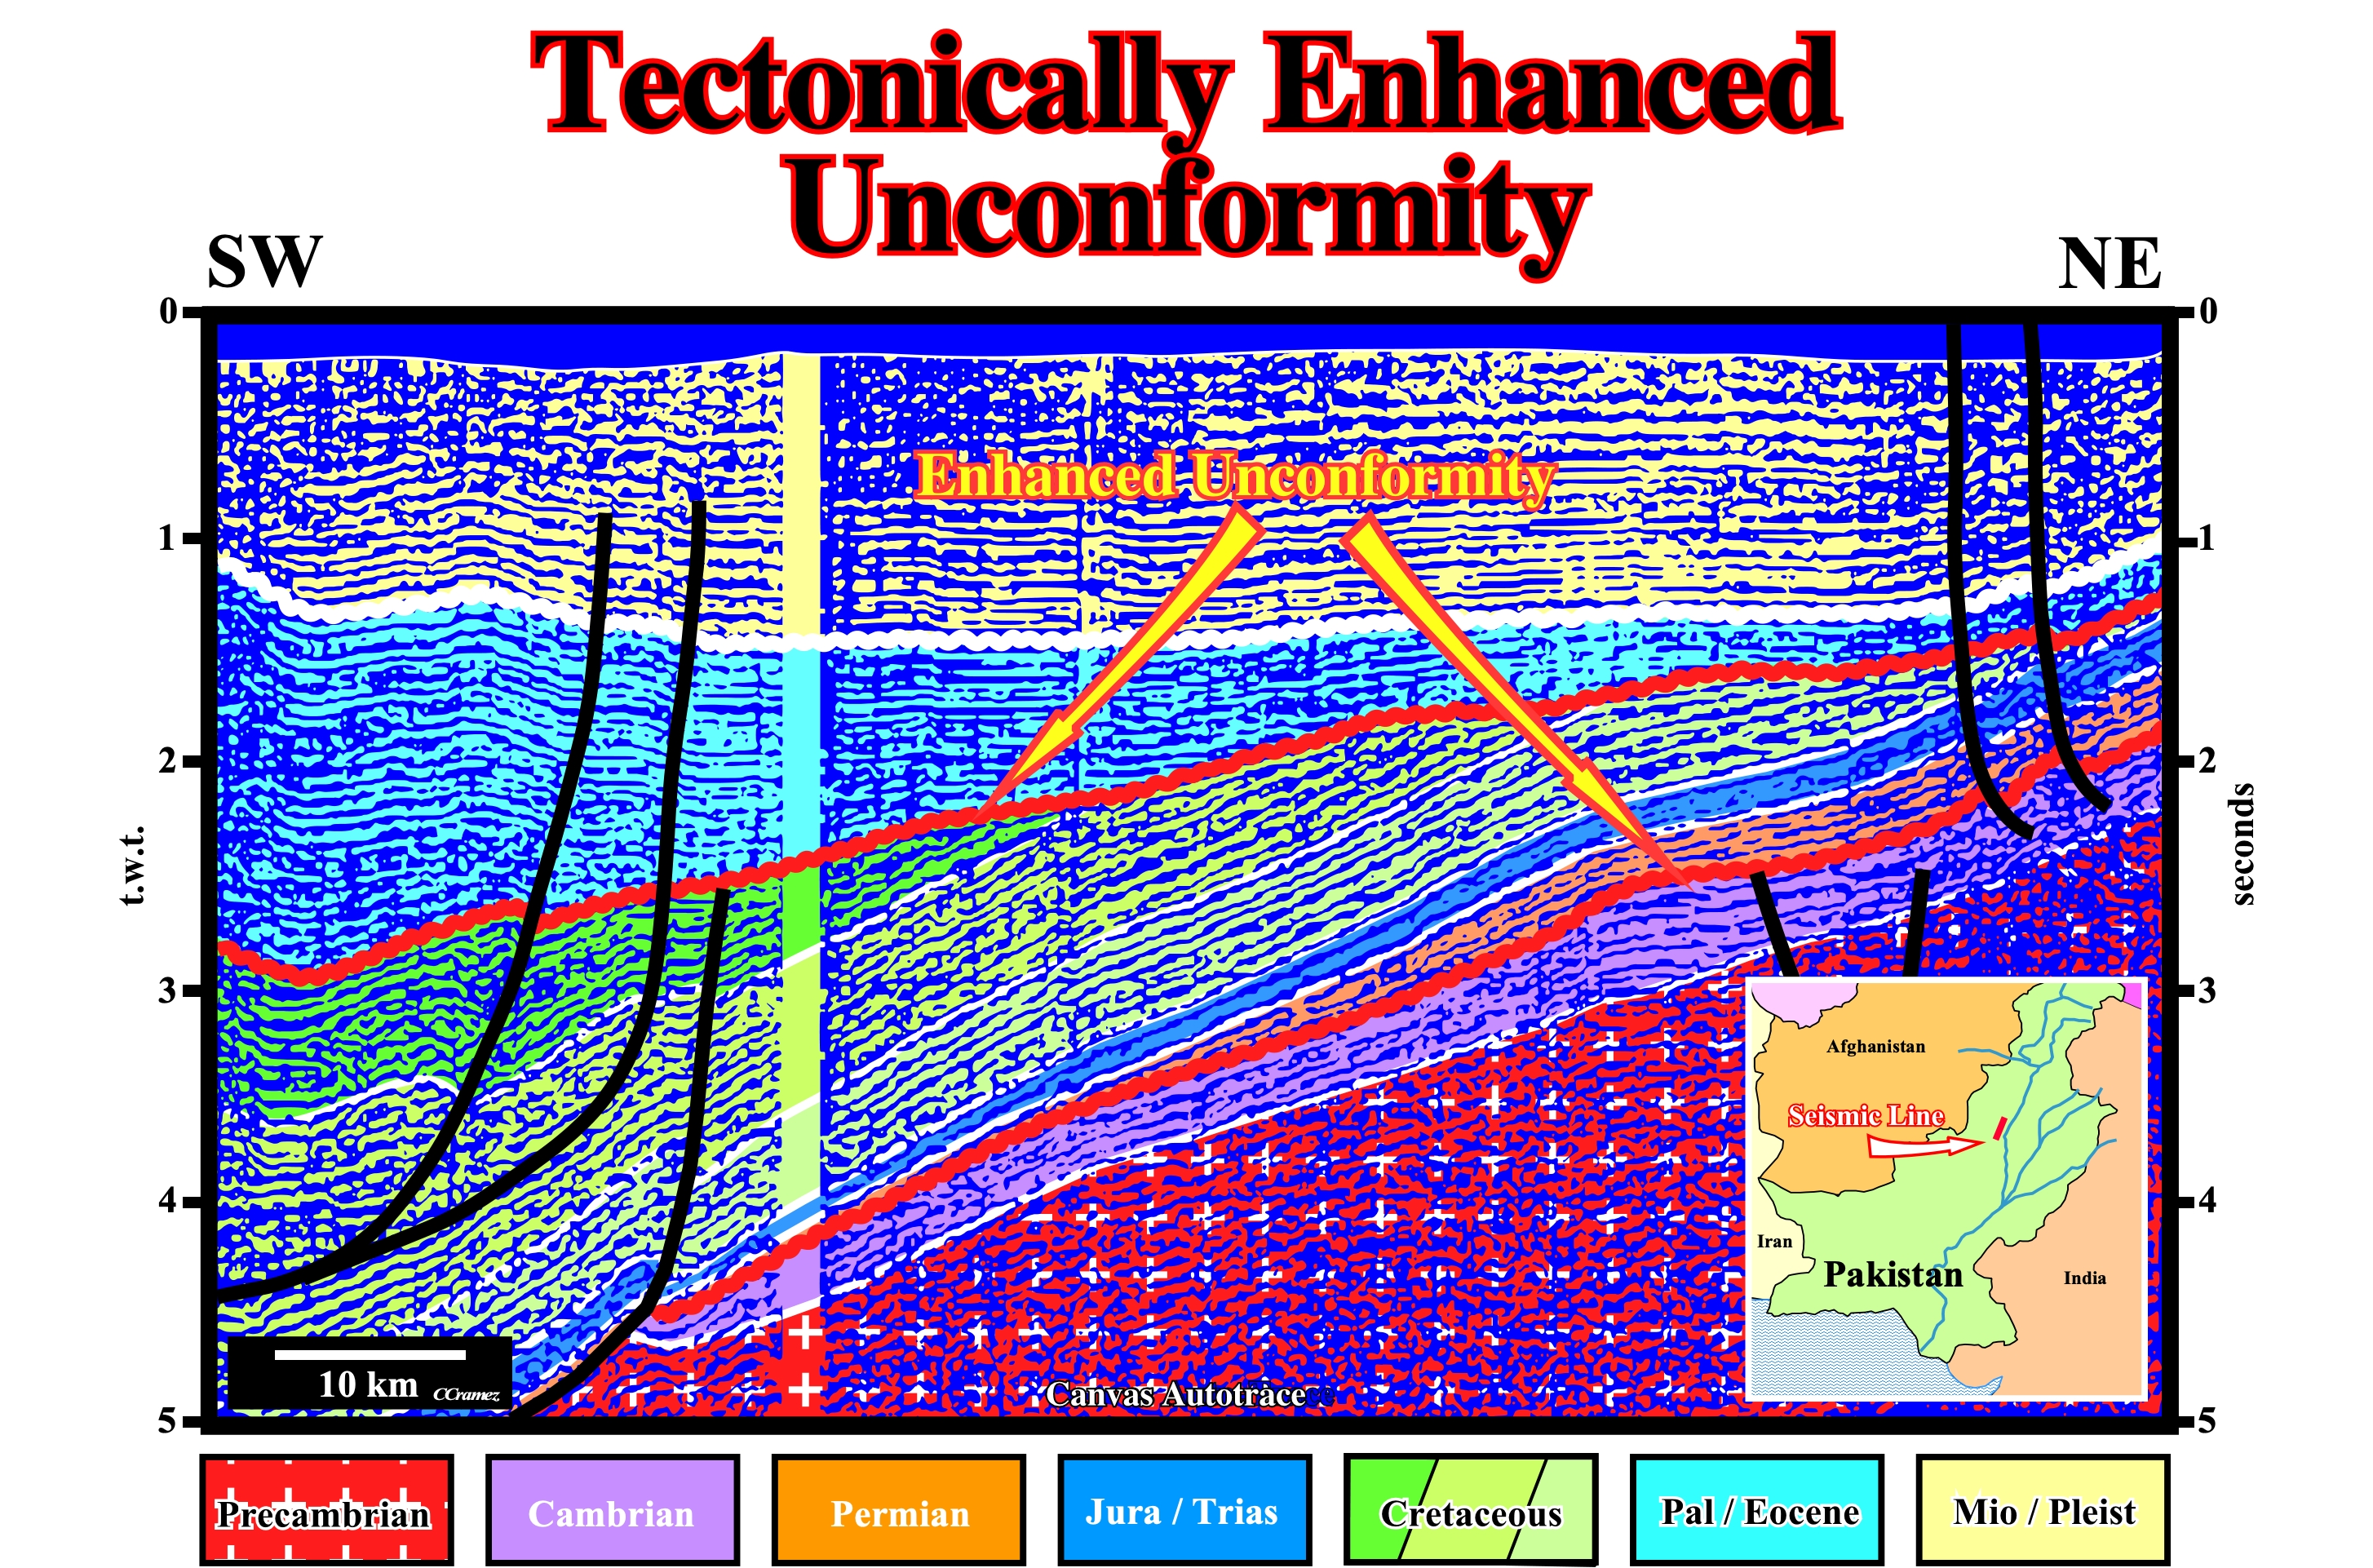
Figure 058 - On this tentative geological interpretation of a Canvas autotrace of a seismic line from Pakistan onshore,at least, two tectonically enhanced unconformities are, easily, recognized, particularly, the unconformity between the Cretaceous and Paleocene / Eocene sediments (upper red unconformity). The tectonic enhancement of the unconformity between the Cambrian and Permian is no too evident. Both enhanced unconformities are characterized by truncation (erosional toplaps) of the underlying sediments and onlapping of the overlying sediments, which contrast, strongly, with the geometrical relationships of the unconformity between the Paleocene / Eocene and the Miocene / Pleistocene sediments. Along a tectonically enhanced unconformity (angular unconformity) the sedimentary interface between the overlying and underlying sediments changes laterally. Consequently, the acoustical impedance profile changes, also, laterally. Such a feature obliges, often, the geoscientist in charge of the geological interpretation of the seismic lines, to change from a peak to a trough or from a trough to a peak and so on, when, tentatively, picking an unconformity. Obvious, such a lateral acoustic impedance changing proscribe not only a continuous picking, but any kind of automatic picking. It was about this that unfortunately some American geoscientists said that “pick unconformities is for men not for ladies”. The term "angular unconformity” is, mainly, used by structural geoscientists (those who are, particularly, interested in Structural Geology), while the term “tectonically enhanced unconformity” is used, mainly, by geoscientists who more interested in Stratigraphy and, particularly, in Sequential Stratigraphy. Generally, the first ones considered tectonics as a predominant factor in sedimentation, while the others think that is the eustasy, since the rate of absolute sea level changes is much higher than the rate of the tectonic changes.
Potential non-structural traps are, often, associated with tectonically enhanced unconformities either in the underlying sediments or in the overlying onlapping sediments. Morphological traps (see later) associated to certain geological bodies as reefs, turbiditic fans, incised valley infillings, etc., are predominant in the sediments overlying a tectonically enhanced unconformity, while morphological traps by juxtaposition induced by faulting or by truncation are predominant in the underlying sediments (figure 059). In a structural trap, the map of the sealing-rock is not too important, however in a non-structural traps, such a map is as important as the map of the reservoir-rock. In a non-structural traps, it is the sealing-rock that close the reservoir-rock. In non-structural traps, particularly, when they are below tectonically enhanced unconformities, geoscientists must do not forget that :
A) The structural map of the unconformity is not significant of the trap.
B) The crucial maps are :
(i) The map of the top of the reservoir-rock ;
(ii) The map of the sealing-rock and
(iii) The map of the hydrocarbon migration paths.
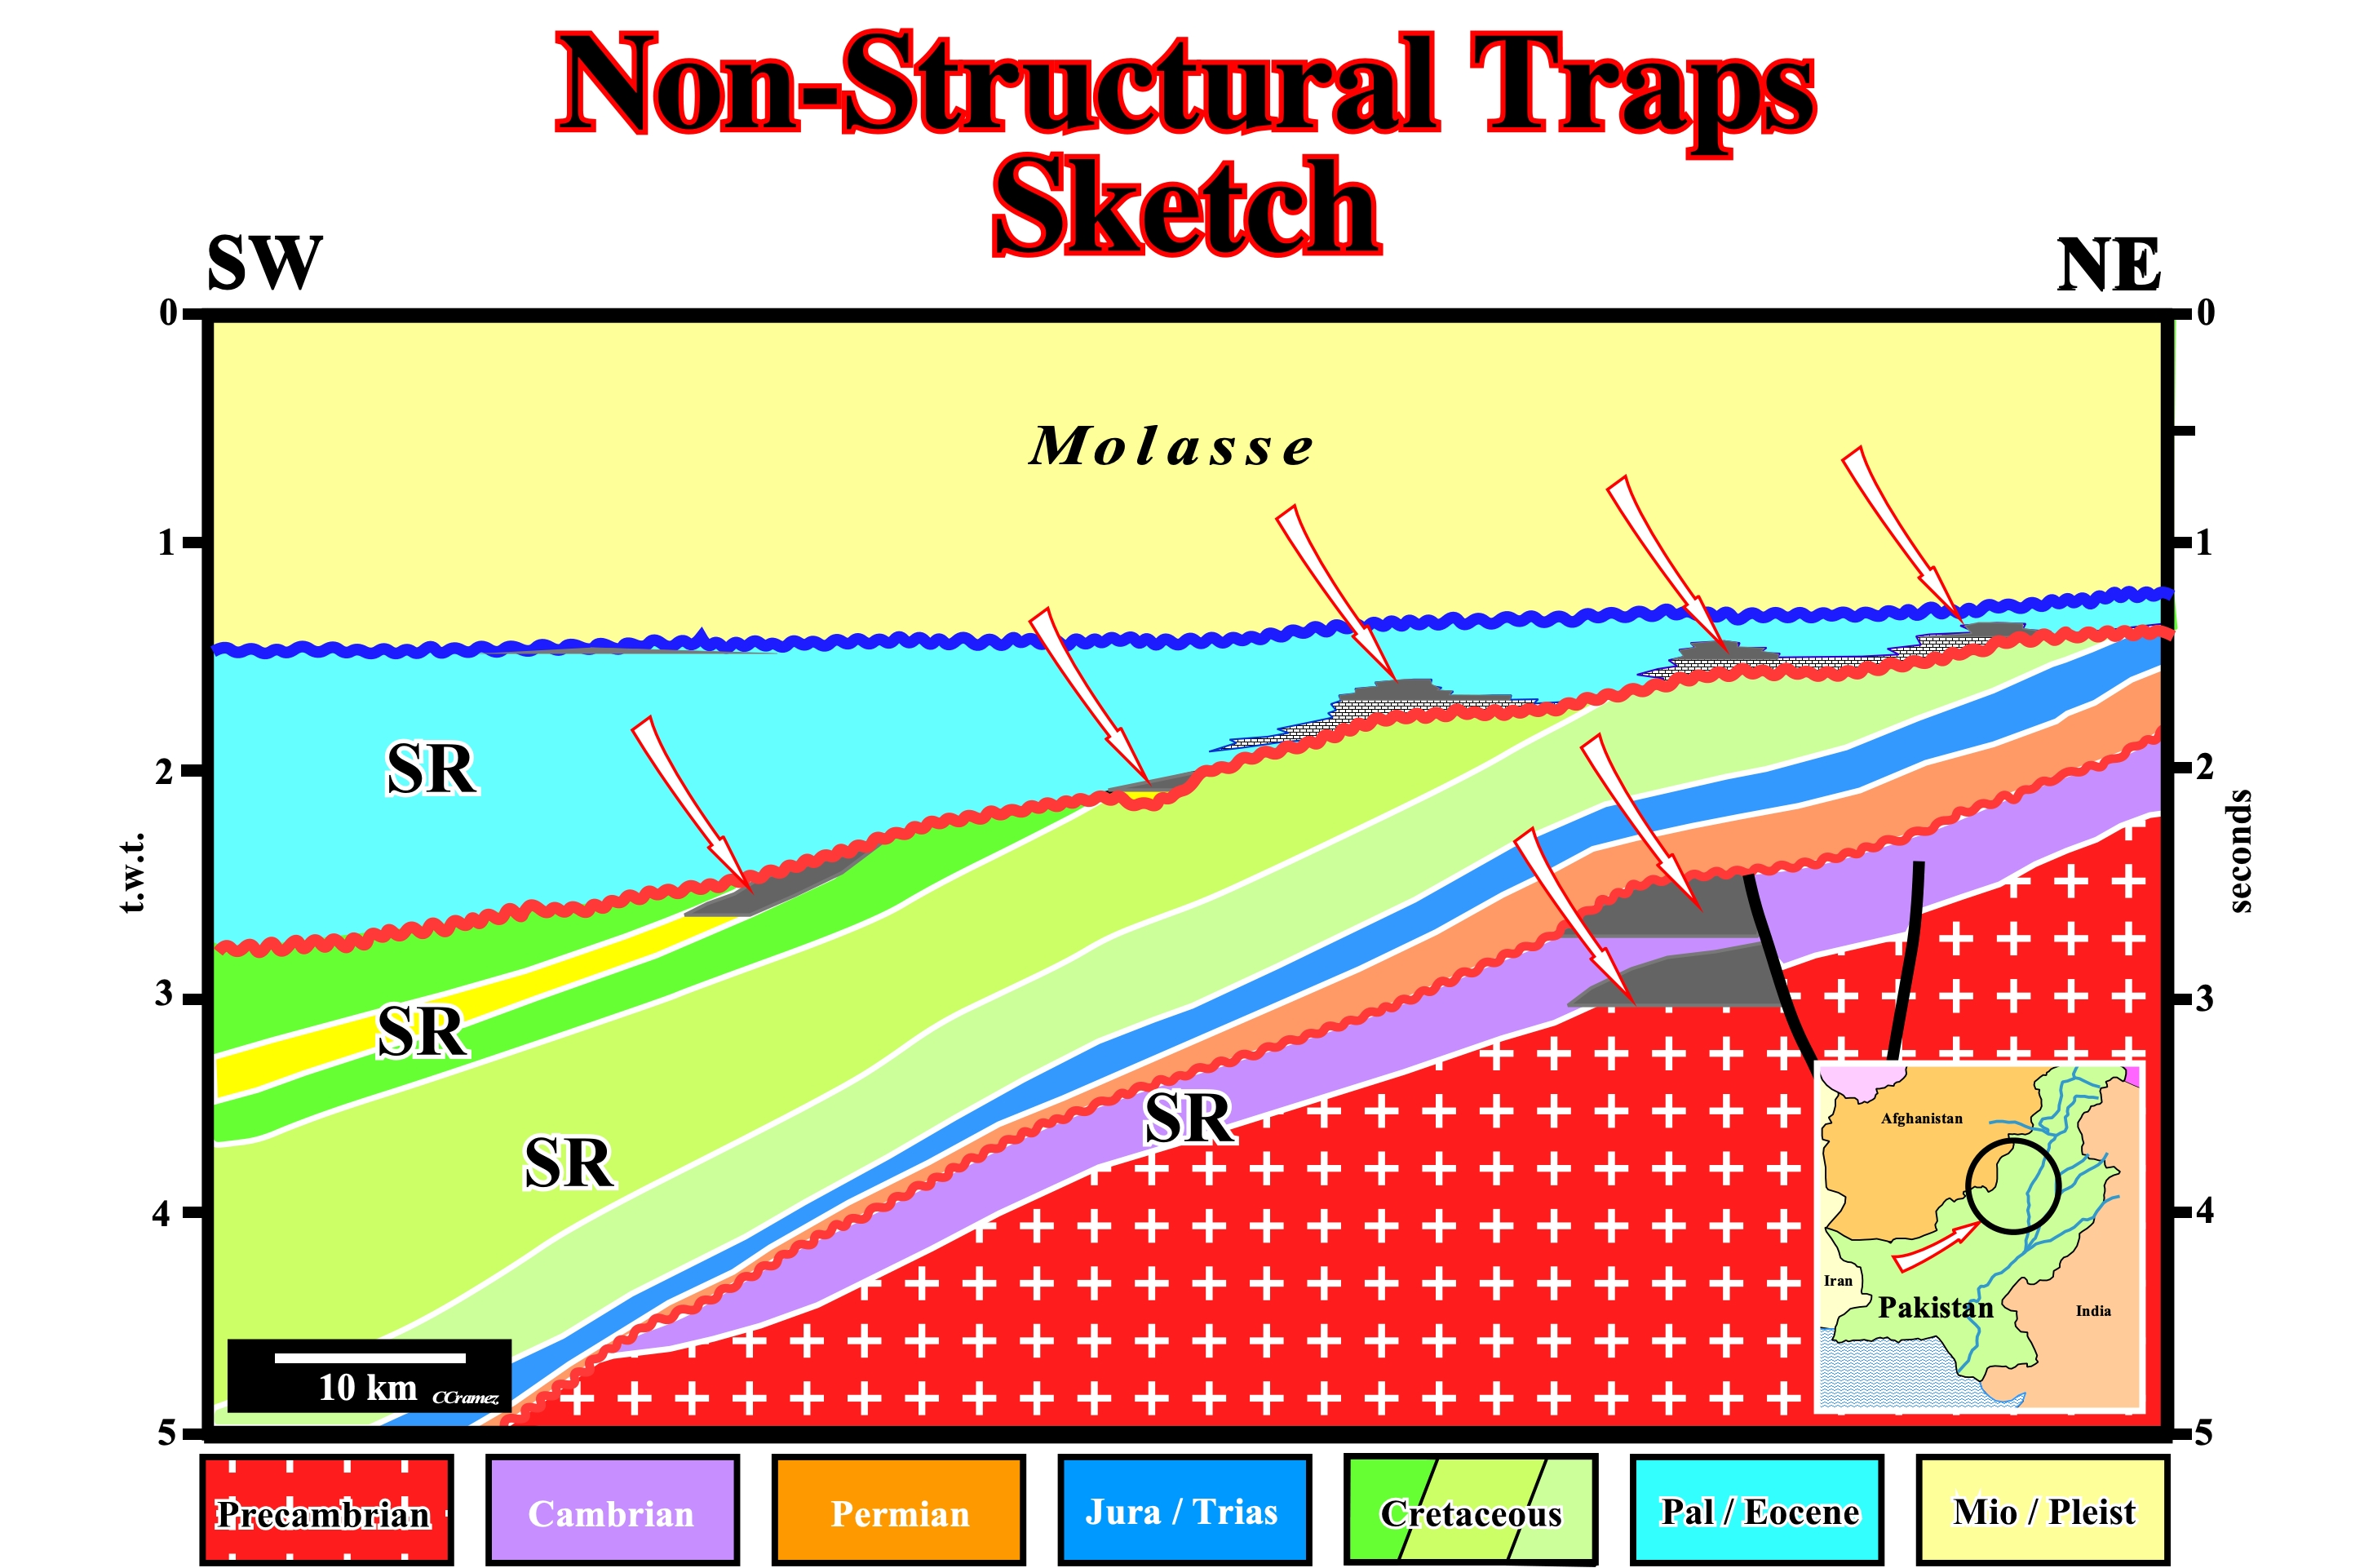
Figure 059- This geological sketch illustrates some of the more common non-structural traps associated with tectonically enhanced unconformities. Assuming the presence of a generating petroleum subsystems downdip, hydrocarbon accumulations are possible in morphological traps below and above the enhanced unconformities. Below the unconformity, in the Cambrian sediments, in association with a normal faulting, morphological traps by juxtaposition are likely. Notice that a fault plane does not close the reservoir-rock. A fault trap, as often said by a lot of geoscientists, is misnomer. There are not fault-traps. However, the relative movement of the faulted-blocks can put in juxtaposition to the reservoir-rock, a rock with a higher displacement pressure, what can close, laterally, the reservoir-rock. Just below a tectonically enhanced unconformity, a trapping mechanism can exist, if a sealing-rock onlap the unconformity. Similarly, as illustrated in this sketch, morphological traps associated with reefs, incised valleys infilling or turbiditic mounds can occur just above a tectonically enhanced if a sealing-rock is present.
C) A subcrop map (paleogeologic map) for each tectonically enhanced unconformity is necessary to recognize the real high structural points and migrations paths30. A subcrop or paleogeologic map represents the outcrop pattern of rocks immediately under the unconformity on the surface of the unconformity. It shows how the geological map would look if the rocks which overly the unconformity were stripped off. Such a map has to be constructed from available data on the nature of the rock, which immediately underlies the surface of unconformity.
30A needful exploration map for the understanding of the potential petroleum systems of the geographic Chaco-Parana basin, in Argentina, is, undoubtedly, a subcrop at the level of the tectonically enhanced unconformity, as well paleogeographic maps. In fact, some of high structural point, recognized on the seismic lines and tested by drilling my, seem do not correspond to the highest structural points on a subcrop map.
D) The best time for migration of the hydrocarbons within an aquifer is the period during which the sediments are tilted up (lengthened by an extensional tectonic regime) or uplift by a compressional tectonic regime, i.e., shortened and then eroded, because all equilibrium conditions are disturbed. In uplifted areas, the fluid pressures decline as erosion approaches and finally cuts into the reservoir-rock. Such a decline in pressure causes the fluids to expand differentially : the gas expanding many times its originally volume as atmospheric pressure are approached.
The expanding fluids (water, oil, and gas) are forced out in the direction of lower pressure, in this case of the eroding surface. As the hydrocarbons move toward the lower pressure or up dip, or both, any barriers that are encountered will trap part of the oil or gas. This is particularly interesting when there are two or more tectonically enhanced unconformities, as it is the case in Pakistan onshore, because it allows the filling not only of Cambrian and Cretaceous reservoirs-rocks, but Paleocene-Eocene reservoir-rocks as well (see figures 058 and 059).
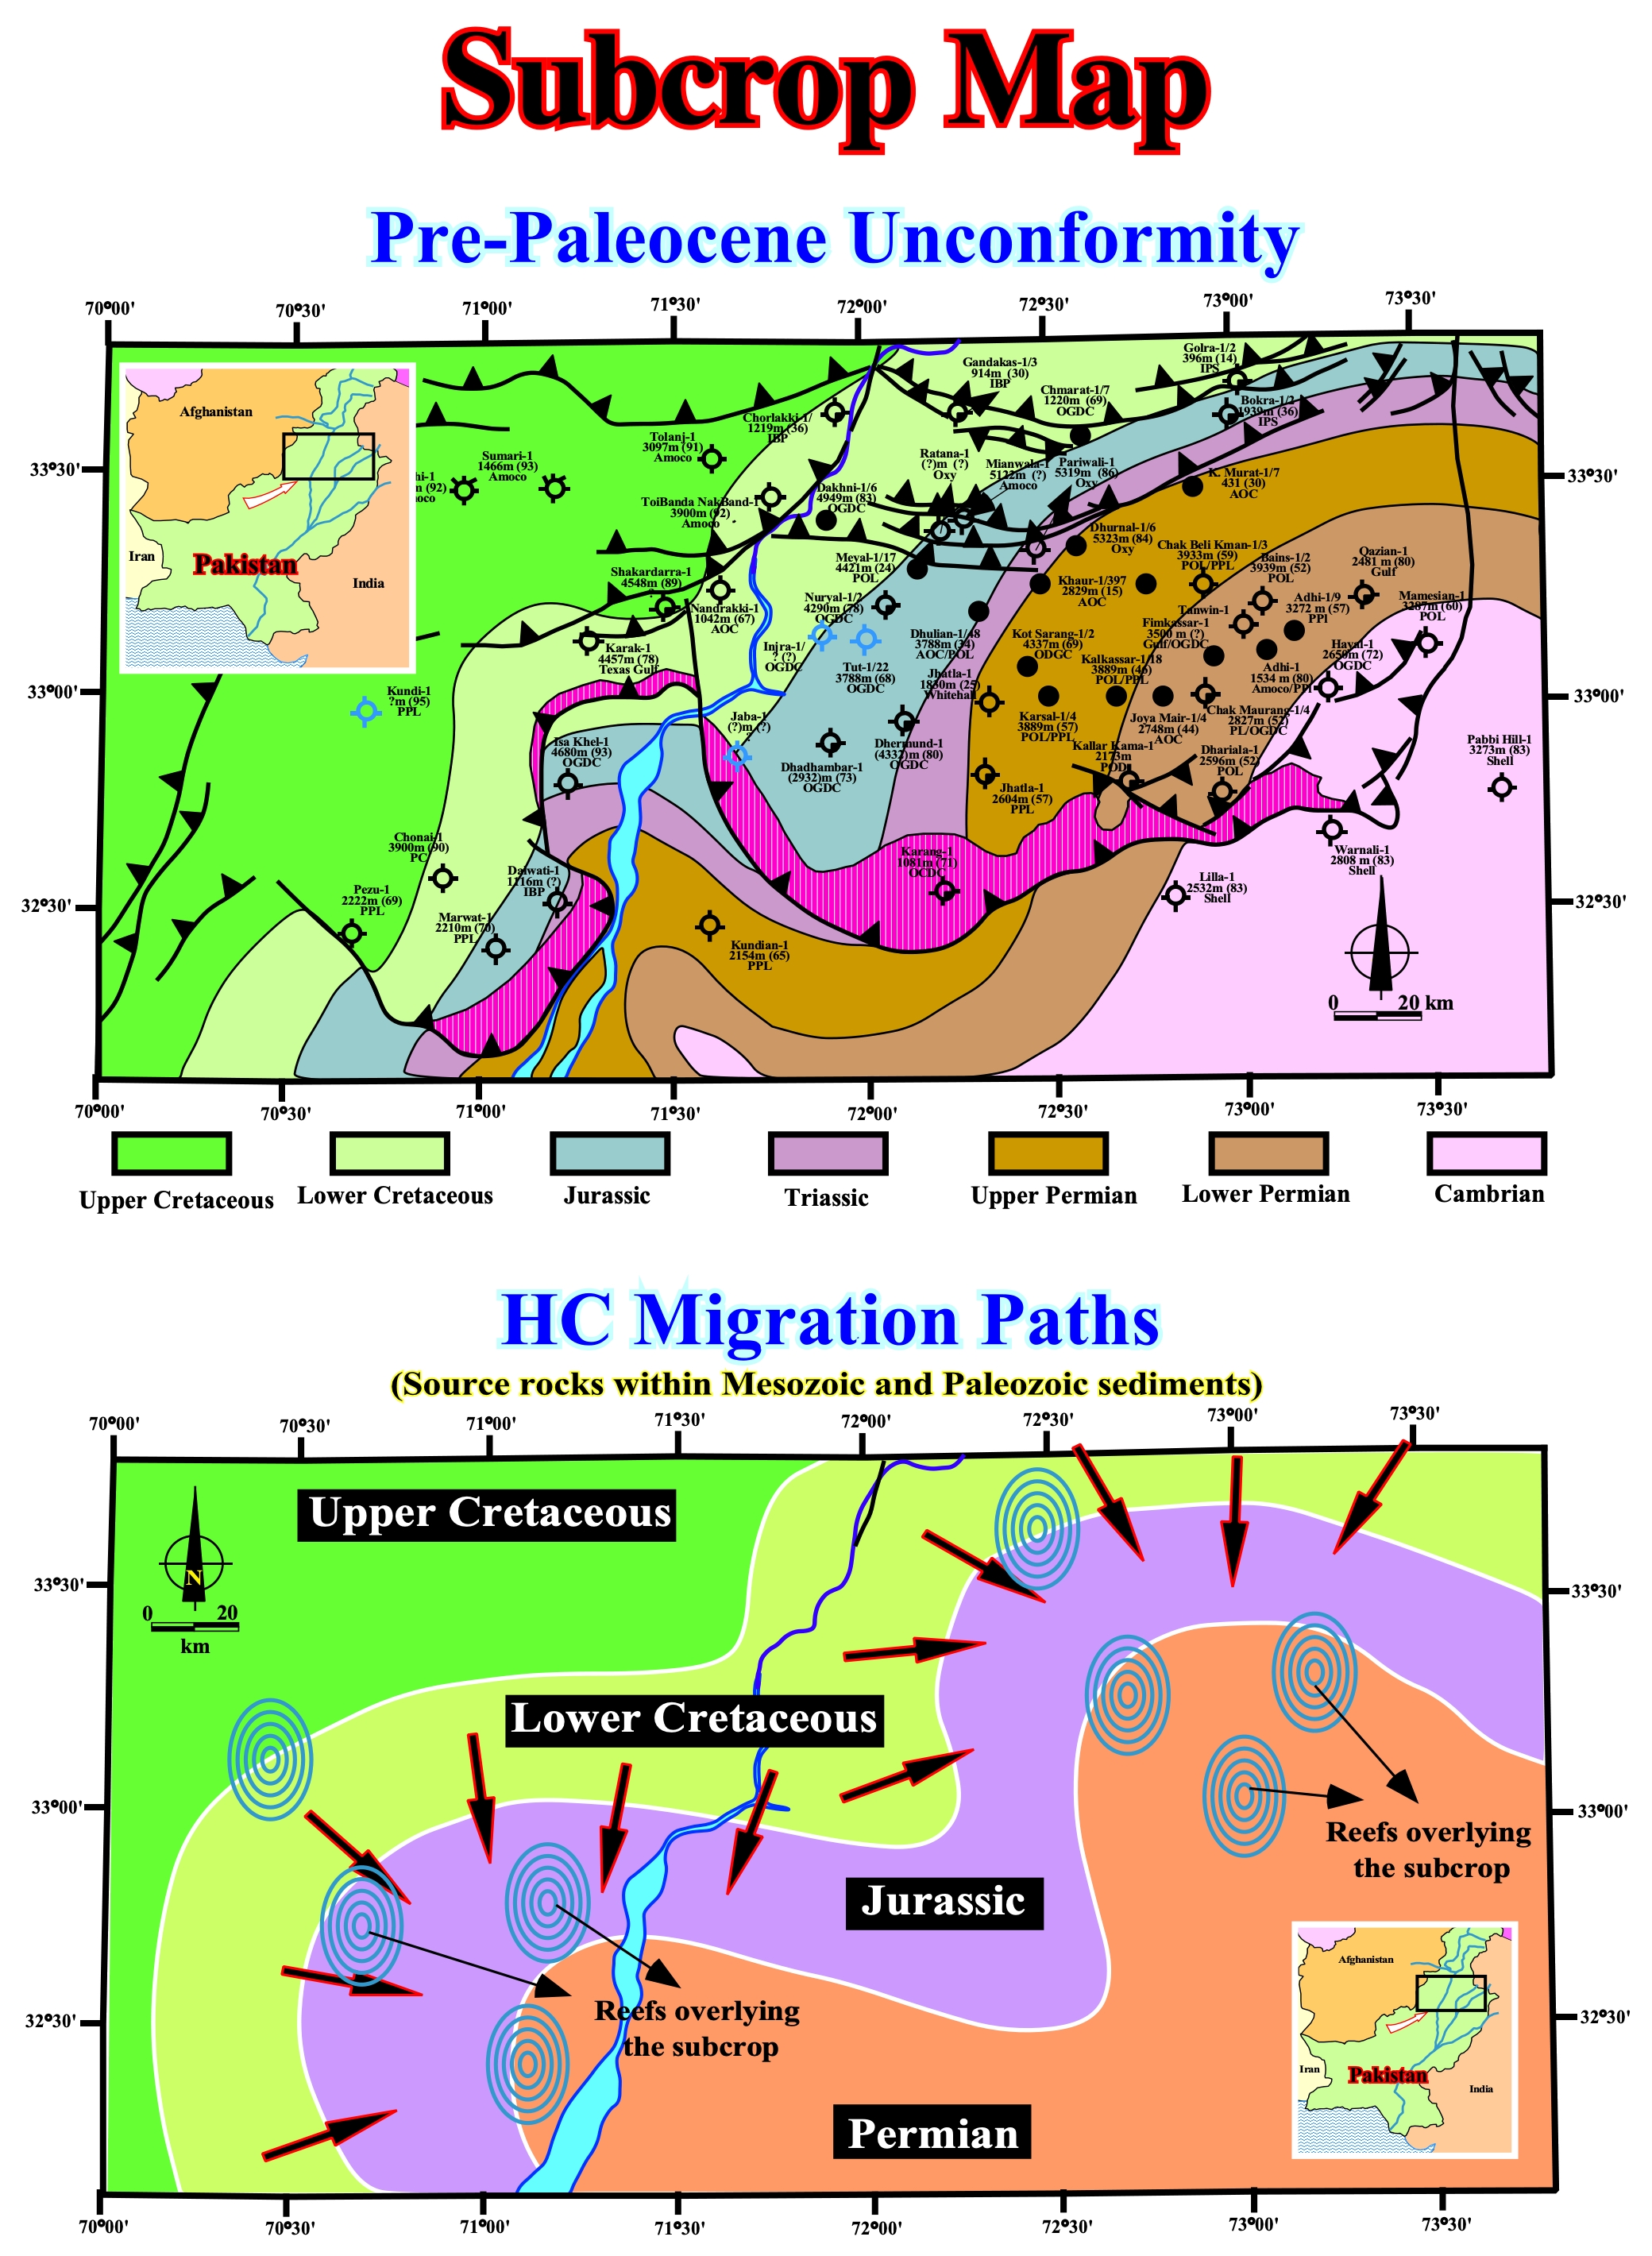
Figure 060 - The above subcrop map was done at the level of the Paleocene / Cretaceous tectonically enhanced unconformity of the tentative geological interpretation of the Canvas autotrace seismic line of the Pakistan onshore, using the stratigraphic results of the exploration wells. The structural trends strike roughly NW - SW and two anticline axis are easily recognized. These structural axis seem to control the distribution in the Paleocene reefs, which form excellent morphologic traps. The subcrop map strongly suggest the time of oil and gas migration as well as the more likely migration paths.
E) Paleogeographic maps i.e., geological maps immediately below an erosional surface (unconformity), in which the geological formations are projected in their original positions before deformation and erosion, can help the understanding of crucial exploration problems as:
1 - Pre-unconformity structures ;
2 - Truncation or shoreline, as the cause wedge-out of sediments ;
3 - Time of deformation ;
4 - Location of wedge belts of sediments ;
5 - Source of post-unconformity sediments ;
6 - Time of oil and gas migration and the more likely migration paths ;
7 - Paleohydrodynamic gradients ;
8 - Earth ruptures, such as thrust faulting or continental drift, etc.
At this point, a quickly review of some typical examples of paleogeographic maps (Levorsen, A. I., 1960 - Paleogeologic Maps31) is more than necessary. In fact, they are any more learned in the majority of the Universities and impossible to do, automatically, in workstations.
31A distinction must be made between subcrop map as defined above (c) and the paleogeological maps (Levorsen’s term), which is fact are paleo-subcrop maps. The paleogeological maps of Levorsen will be called here paleogeographic maps.
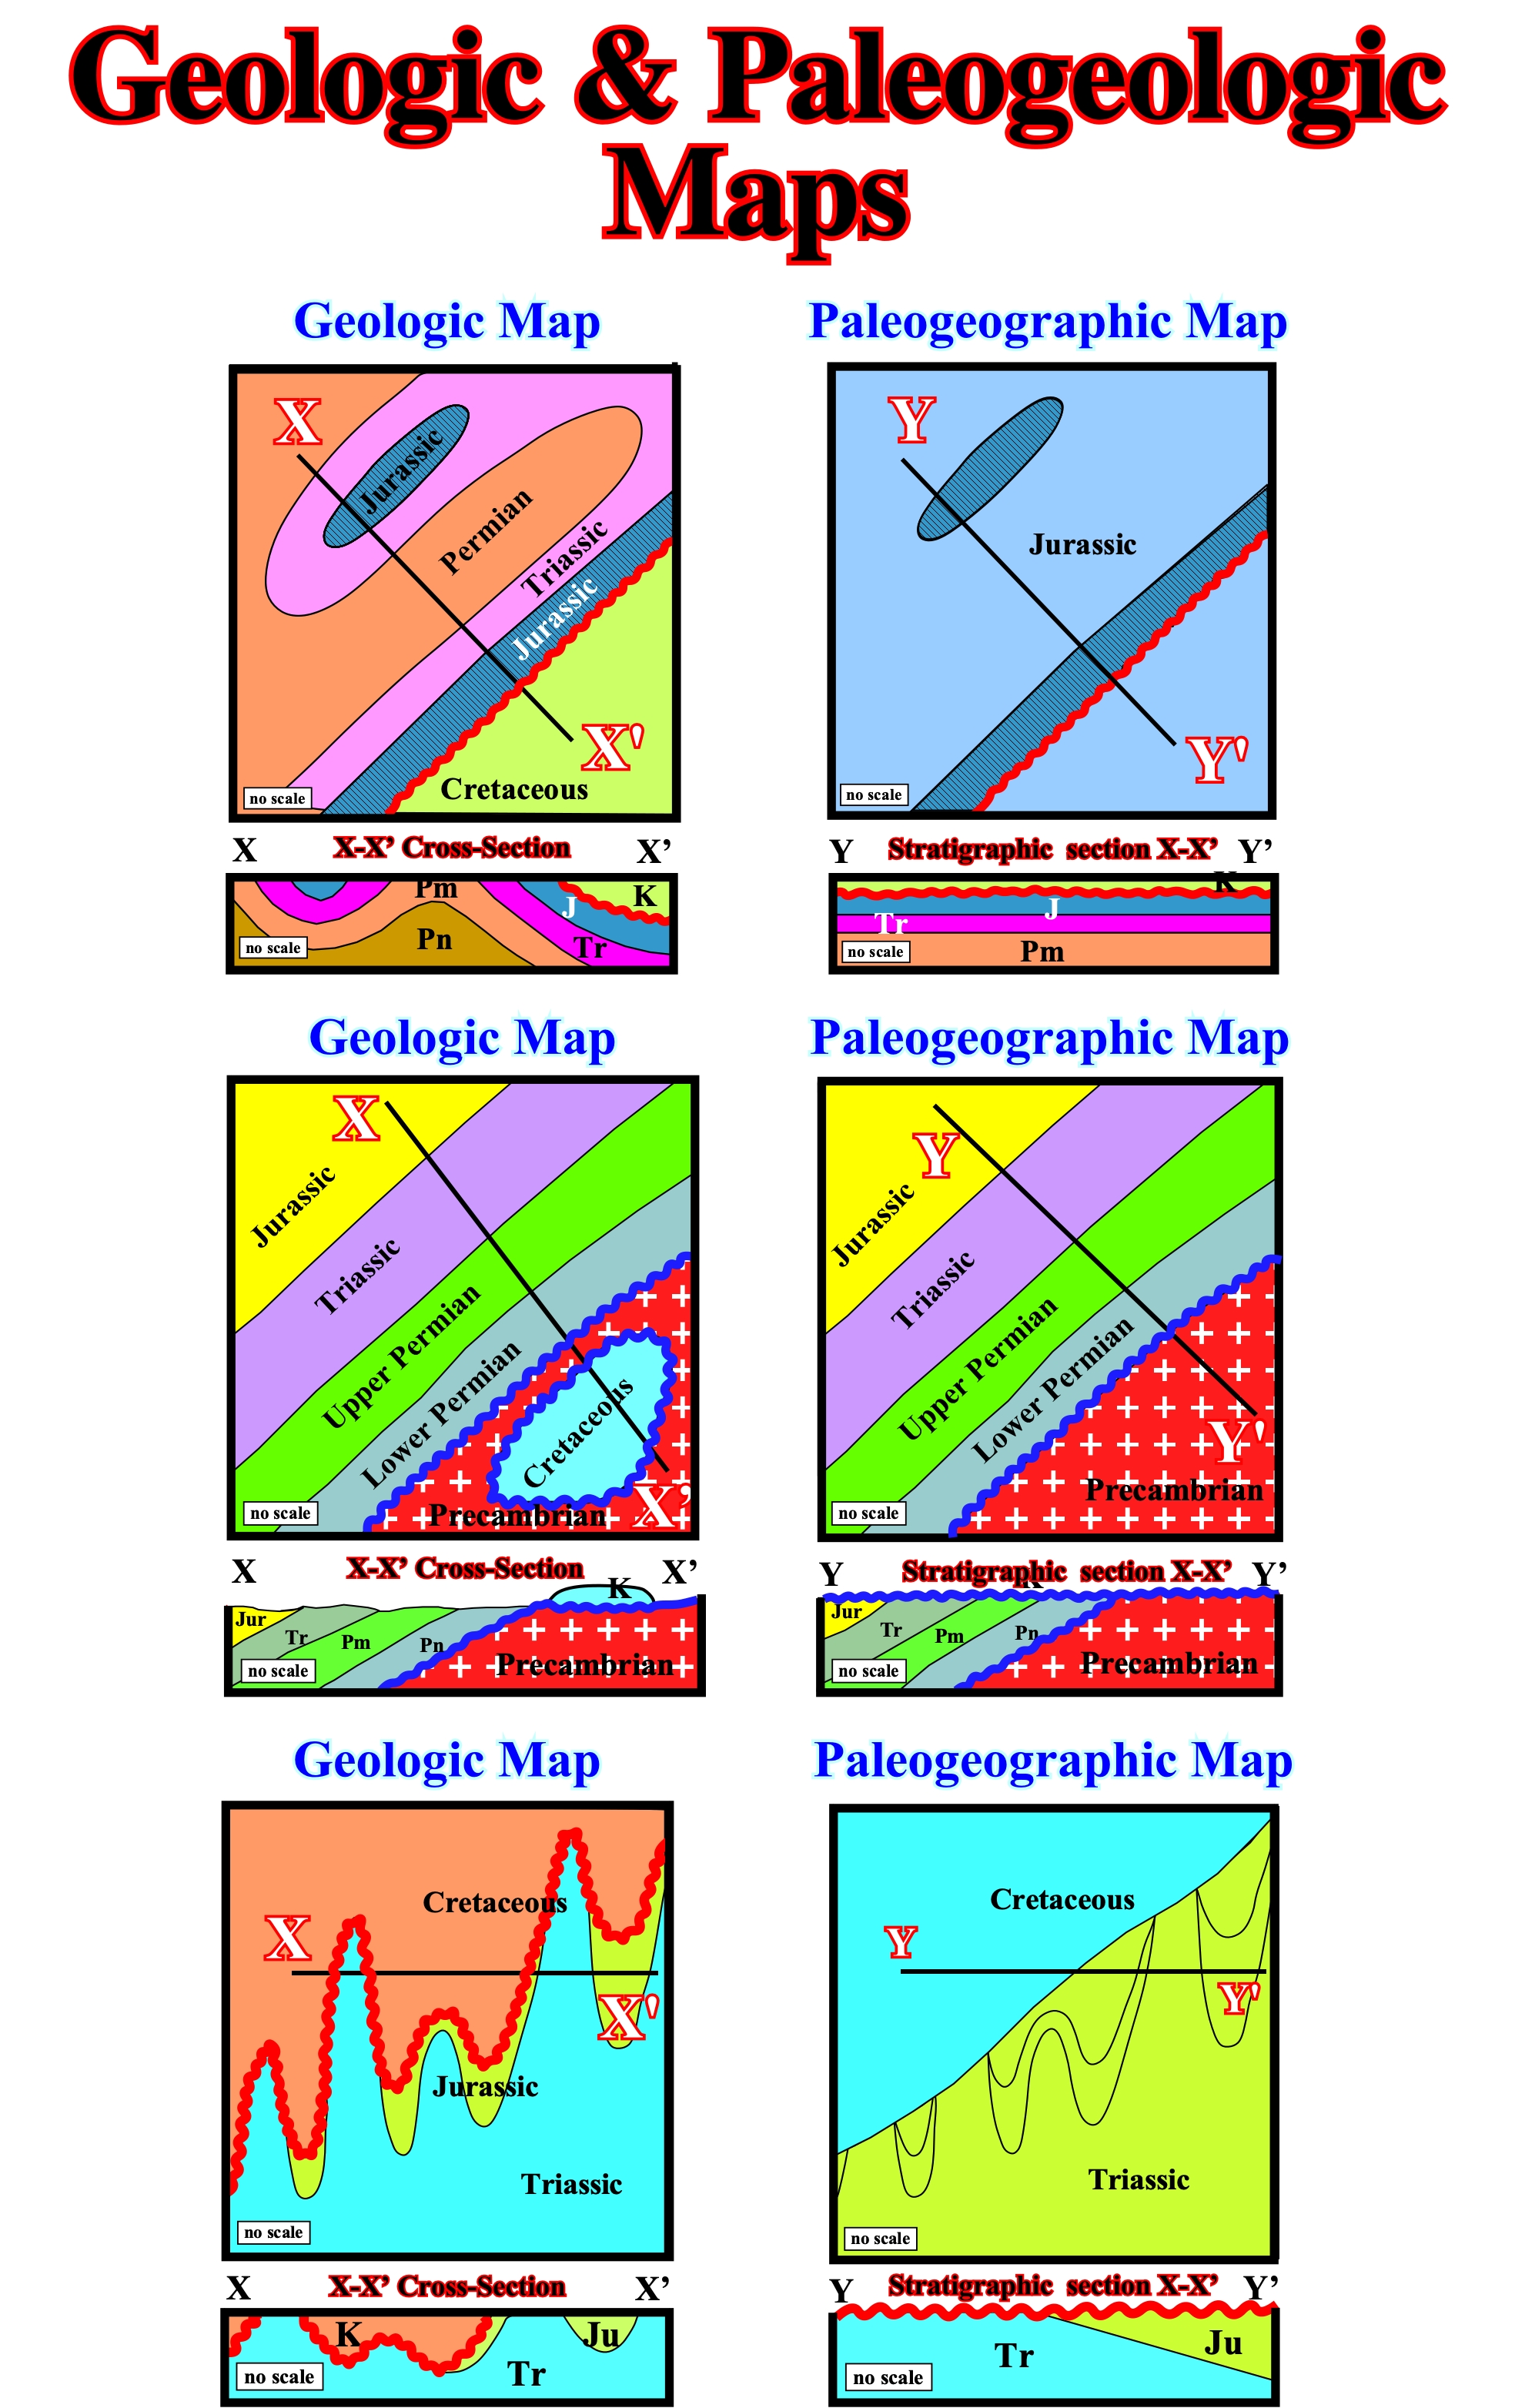
Figure 061 - In this figure, on the left side, are illustrated three areal geological maps with three structural cross-sections (X-X’) across them (datum sea level). On the right side, are illustrated the respective paleogeographic maps as they exist at the pre-Cretaceous time, based on control evidence of the geological maps and the stratigraphic sections (Y-Y’), showing the structure and stratigraphic relations as they existed at the beginning of the Cretaceous time. The unconformity at the base of the Cretaceous is used as the level plane of reference. The stratigraphic sections Y-Y’ can be taken as paleogeographic structure section showing the structure at the time the Cretaceous was being deposited.
In the first geological map (upper part of figure 061), two areas are available for control of the paleogeographic map (hatched areas):
(i) The Jurassic sediments of the western syncline, which, probably, were present when the Cretaceous overlapped the region, even though there is no Cretaceous present there now and
(ii) the contact between the Cretaceous and the Jurassic along the unconformity. Inasmuch as the Cretaceous was folded with the Jurassic and older rocks, it may be inferred that folding along the area of the syncline and along the unconformity is post-Cretaceous, and only the Jurassic (area hatched) is interpreted as having been present at the surface of the area when the Cretaceous was deposited.
A somewhat different situation is illustrated in the geological map showed in middle of figure 061. The control evidence for the paleogeographic map consists first of the area of Jurassic rocks (they are the next older rocks below the Cretaceous formation and must have been present when the area was overlapped by the Cretaceous). The second area of control is along the contact of Cretaceous on the Precambrian rocks. The Triassic, Upper and Lower Permian must also have been present in the pre-Cretaceous time approximately as they are now in the geological map. As the formation boundary contacts are parallel, likely the entire pre-Cretaceous section of strata was tilted up toward the Southeast at the same time, and then truncated by erosion. Following the tilt and the erosion, the Cretaceous presumably was deposited across the truncated edges. The absence now of the Cretaceous over much of the area is due to either post-Cretaceous erosion or non deposition. If its absence is due to non deposition, the pre-Cretaceous geology then was essentially the same as it is now, for the tilt and erosion occurred in pre-Cretaceous time.
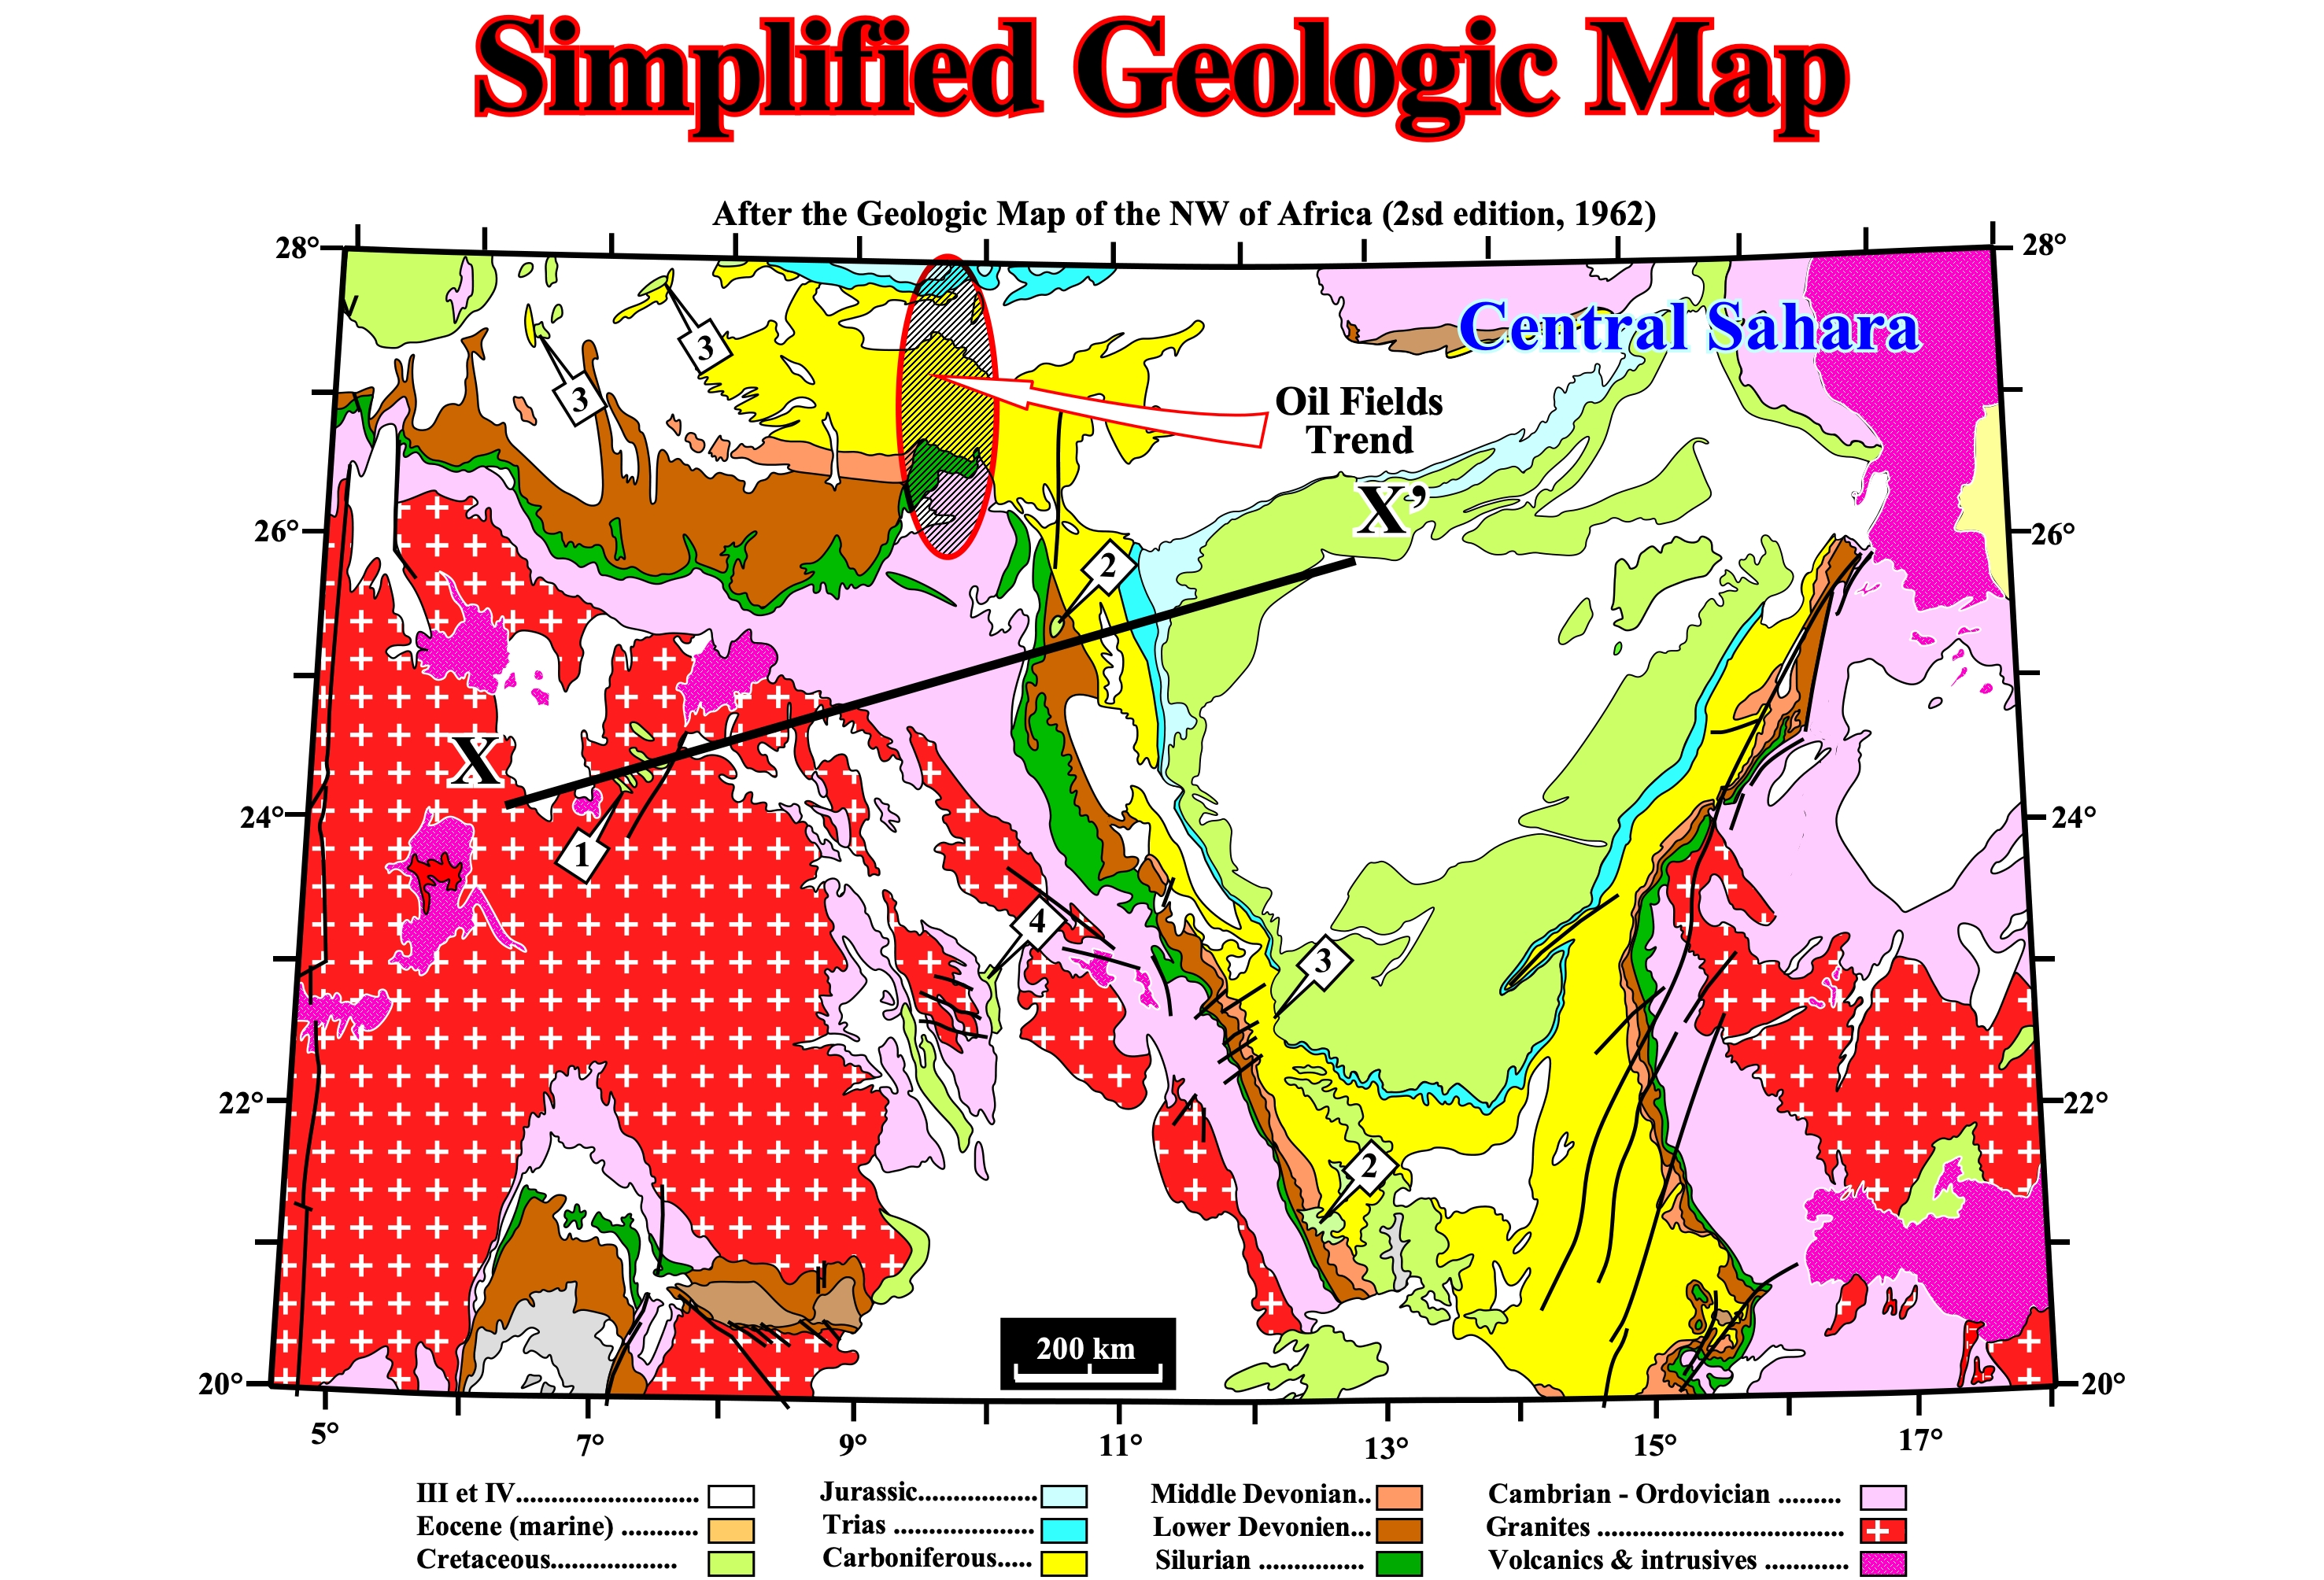
Figure 062 - In this simplified geological map of the Central Sahara, one can recognize that the Cretaceous sediments (in light green) lie upon Precambrian rocks (1) and Devonian sediments (2). Similarly, they overlain Carboniferous sediment (3) and Cambrian / Ordovician sediments (4). All this suggests that the present pre-Cretaceous pattern of the geology was formed in pre-Cretaceous and post-Carboniferous time. The location of the oil fields, as Edjele, Tiguentourine, Zatzaitine and others is, roughly, located along the colored ellipse. For a petroleum geoscientist the questions is : Why the oil fields trend, roughly, North-South ?
A wedge-out outcrop, or of distribution pattern on an areal geological map, frequently marks the point where the formation is truncated at the surface of unconformity is illustrated on the lower part of figure 061. Four anticlines plunging northward are indicated, based on the distribution of formations. A line connecting the points of the wedges is the farthest north wedge of Jurassic rocks. Northward of this line, the Cretaceous rocks lie on Triassic rocks, and south of it, the Cretaceous rocks lie on Jurassic rocks. From the present areal maps it may be inferred that the folding in the area was post-Cretaceous time, since its contact with the Jurassic rocks is folded along with the Jurassic / Triassic contact. A further inference is that the erosion that produced the present geologic pattern is later than the folding.
These maps explain, often, the more likely location of hydrocarbon accumulations, as it seems to be the case in the Central Sahara, which simplified geological map is illustrated below (figure 062). From the geological map illustrated in figure 062, one can see that the present surface boundaries between the pre-Cretaceous formation obviously formed before the Cretaceous was deposited, for they extend out from the Cretaceous cover without any change in direction. The present areal geological map of the pre-Cretaceous of this area, consequently, is the same as the paleogeographic map of the pre-Cretaceous. The basal Carboniferous rests on a succession of Devonian, Silurian, Ordovician and Cambrian from west to east, and then the same sequence is repeated in reverse from near the center of the map to the south-east corner. The regular sequence from youngest to oldest, from both sides to the center suggests a pre-Carboniferous arch along the unconformity (figure 063).
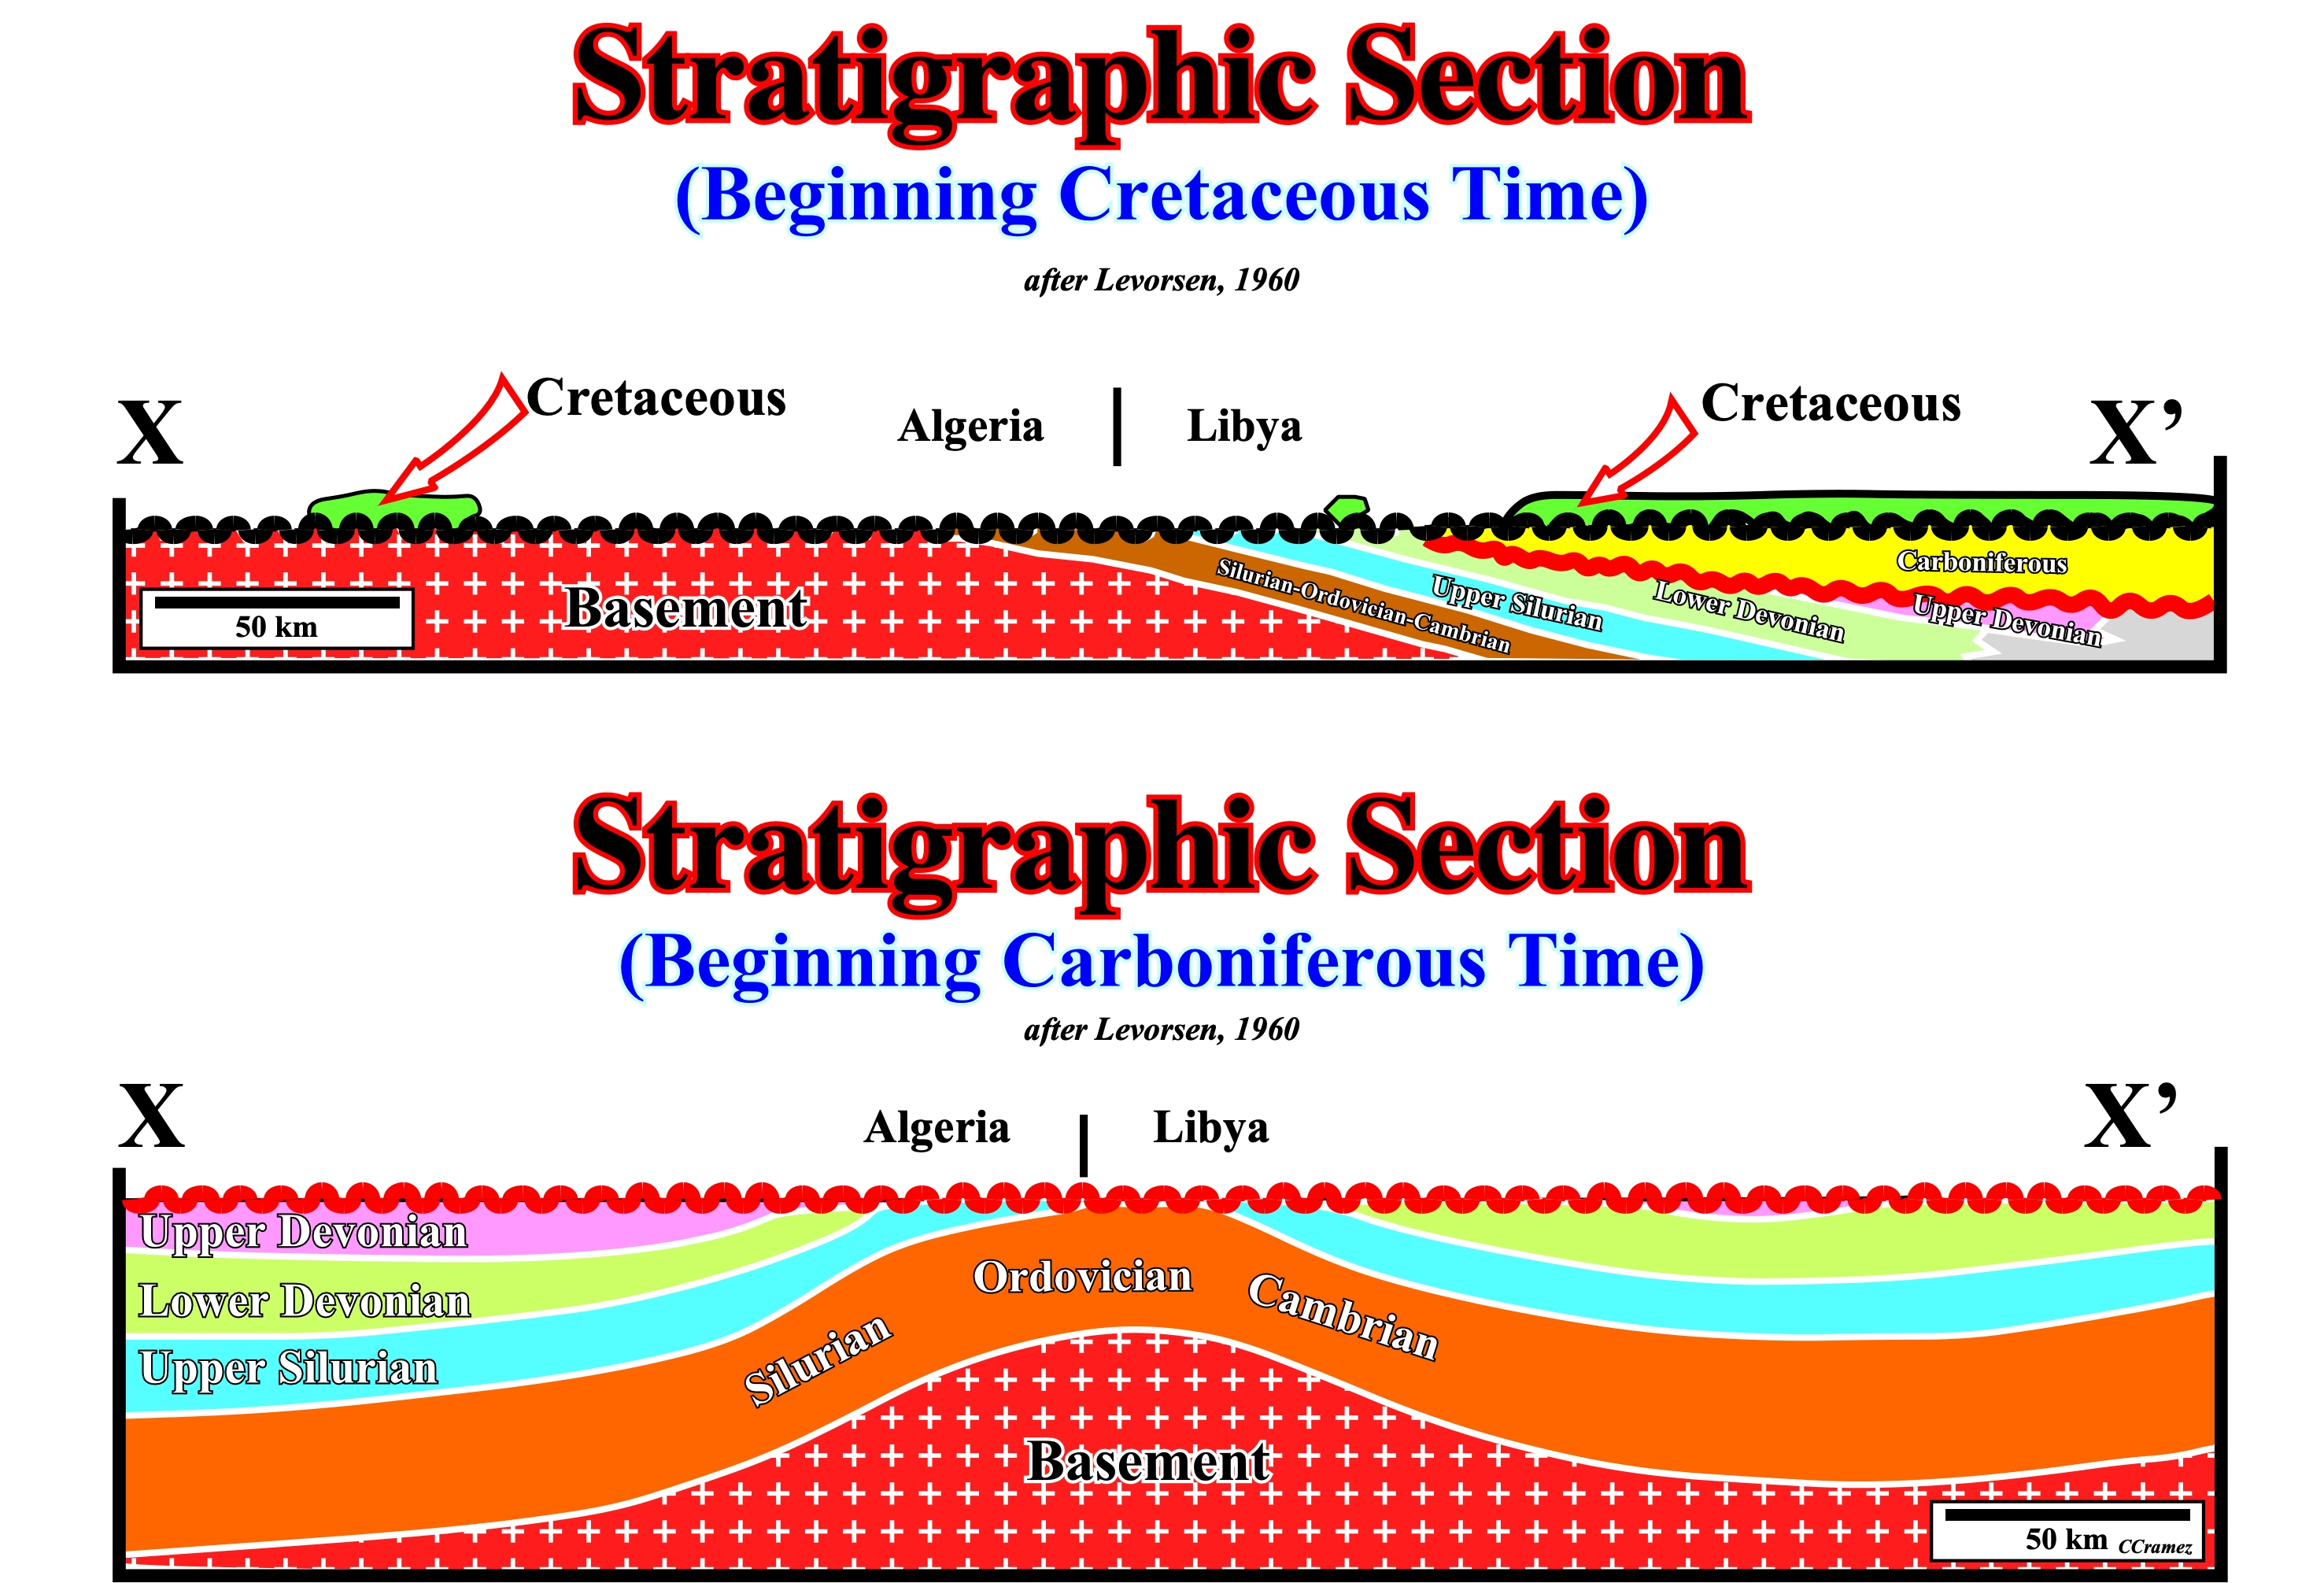
Figure 063 - The idealized stratigraphic sections X-X’ (see location in figure 062) shows the structure at the beginning of the Cretaceous time and at the beginning of Carboniferous time (Mississippian). The Hercynian orogeny eroded the western flank of the anticlinorium ( large anticline on which minor folds are superimposed).
Presumably the pre-Carboniferous contacts extend under the Carboniferous northward and presumably the Carboniferous was eroded from the arched area toward the South where the older formations are now exposed. It is along this projected arch that the oil fields occur. It is evident from the above map and stratigraphic sections that the underlying arch existed in the pre-Carboniferous time, before the formation the local folds that folded the Carboniferous where the oil fields are now located.