

3) Geological Interpretation is Scale Dependent
An easy refutation test of a geological interpretation (cross-section or seismic line) is to look at the dip of the proposed fault planes, which, at scale 1:1, must dip according to the Anderson's theory of faulting.
In spite of the fact that all geoscientists know that in Geology the scale is 1:1 (natural scale), those working in oil companies have a tendency to forget it, proposing, sometimes, documents without scale or tentative geological interpretations without taking into account the scale of the observed features. Quite often, they forget, also, the effects of the scale exaggeration of the working data (geological cross-section, seismic lines or depth converted seismic lines, etc.). The figure below (figure 008), proposed by Sitter in 1974 is, highly, significant on this subject.

Figure 008- The geometry of an ideal isopachous anticline (shortening) observed in the field (scale 1:1), when represented in a sheet of paper depends on the vertical exaggeration used by the geoscientist, which strongly change the thickness and dip of the beds (after Sitter, 1974).
How many times a proposed tectonic inversion, in which the low structural points become high structural points and the high structural points become low structural points, as, for instance, in a salt induced turtle-back structure is refuted just because the geoscientist forgot that a thicker interval interval on the top of antiform structure can just due to the effect of the vertical scale exaggeration as illustrate above.
The same is true for the dip of the beds and the dip of a fault planes either on a geological cross-section (figure 009) or on a seismic lines (figure 010). In all tentative geological interpretation of a cross-section or of a seismic line, geoscientists should never forget, that the dip of the fault planes, predicted by the Anderson's theory of faulting fault (normal faults dip ± 60° ; reverse faults dip ± 30° and strike-slip faults dip ± 90°, with common exceptions for thrust faults and low-angle normal faults, which are mechanically unfavorable), can just be used in documents at natural scale, i.e., at scale 1:1, as illustrated in figure 009.
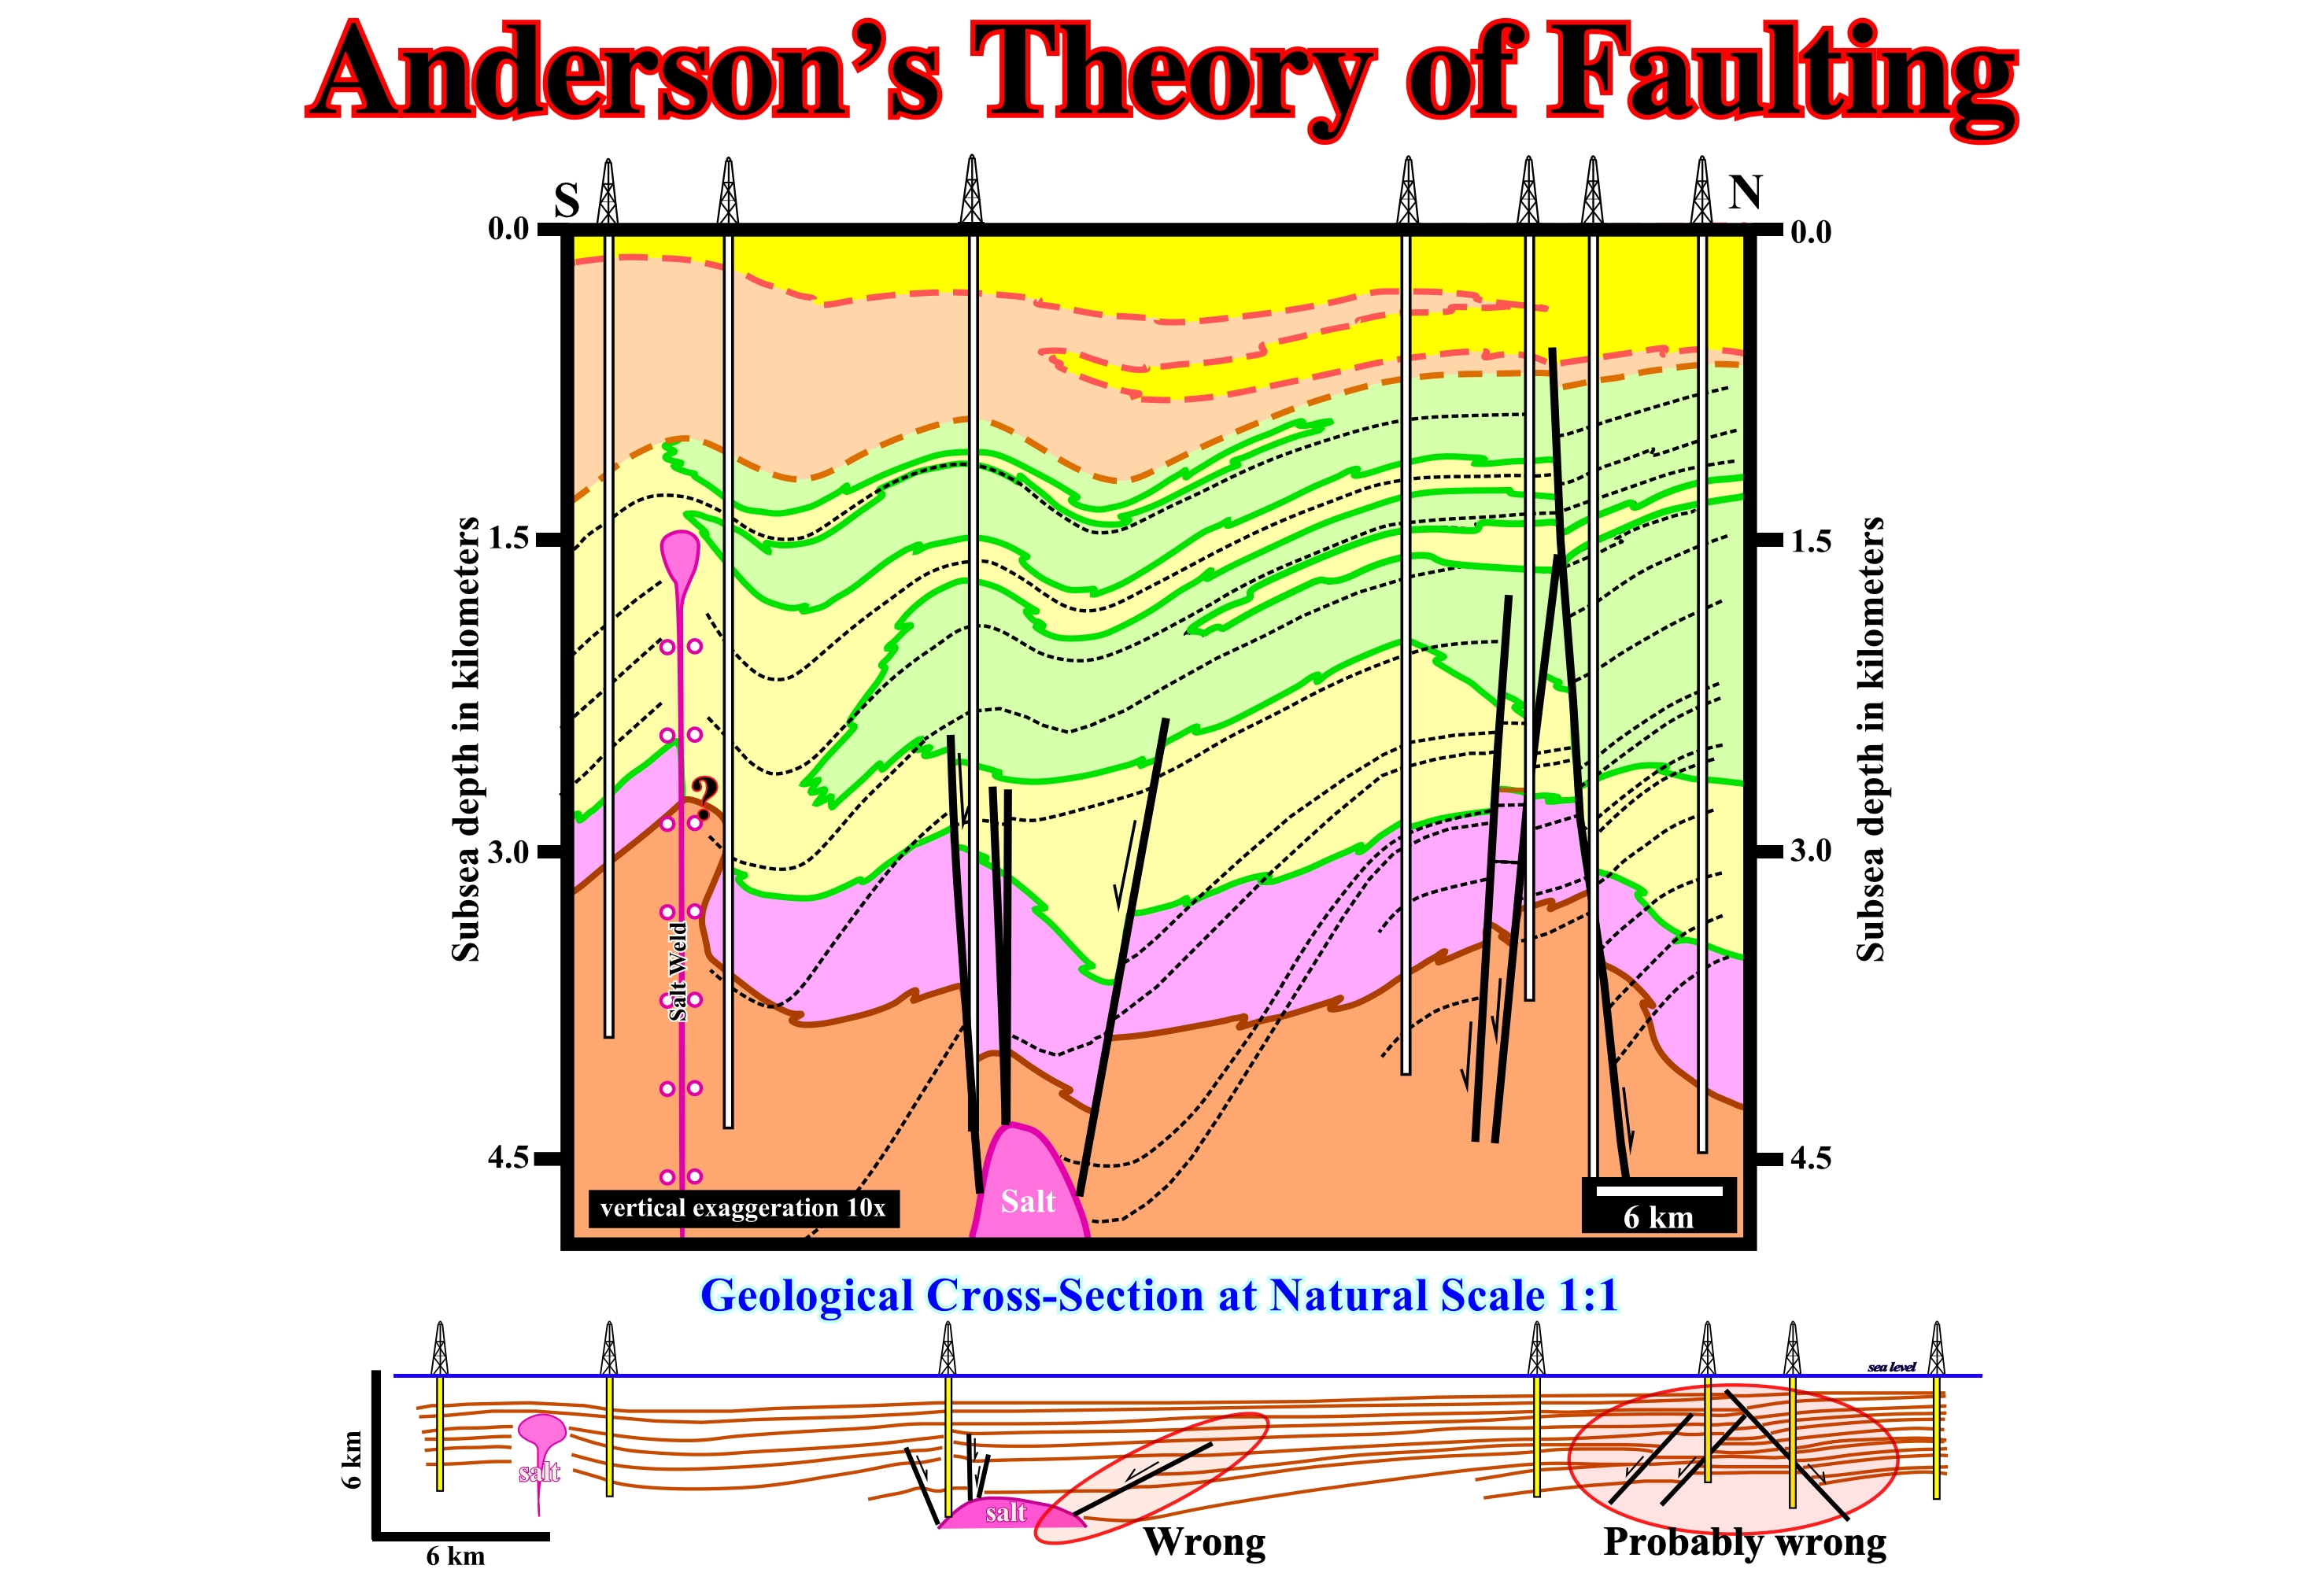
Figure 009- The above original cross-section, taken from a non-confidential geological publication, illustrates how dangerous is to forget the effects of the scale exaggeration and how fragile (easily falsified) is an uncritical geological cross-section or a tentative geological interpretation of a seismic line. The above geological cross-section is in depth (the vertical and horizontal scales are metric). The vertical exaggeration is around 10 x (ten times). Theoretically speaking means that the fault planes should be, more or less vertical, which is not the case. Particularly surprising is the dip of the four northern faults. A simple conversion of this cross-section at the natural scale (1:1), clearly refutes the trace of the fault planes. They do not respect the Anderson’s theory of faulting, i.e., the angle of the faults planes is too low, far away of the theoretically 60°. The faults are considered and described as normal faults, what seems to be quite likely, since they are induced by the lengthening of the sediments induced by salt diapirism. The overburden structures are antiforms (extensional structures) and not anticlines (compressional structures). In addition to the dip of the faults, the proposed cross-section is, also, refuted by the rectilinear geometry of the fault planes. The faults are assumed to be relatively old, predating the compaction of the sedimentary column, which correspond to a succession of sand and shale intervals. If that is so, what, for us, is not too evident, the picking of the fault planes cannot be rectilinear. Even if the original geometry (before compaction) of the fault planes was, more or less, rectilinear, after compaction, the dip of the fault planes will be smaller in the shale intervals (more compactable) than in the sand intervals (less compactable), which implies the development of a rollover (antiform structures), in the hangingwalls, in juxtaposition to the less compactable interval. Such a feature is used in sand-shale depocenters, as, for instance, in the Gulf of Mexico, by a lot of geoscientists to predict, in the footwalls, potential sand-prone reservoirs intervals and so potential morphological traps by juxtaposition (incorrectly called “traps against fault” by many geoscientists, see later). In the footwall of a normal opposite fault (the dip of the fault plane contrary to the dip of the strata), the geometry is quite favorable to trap hydrocarbons by juxtaposition (footwall reservoir-rock in juxtaposition against an hangingwall sealing-rock), if the geoscientist is able to localize the more likely potential reservoir-rocks in the footwall. Theoretically, the more likely location of footwall reservoir-rock intervals (less compactable intervals) is given by the more abrupt segments of fault plane picking. Summing-up: in field and on the seismic lines (the interval velocity increases in depth) there are no rectilinear pre-compaction faults and the dips of the fault planes, even taking into account the dip variations induced by sedimentary compaction, must obey to the Anderson’s theory of faulting.
The effects of the scale exaggeration are, also, quite evident on the seismic lines, not only because the vertical scale is in time and so completely different of the horizontal scale, which is metric, but also due to display reasons. The majority of the conventional seismic lines (either in time or in depth) have a vertical scale exaggerated between 3 - 5 times, as illustrated in the figure 010. Consequently, as said before, the dips and the thickness are not really. In addition the thickness of a seismic interval is, also, affected by lateral changes of the interval velocity, particularly if there is a lateral facies change (change in lithology).
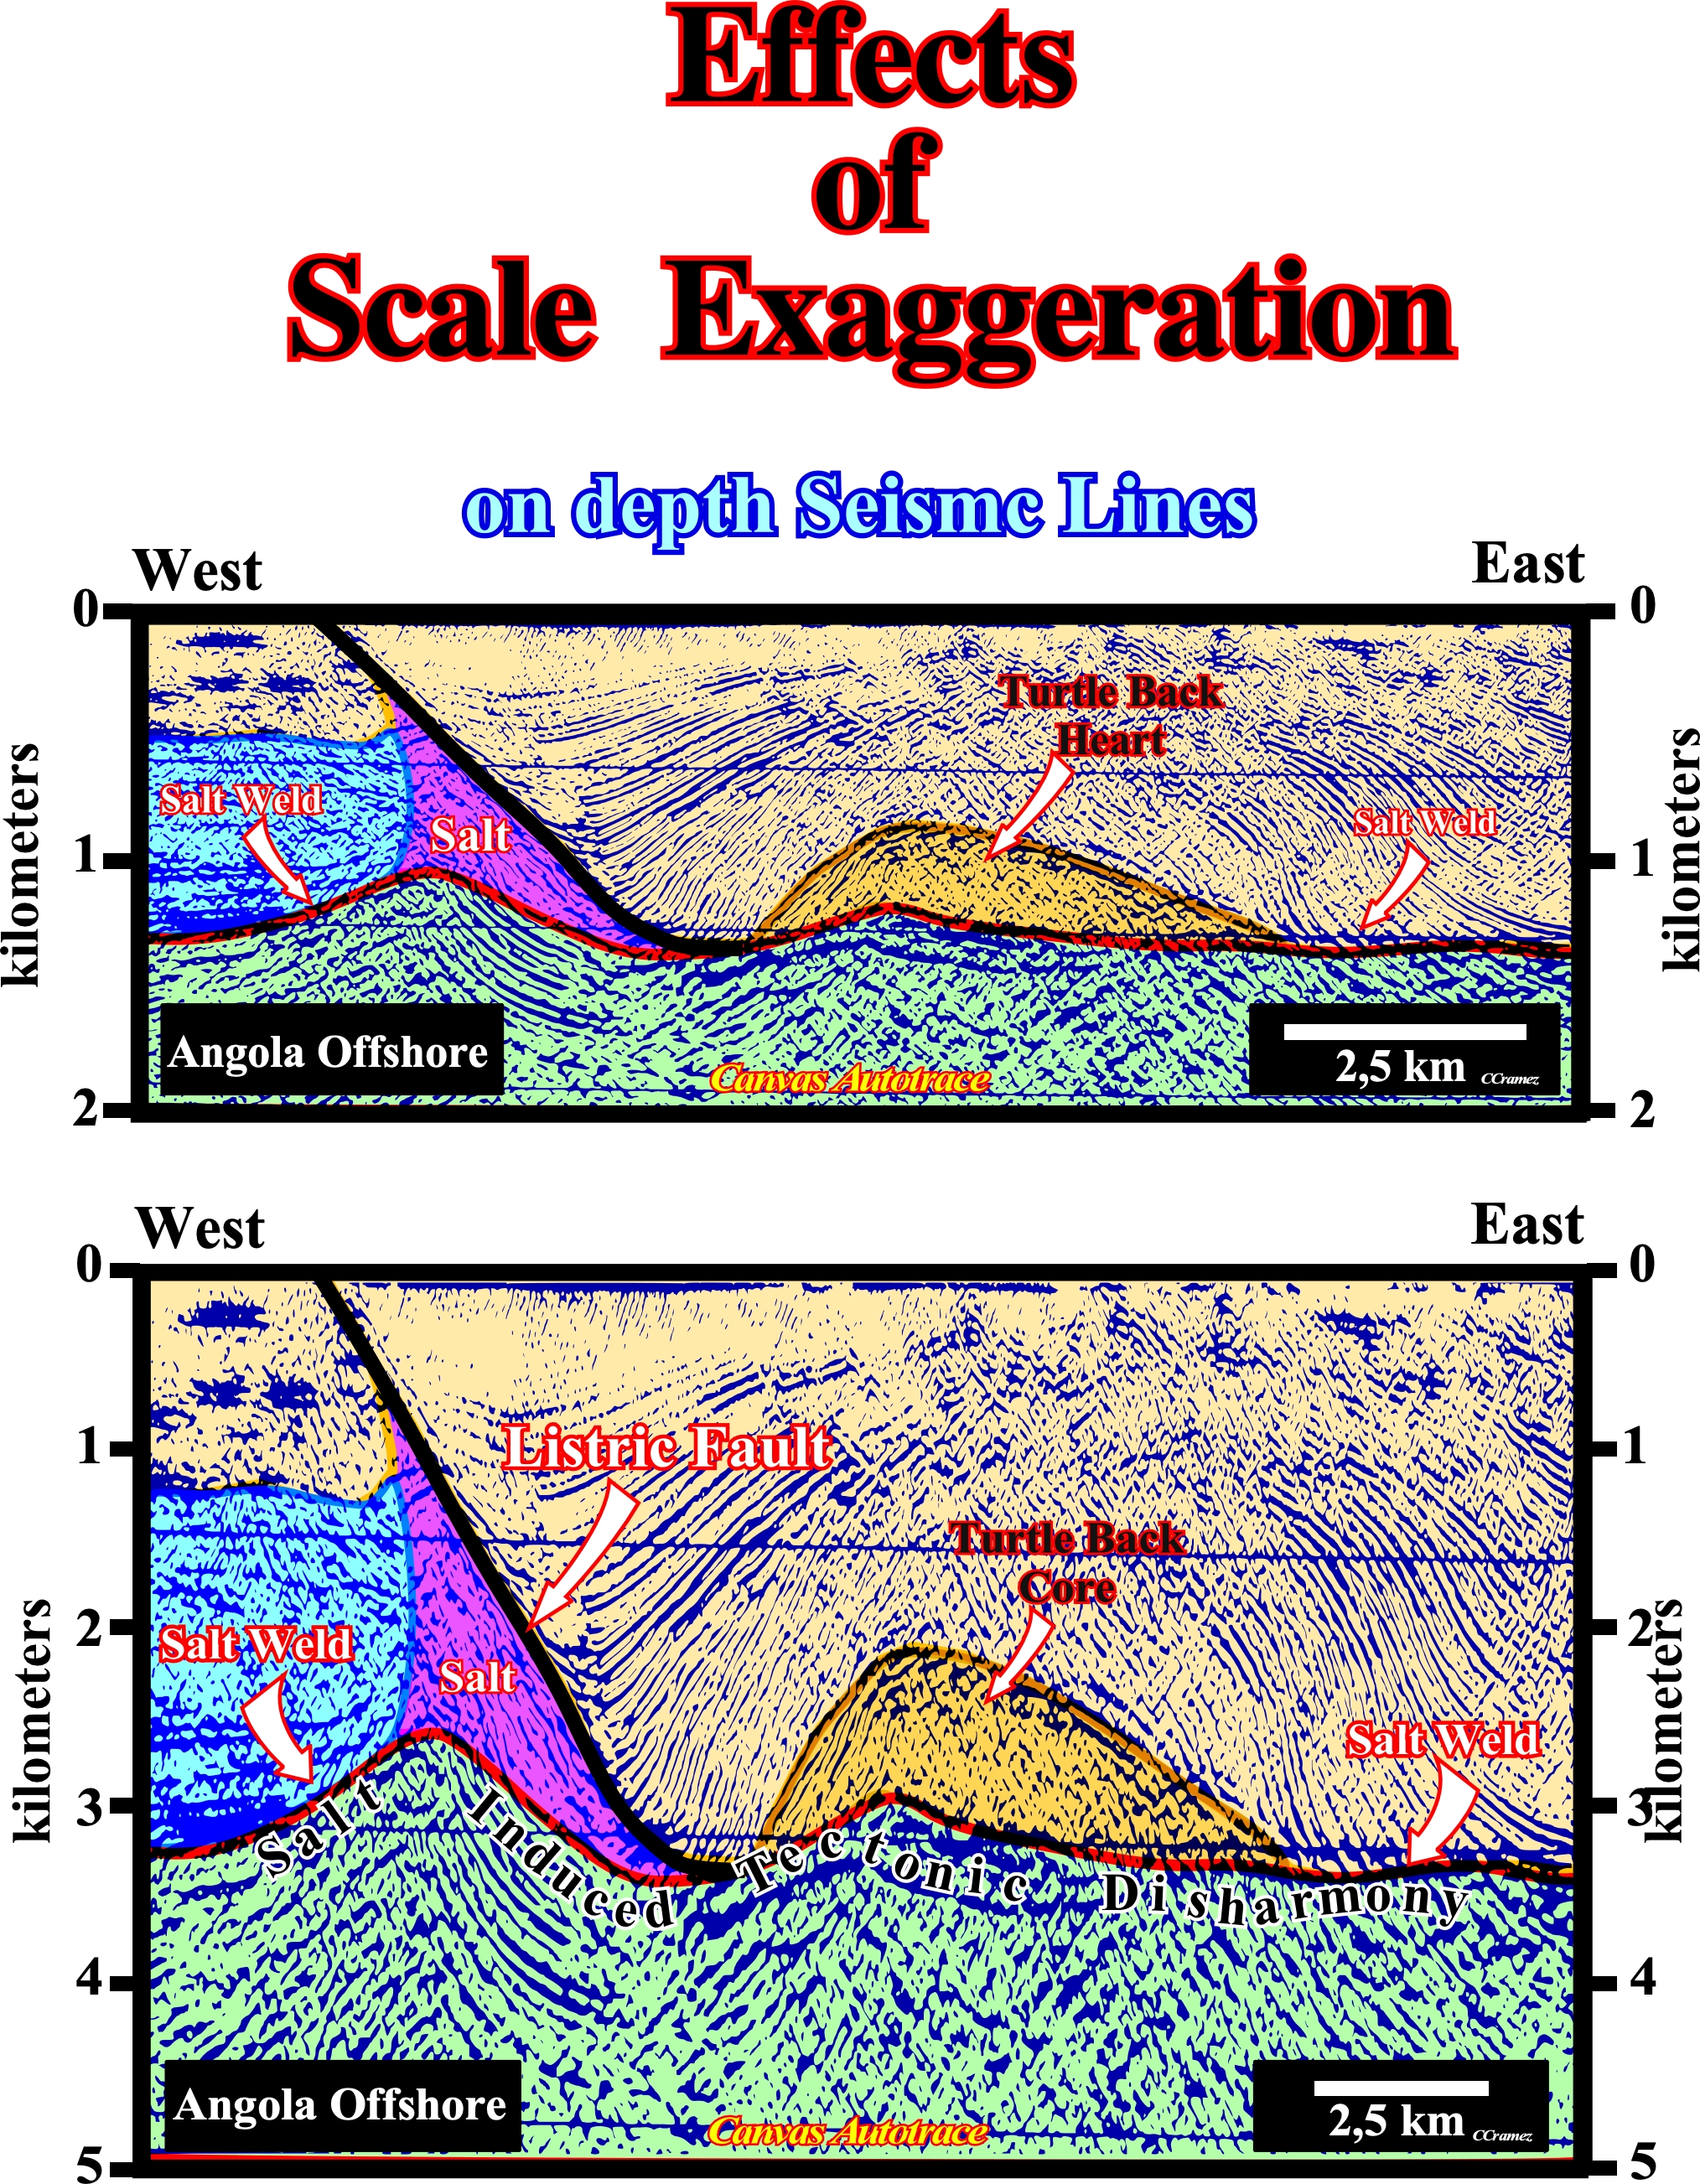
Figure 010- Both Canvas autotraces of an Angola offshore seismic line are in depth to remove the seismic pitfalls induced by the time vertical scale of the conventional seismic lines that will be discussed later. However, this time-depth conversion is not excellent. The tectonic disharmony induced by the salt interval, present in this offshore, should be, more or less, horizontal and not undulated. The same is true for the seismic reflectors underlying the salt roller below the listric fault (the term listric fault is here used as synonym of curvilinear fault, i.e., a fault which shallows with depth). The pristine definition a listric fault is a curvilinear fault that has a normal geometry in the upper part and reverse fault geometry in the lower part, as it is the case in a slumping. The Canvas autotrace on the bottom is at natural scale 1:1. The horizontal and vertical scales are equal. The dips of the seismic reflectors are real, as well as, the dip of the fault plane bordering the depocenter above the western turtle back flank. On upper Canvas autotrace, the vertical scale is exaggerated 2.5 x, in relation to the horizontal scale. The thickness between the chronostratigraphic lines (reflectors), as well as, the dip of the reflectors are no real. They are too exaggerated.
If a geoscientist (observer) does not know the scale of the observed, all proposed geological interpretations will be wrong (serendipity exists, but it is uncommon). This is, particularly, true when a geoscientist tries, tentatively, to interpret seismic data, in geological terms, in a naive personal manner. Never forget that you do not see with your eyes by with your brain. In fact, just before, you looked at the lower tentative geological interpretations of the seismic line illustrated in figure 010, electromagnetic waves, in the form of white light, illuminate the tentative interpretation. Part of the white light is absorbed and part reflected. Specific wavelengths enter your eyes, stimulating the retinal cells, causing complex chemical and electrical changes in your brain and end up at the visual center at rear of your brain. So, you see with your brain an internal representation of the tentative interpretations and not the reality. If your brain had already stocked an image of a turtle-back, i.e., if you know what is a salt induced turtle-back structure, you recognize it, easily, on the tentative interpretation. On the contrary, if you brain has not yet in stock the image of a turtle-back, i.e., if you do not know, a priori, what is a turtle-back structure, you can look at the tentative interpretation during hours and you never see a turtle-back. In fact, you see just what you know or, in philosophic words, "Theory precedes Observation" (K. Popper 1934). By the same token, the clean Canvas autotrace of a seismic line used on a tentative geological interpretation, i.e., the Canvas autotrace not interpreted, represent, in time, a copy of a copy of the reality. In addition, not every geoscientist sees the same colors that you see on theses tentative geological interpretations (adapted from Robinson, D. 2005).
A geological hypothesis or conjecture can be refuted, corroborated or validated, but never verified. Corroboration is not synonym of verification. A hypothesis can be corroborated by observations and experiments, but it can, never, be verified. The truth in Science does not exist. It is impossible to demonstrate the truth of any proposition, except in a closed system. Geological models are never closed systems. Observation and measurements have both independent and dependent variables. They are laden with inferences and assumptions.
Using the next figure 011, you can, easily, test the following conjecture:
“If a geoscientist (observer) does not know the scale of the observed (seismic line, for instance), all proposed geological interpretations will be wrong”:
(i) Take a look at the figure 011, disregarding the tentative geological interpretation of the Canvas autotrace of the seismic line with scales (do not cheat).
(ii) Using the preliminary tentative geological interpretation on top (Canvas autotrace without scales) try to propose a geological interpretation for the progradations within the yellow interval.
(iii) Then, try to refute your interpretation using the tentative interpretation illustrated on the bottom of the figure.
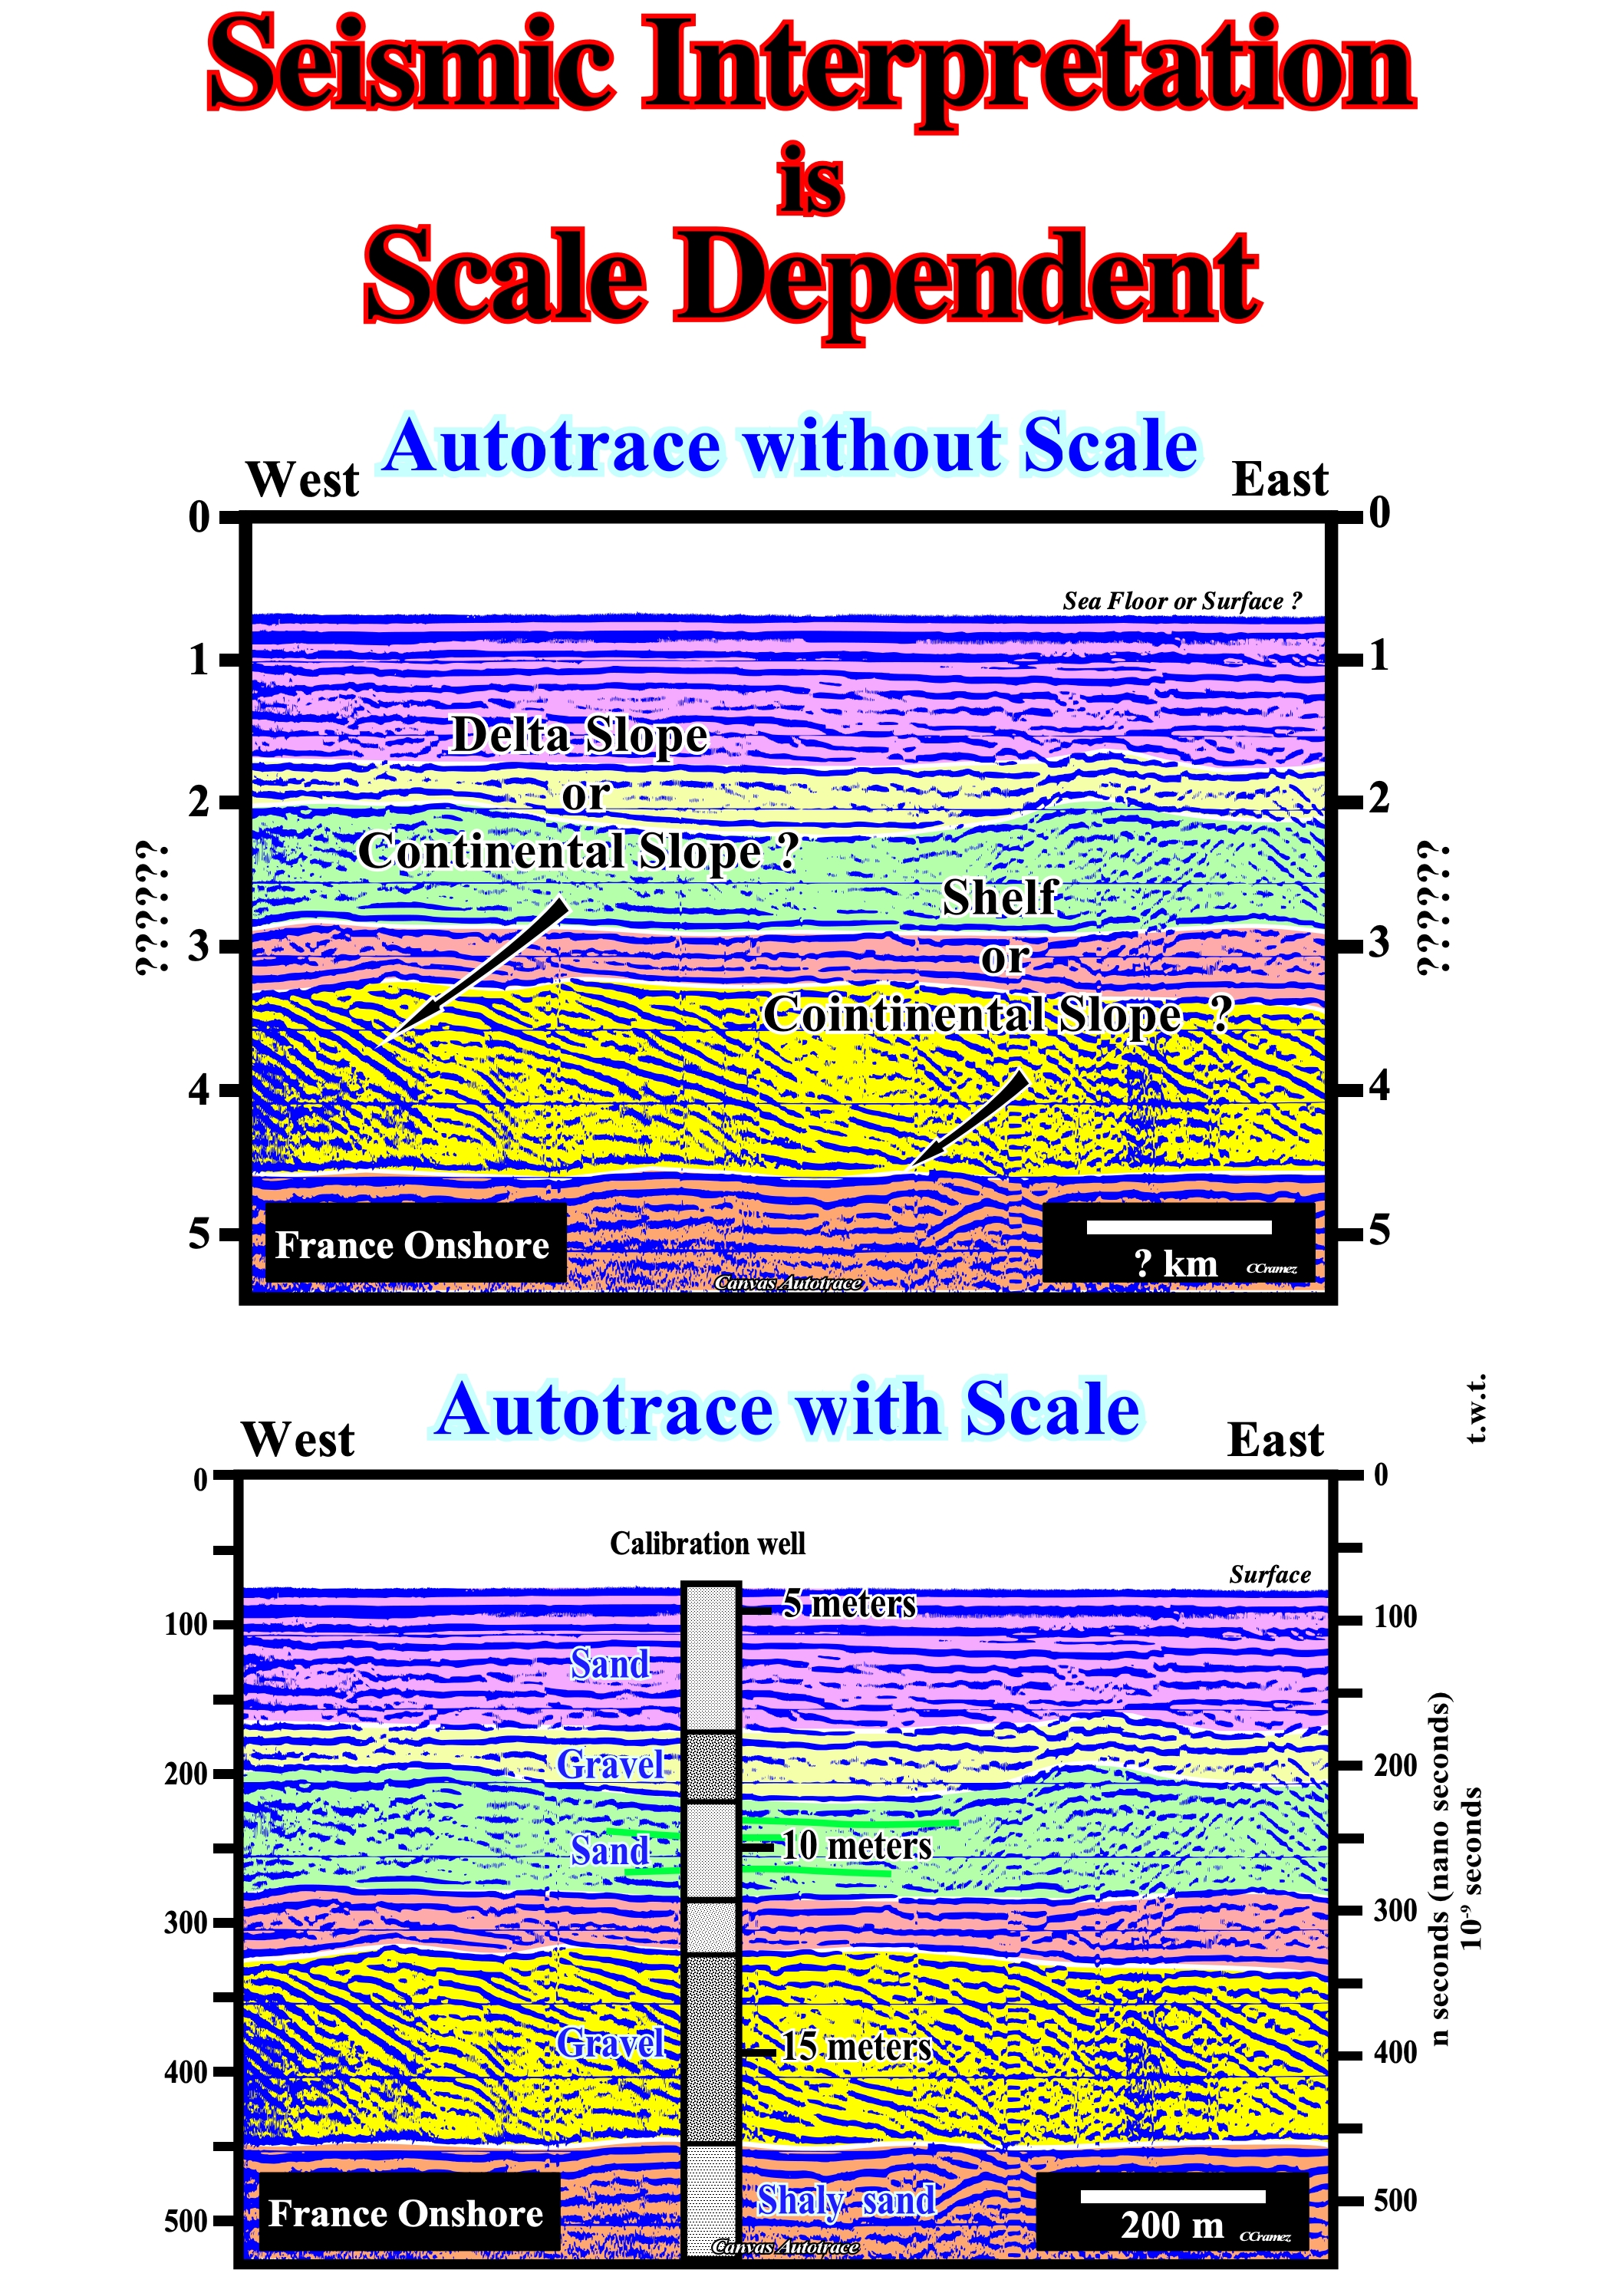
Figure 011- The Canvas autotrace in the top does not have the horizontal scale, which is, probably, in meters or kilometers and, also it does not have the vertical scale, which, generally, is in time (most often in seconds). All tentative geological interpretation of this autotrace and particular of the dipping reflectors, will be just a guess with a strong probability of refutation by new data. Unknowing the slope amplitude of the oblique progradations (upbuilding without outbuilding) visible within the yellow interval, a geoscientist cannot decide if the progradations correspond to delta slopes, continental slopes or other depositional slopes. Taking a look at the seismic line on bottom, not only he will realize that the horizontal scale is around 200 meters and the vertical scale is in nanoseconds (normal vertical scale of georadar lines). Subsequently, he can advance the hypothesis that the progradations correspond to oblique stratifications, which is not falsify by the results of the well located on the seismic profile.
In order to interpret seismic lines, in geological terms, the data must always have the scale (the preference a graphic scale) and the geoscientist must known at what geological realm the data belongs : (i) Microscopic ; (ii) Mesoscopic5 or (iii) Macroscopic.
The microscopic realm, as its name suggests is the domain of objects and events smaller than those that can, easily be seen by a naked eye. It is the domain of the optical mineralogy and petrography, in which geoscientists study thin sections, i.e., laboratory preparations of a sample around 30 μm thick of a rock, mineral, etc.
The mesoscopic realm, as considered by C. E. Wegmann (1950), is the domain of the continuity as observed in the outcrops, in which geologic features can be observed in continuity. In geology, the mesoscopic realm is a direct consequence of the old geological principle of the lateral original continuity (the sedimentary taper to disappear by onlap or downlap against the edges of the original depositional areas), which is still valid and states : “The sedimentary layers are deposited in lateral continuity”. However, it admits that the lateral continuity of sediments may disappear (break in continuity) due to erosion or tectonic movements. In fact, sediments, at time of deposition, are connected, but they can after be separated, for example, due to the formation of a river valley. Unconformities (time-gaps) may represent simply prolonged periods of subaerial exposures with minimal erosion, possibly with local valley or channel downcutting. They may represent periods of uplift and major subaerial erosion of strata or representing submarine erosion by turbidites, slump or submarine currents. Such discontinuity, which defines the limits of the mesoscopic scale, so evident today was very difficult explain the seventeenth century.
5 In physics, the mesoscopic scale is a subdiscipline of condensed matter which deals with materials of an intermediate length scale, between the size of a quantity of atoms and of materials measuring micrometers.
The macroscopic realm is the domain of the geological and seismic maps, as well as, of the seismic lines, in which, generally, there is not continuity of geological and seismic features. Such discontinuity is, particularly true, on the seismic lines, in which, generally, the sequence-cycles and continental encroachment subcycles cannot be picked in continuity. The same happen with seismic reflectors (chronostratigraphic lines) and unconformities (erosional surfaces), since there is a lateral change of the acoustical impedance. Taking into account that there is a self-similarity in geological features and that they are scale invariant, it is at the macroscopic realm, when using seismic data, that geoscientists should avoid realm misunderstandings, as for instance, do not take an oblique stratification (mesoscopic realm) as a delta slope (macroscopic realm) or as continental slope.
Summing up : A geoscientist should never work on seismic lines or geological maps without scale and location. Likewise, he should avoid to show in a presentation or in a report (except for confidentiality reasons) geological or seismic data without scale. All tentative geological interpretations must be falsifiable, i.e., scientific and not metaphysical (the following statement: “all source-rocks are rich in organic matter” is metaphysical, since it can not be refuted) otherwise the geoscientist and the company for which he is working never make progress in petroleum exploration. Not only a geoscientist must, always, criticize his tentative interpretations, but he must give the opportunity to others to do the same, but for that he must to put the right scale and right location on the data: “Geological interpretation is scale dependent" and "Petroleum Exploration knowledge progresses by trial and error”