

4) Seismic Lines are Time Profiles
Geoscientists forget, often, that a seismic line looks like a geological cross section, but its vertical scale is in time (t.w.t.) and not in meters. A lot of corrections must be take into account.
When you look at a tentative geological interpretation of a seismic line, obvious, you are not seeing the real tentative geological interpretation. Looking at a seismic line (interpreted or not) is not just a process of passively receiving sensory data, but a much more complex process of receiving, selecting and categorizing information.
In fact, when you look at the clean seismic line illustrated in the upper part of figure 019, as said previously, electromagnetic waves, in the form of white light, illuminate the line. Part of the white light is absorbed and part reflected. Specific wavelengths enter your eyes, stimulating retinal cells, causing complex chemical and electrical changes in your brain and end up at the visual centre at rear of your brain. So you see with your brain an internal representation and not the real line. In addition, the clean seismic line itself represents, is a copy of the reality obtain by a reflection seismic survey8.
8Reflected waves from the interfaces between materials of significant different elastic properties (density and seismic velocity) are used for this type of survey. More specifically, a special acquisition and processing method called the “CDP (common-depth-point) method” is used and the final product from this survey is a section that depicts a cross-sectional image of the subsurface below the surveyed line. This kind of seismic survey is based on the theory of elasticity and therefore tries to deduce elastic properties of materials by measuring their response to elastic disturbances called seismic (or elastic) waves. A seismic source such as sledgehammer is used to generate seismic waves, sensed by receivers deployed along a preset geometry (called receiver array), and then recorded by a digital device called seismograph. This seismic surveys, typically, use compressional waves, which are, also, known as P-waves, which waves are the fastest waves and first to arrive and be recorded by instruments (P-waves are also pressure waves ; each P-wave cycle contains a compression and extension component). The signals are recorded (time) and later processed into images of the underground geology, which may be interpreted for oil and gas exploration, development and production purposes.
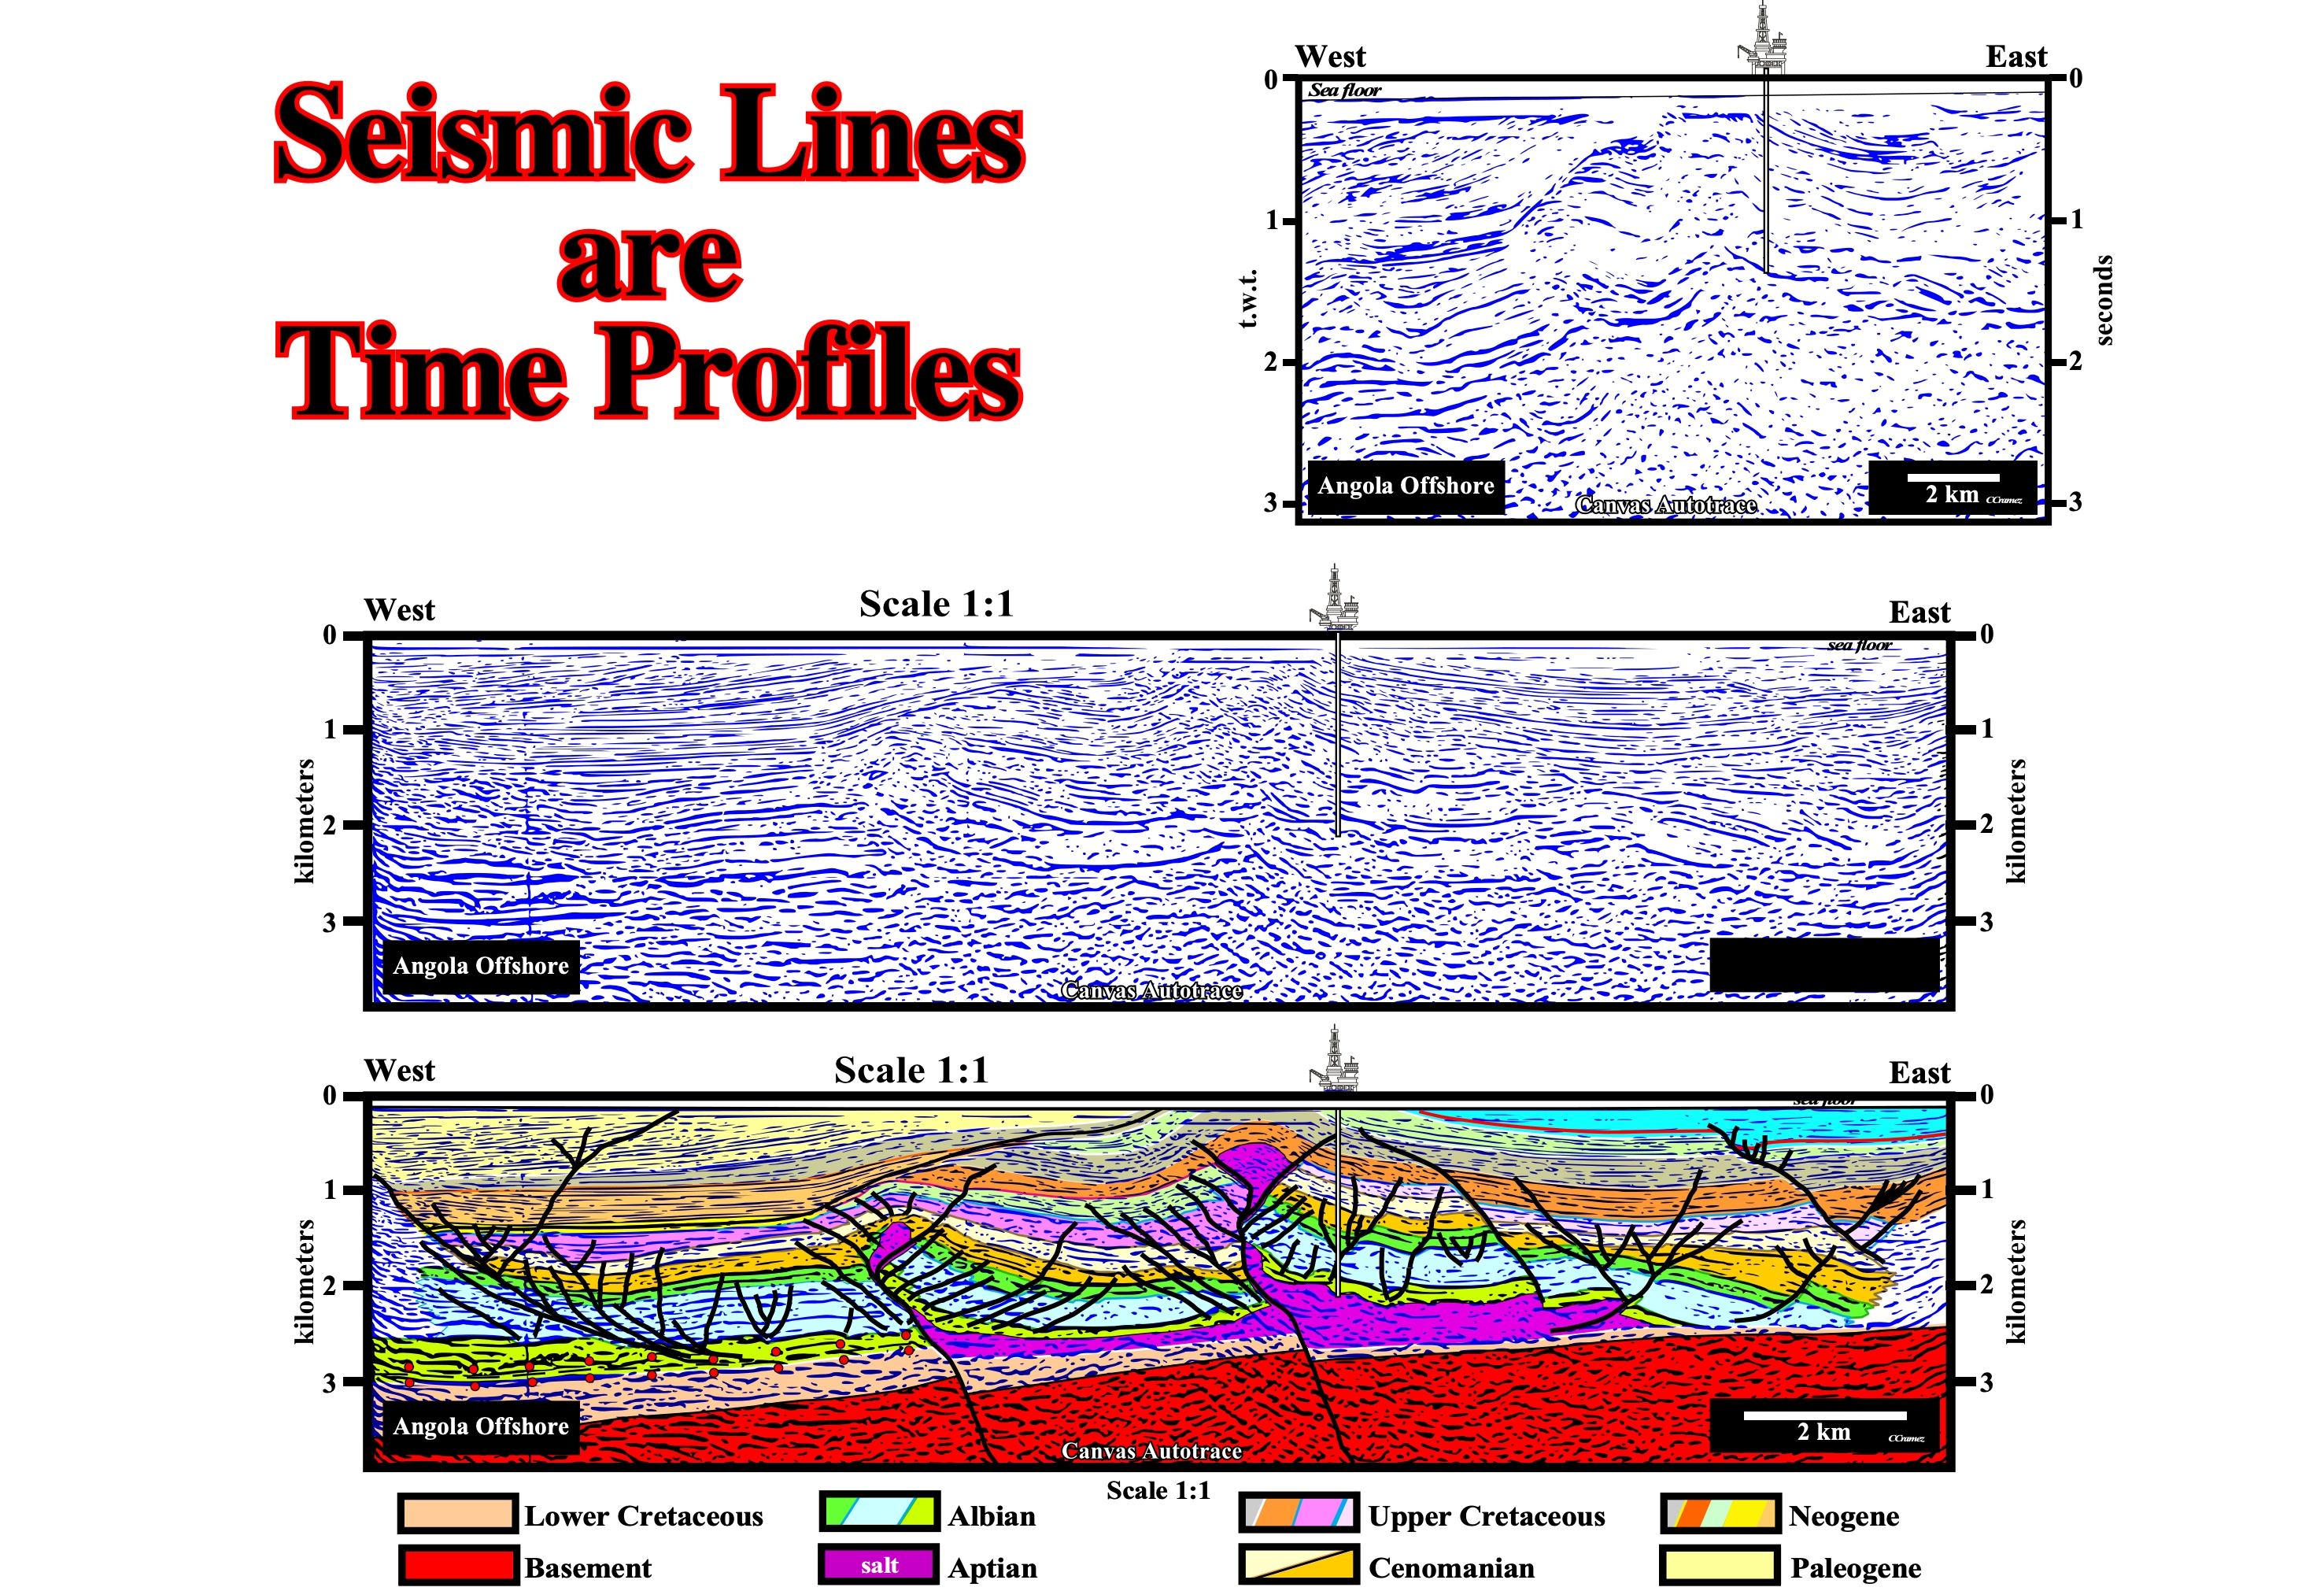
Figure 019- The Canvas autotrace of a conventional seismic line of the Angola offshore, illustrated in the upper part of this figure, is obvious in time. The vertical scale is in time (here in seconds two way time), while the horizontal scale is metric (kilometers). Consequently, your brains are seeing an internal representation of a seismic line that does not represent a copy of the reality because it is in time and vertically exaggerated (probably 2-3 times). Looking at the Canvas autotrace illustrated in the middle of the figure, your brain is seeing an internal representation of a seismic line representing a copy of the geological reality, since it is in depth (scale vertical in kilometers) and at natural scale (1:1). A tentative geological interpretation of the depth line is proposed in the bottom of the figure.
As the majority of the seismic lines used in petroleum exploration are in time, the visual center or visual cortex9 of the geoscientists, in charge of the their geological interpretation, sees an internal representation of a seismic line that does not correspond to a copy of the geological reality (the geological reality, scale 1:1, can never be depicted by a time seismic line, since it has two category of scales (time and length). Consequently, when geoscientists “see”, on a conventional seismic line, a seismic interval with a constant thickness, he is never sure that the real geological interval has a constant thickness. He can and must advance a hypothesis, but he must, imperatively, test it, i.e., try to refute it, as illustrated in figure 010.
9The part of the cerebral cortex responsible for processing visual information, which is the part of the central nervous system which gives organisms the ability to process visual detail, as well as enabling the formation of several non-image photo response functions. It detects and interprets information from visible light to build a representation of the surrounding environment. The visual system carries out a number of complex tasks, including: (i) Reception of light and the formation of monocular representations ; (ii) Buildup of a nuclear binocular perception from a pair of two dimensional projections ; (iii) Identification and categorization of visual objects ; (iv) Assessing distances to and between objects and (v) guiding body movements in relation to the objects seen.
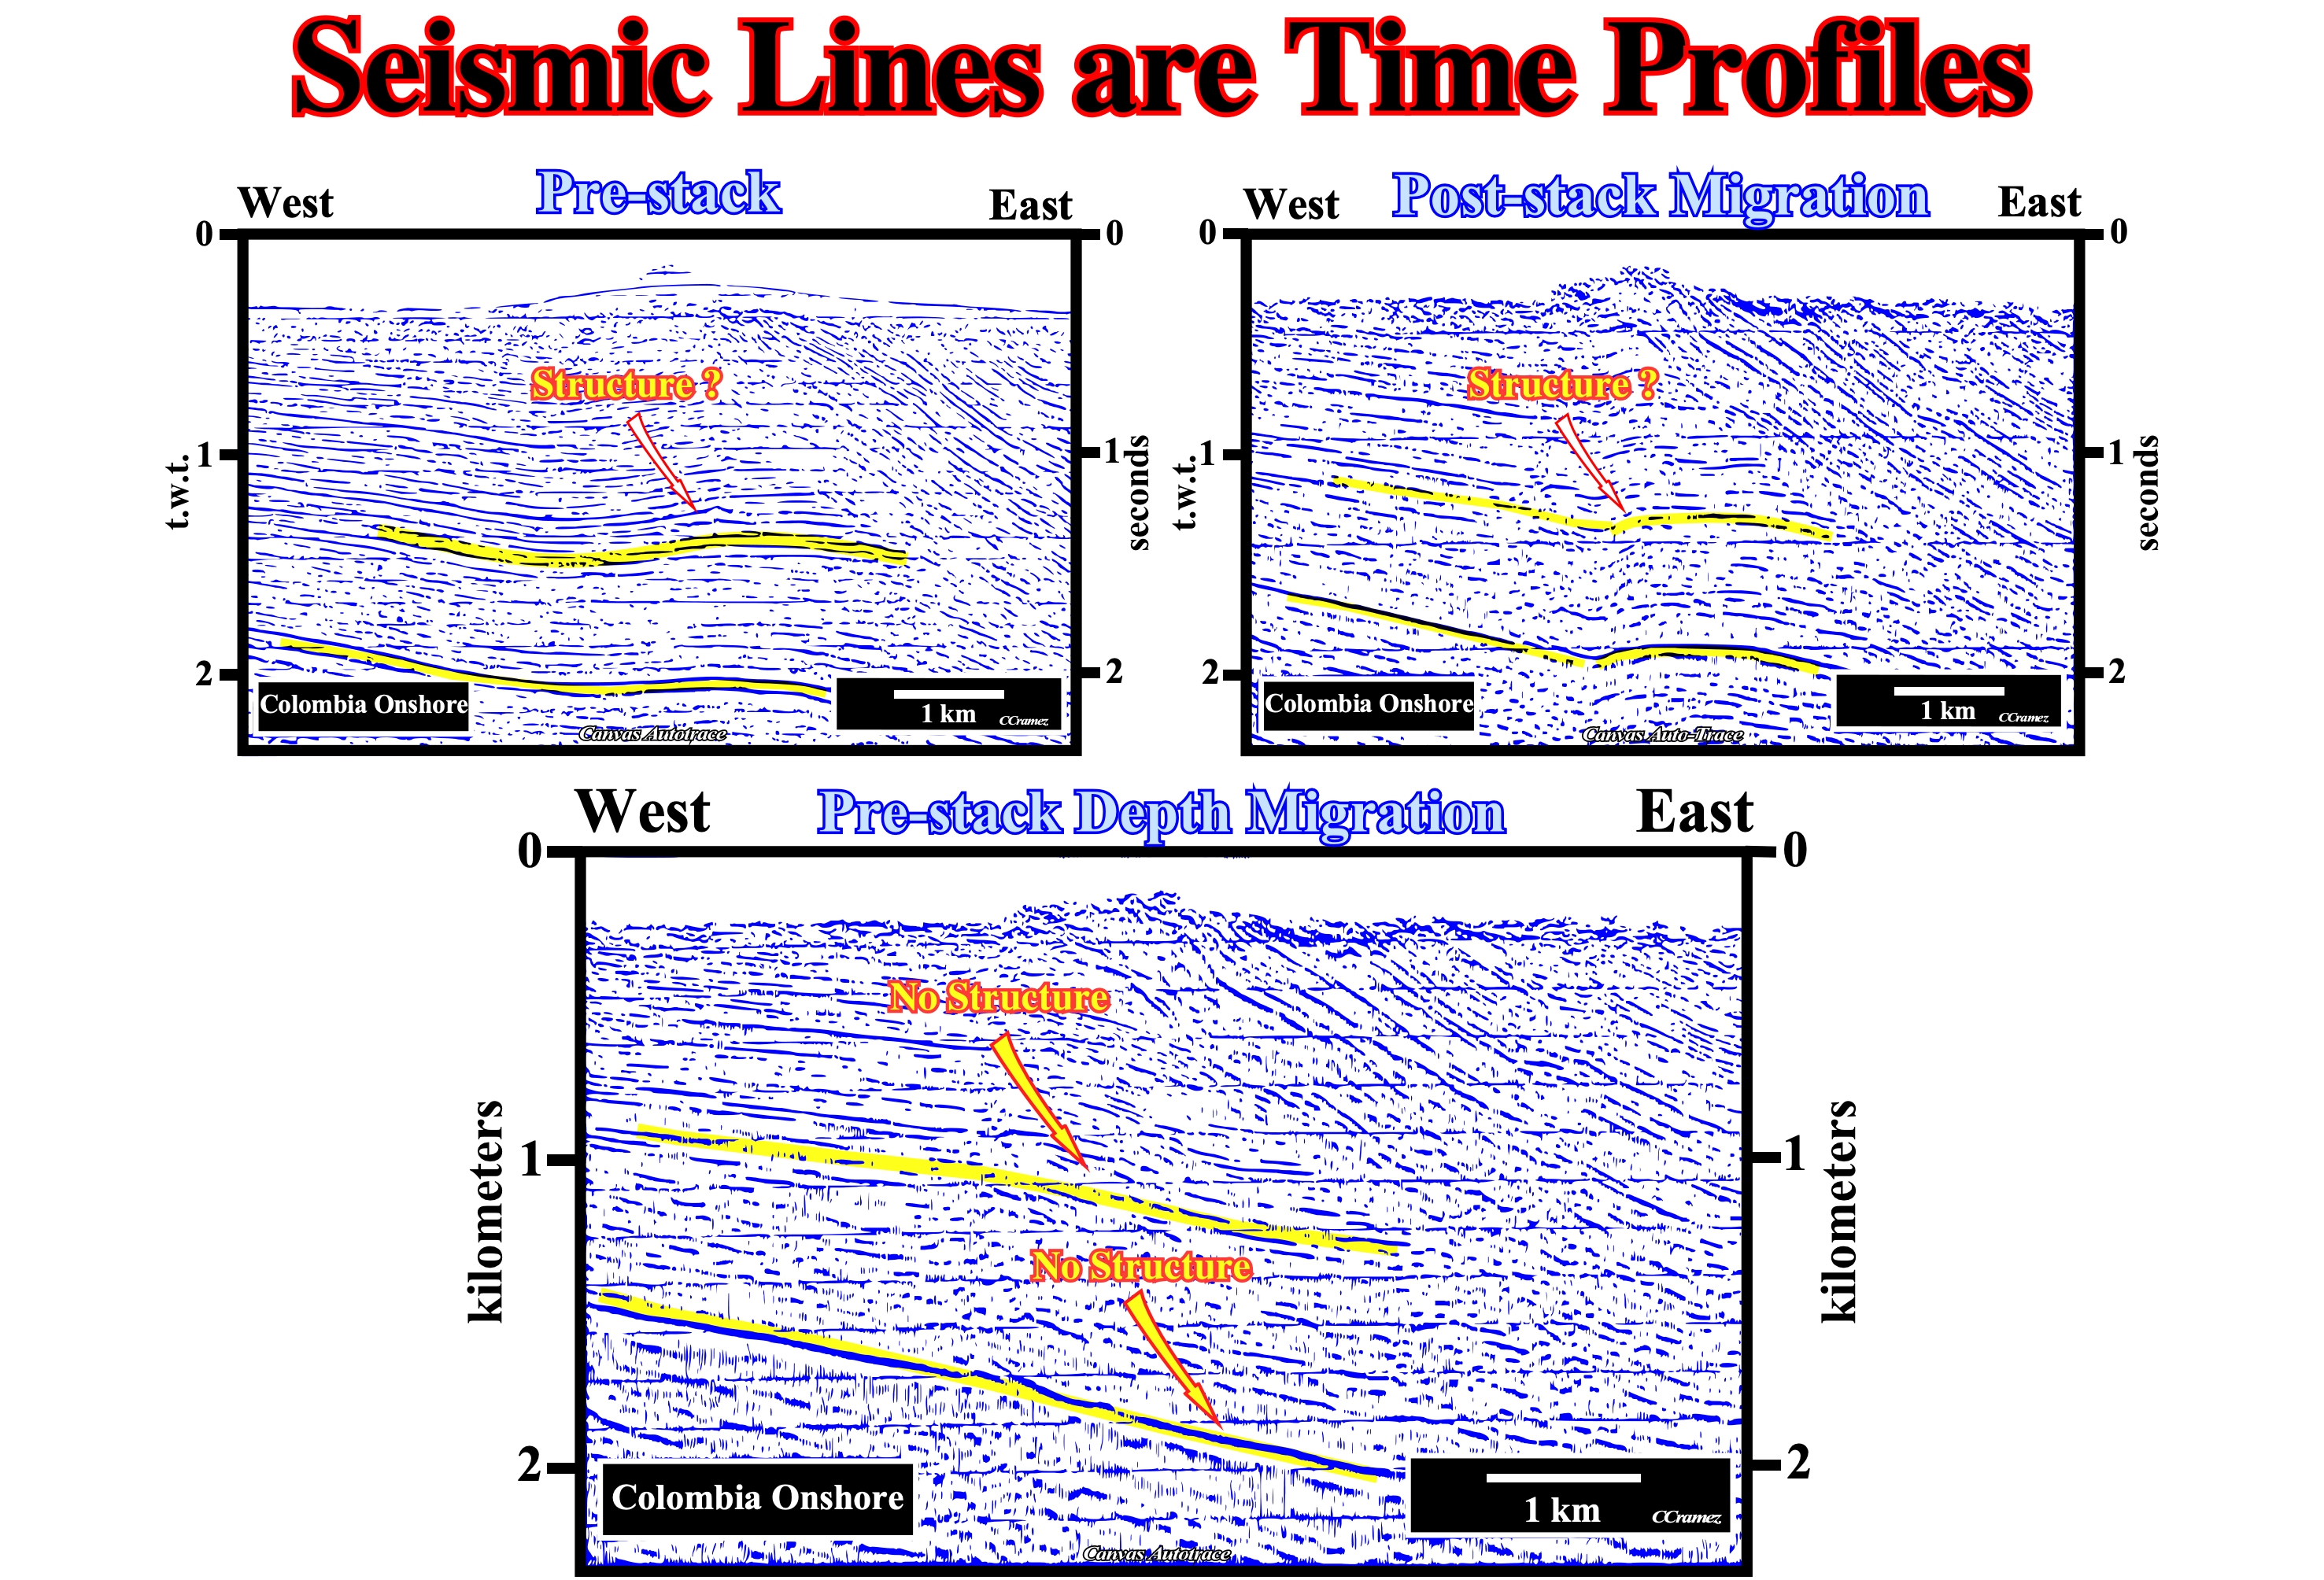
Figure 020- In the internal representation of a pre-stack version of a seismic line from Colombia onshore (Canvas Autotrace), the brain of a geoscientist recognized (after identification and categorization of the internal representations) a seismic interval, between to yellow horizons (not all geoscientists see the yellow ; some see our “yellow” as their “gray”) slightly thickening eastward. In addition, the boundaries of such a seismic interval are undulated forming a potential antiform structure. As the geoscientist knew that is working with time lines, he was obliged to test what he “saw”. The first step of such a falsification test, was to make a post-stack migration version of the lines. In the post-stack migration version, the geoscientist “saw”, more or less, the same internal representation : (i) The antiform structure looked more sharp, but, just, located, under the reverse fault plan ; (ii) The eastward thickening of the seismic interval was not so evident as in the pre-stack version, as illustrated above. However, as post-stack migration version10 is, also, in time, it cannot be considered as a copy of the geological reality, the geoscientist was obliged to order a pre-stack depth migration version. Astonishingly, the antiform structure, located in the lower faulted block (footwall), below the reverse fault plane, disappeared. In spite of the fact, that the pre-stacked depth migration version was not at natural scale 1:1, as illustrate above, it could be considered as an approximate copy of the geological reality. Consequently, the geoscientist abandoned the interpretation of the firsts internal representation and took as most likely interpretation a reverse fault, with an undeformed thinning upward seismic interval in the footwall.
10Post-stack migration is the migration done on stacked section as indicated by its name. This migration is based on the idea that all data elements represent either primary reflection or diffractions. This is done by using an operation involving the rearrangement of seismic information so that reflections and diffraction are plotted at their true locations. The variable velocities and dipping horizons cause the data to record surface positions different from their subsurface positions. So, migration is needed to move reflections to their true subsurface locations.
Summarizing : Geoscientists must never forget conventional lines are time lines and so they must, always, try to falsify their tentative geological interpretations. Such falsification tests are not necessary always depth conversions, not only because they are too expensive, but also because they require a good knowledge of the velocity intervals, which requires drilling data. Often, the knowledge of the geological setting and a simple mental and approximative depth conversion is enough to refute naive tentative interpretation, as for instance in offshore lines showing abrupt changes in water depth, as we will see later (chapter 14).