Porto, Portugal
Contents:

3.1- Salt Anomalies
3.2- Formation and Evolution of a Salt Dome
3.3- Withdrawal of the Dome’s Flanks
3.4- Vertical Pressure Within and Outside a Dome
3.5- Vertical Pressure Dome versus Overburde
3.6- Intrusive and Extrusive Salt Dome
3.7- Geological Model of a Salt Dome (Without Extension)
3.8- Geological Model of a Salt Dome (With Extension)
3.9- Stretching Faults
         3.9.1- Currie’s Model
         3.9.2- Ellipsoid of Effective Stresses
3.10- Dome Perturbation’s Wavelength
        3.10.1- Domes’ Wavelength
        3.10.2- Exploration Implications
3.11- Autochthonous and Allochthonous salt
        3.11.1- Goguel’s Experiment
        3.11.2- Jackson’s Experiment
        3.11.3- Kavir Diapir Province
                   (i) Diapirism Without Posterior Folding
                  (ii) Folding Followed by Diapirism
        3.11.4- Allochthonous Salt
                  (i) Salt Sheet
                  (ii) Salt Laccolith
                  (iii) Salt Sill
                  (iv) Salt Tongue
                  (v) Second-Cycle Diapir
                  (vi) Third-Cycle Diapir
                  (vii) SaltCanopy
                  (viii) Salt-Stock Canopy
                  (ix) Salt-Wall Canopy
                  (x) Salt-Tongue Canopy
                  (xi) Salt Suture
                  (xii) Salt Glacier
        3.11.5- Allochthonous salt and Extension
        3.11.6- Salt Intrusion Mechanisms
        3.11.7- Basinward Evolution of Allochthonous Salt.
        3.11.8- Allochthonous Salt in Gulf of Mexico
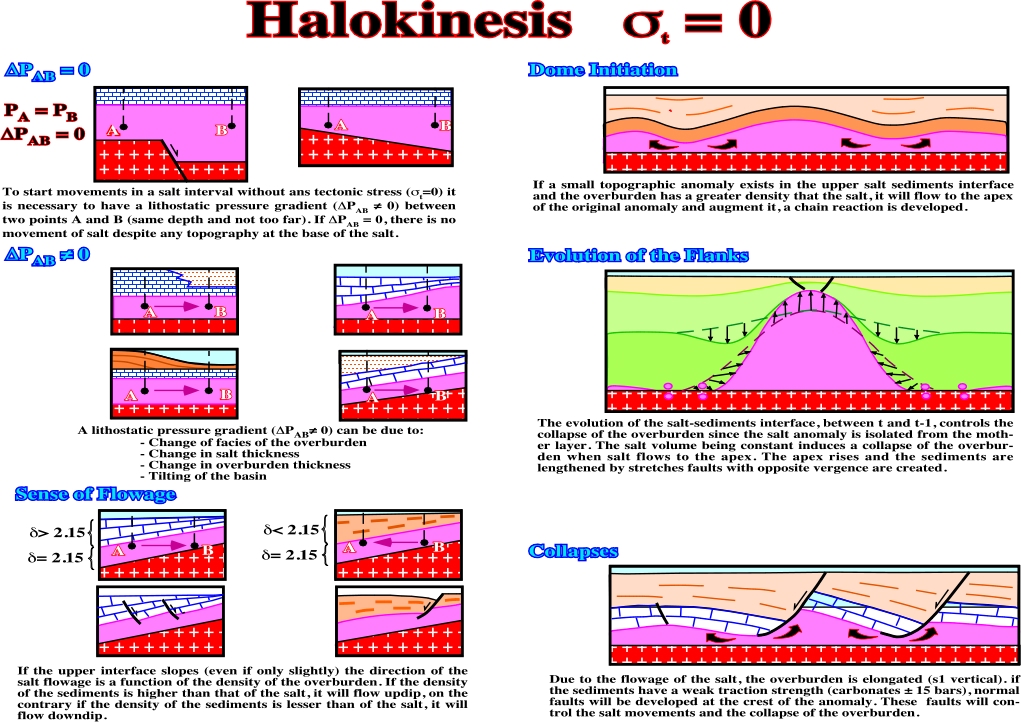
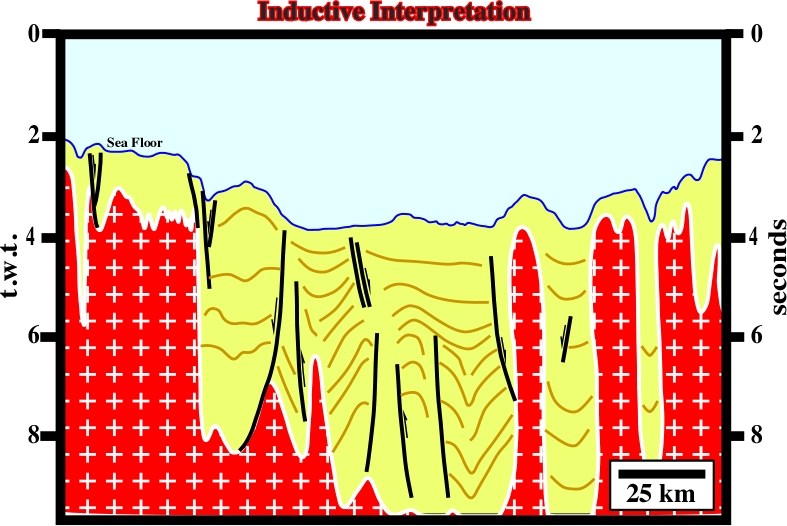
Whenever a small anomaly exists at the top of the salt (a mound, for instance), and the overburden is relatively thick, the salt flows simultaneous up all the flanks toward the crest of the anomaly forming a small dome. Irregularities in the salt-overburden interface produce divergent slopes on the surface of the salt, which creates an anomaly. Then, anomalies will be formed by chain reaction, and the mechanism remains the same even if the irregularities are of small amplitude. Actually, the smaller they are the longer it takes for domes to develop (fig. 55).
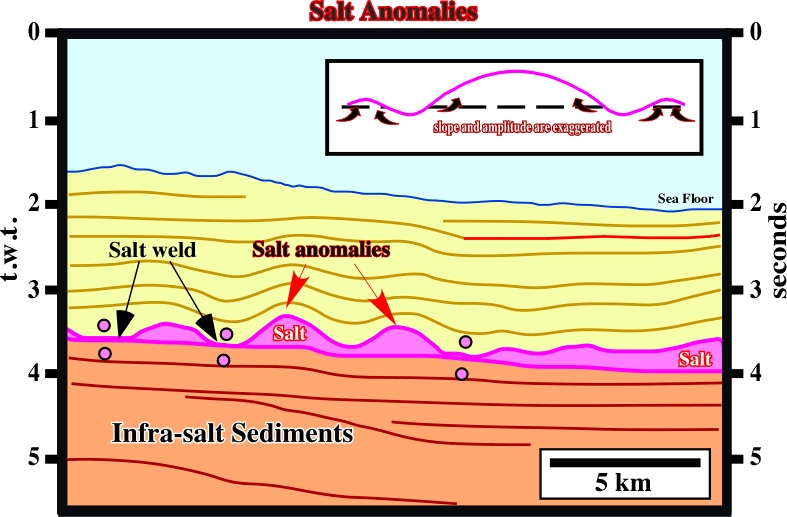
Fig. 55- On the left part of the line, Messinian salt anomalies (undulations) are easily recognized. They have a more or less similar amplitude, which seems to be big enough to break, by traction, the bottom of the overburden, particularly when its facies is compact sandstones or carbonates.
3.2- Formation and Evolution of a Salt Dome
If the sedimentary section deposited between, and above, the salt anomalies (see 3.1) is thick enough, the average density of the sediments forming the overburden may becomes greater that the salt density (around 2.15-2.17). The weight of the overburden forces the salt to migrate towards the top of the anomalies because the thickness of the overburden decreases from the flanks towards the top. The force, obliging the salt to migrate upward, decreases from the flanks to the top. In addition, the thicker the overburden, the denser it is and the greater is the force obliging the salt to migrate. The force acting upon the salt is greater at the deepest part of the salt-overburden interface. Therefore, it is logical that the maximum sinking of the sediments takes place on the dome’s flanks where the salt has been evacuated.
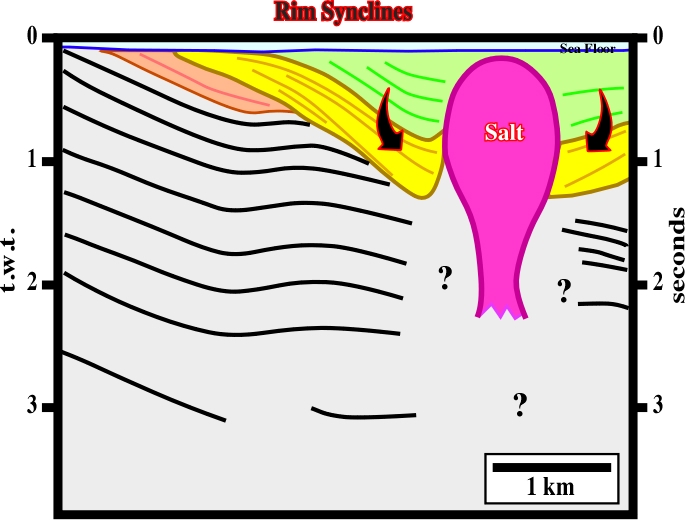
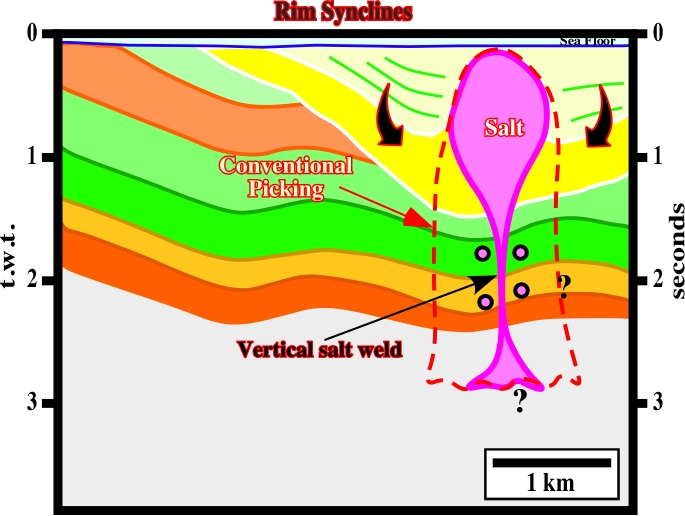
Fig. 56- The rim synclines recognized on each side of the salt dome, are the result of a compensatory subsidence induced by salt flowage from the flanks of the dome toward the top. Subsequently, if such a hypothesis is correct, the picking of the domes’ flanks cannot be made by an inductive interpretation approach, but only by a rational hypothetical-deductive approach (Descartes and Bacon represent two forms of reasoning: deduction and induction. Deduction is the method used to show that one theory follows from another. Induction is the method of inferring a general rule from few cases) (see fig. 57).
3.3- Withdrawal of the Dome’s Flanks
The sketches illustrated in fig. 60 and 61, depict the withdrawal of the flanks of a salt dome.
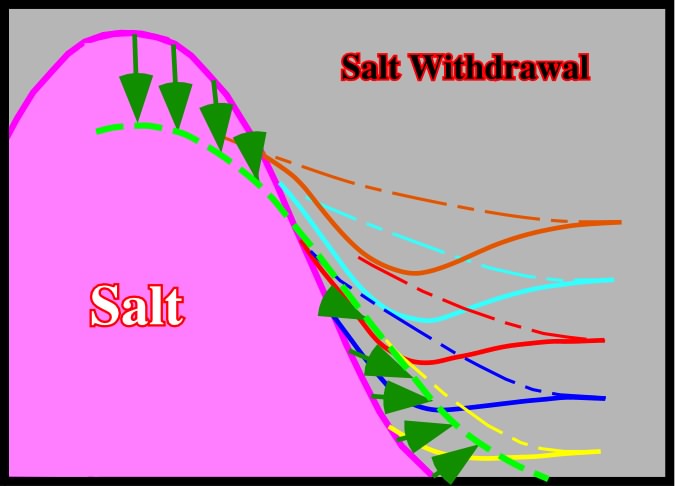
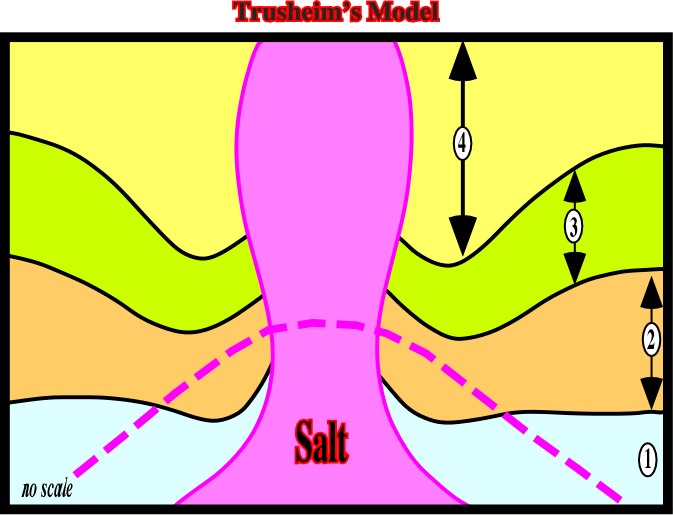
Fig. 60- In Trusheim’s model, the successive lateral withdrawal of the flanks of the former salt intumescence (mound), which is underlined by the dashed violet line, can be recognized by the displacement of the depocenters, located each side of the salt dome. The depocenters were induced by the compensatory subsidence created by the salt flowage as depicted previously (fig. 59).
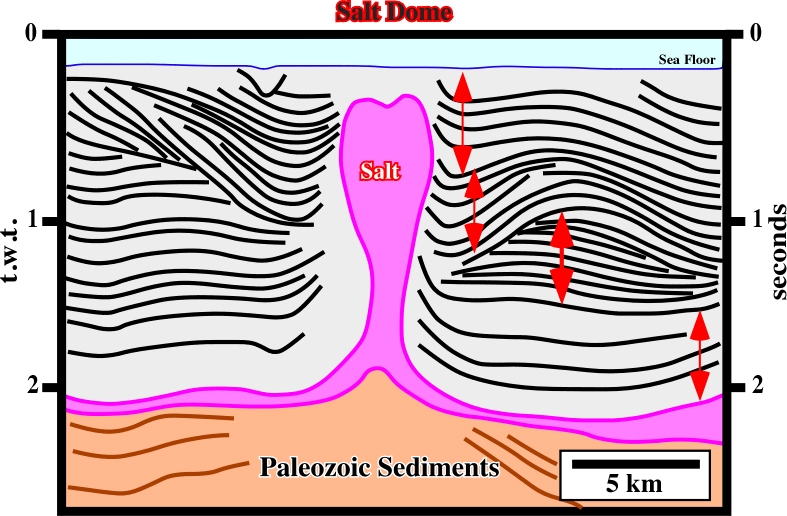
Fig. 61- The final result of the withdrawal of flanks of a pristine salt mound and the coeval vertical salt flowage to form a dome are here well pictured. The lateral displacement of the successive depocenters (red arrows) is easily recognized, in spite of the erosional surfaces between them. The asymmetry of the depocenters suggests a different evolution of the flanks of the former salt anomaly. The reflection free area below top of the dome requires a hypothetical-deductive approach (Theory precedes Observation). Indeed, in Geology there are not un-interpreted observations. All seismic interpretations are theory impregnated.
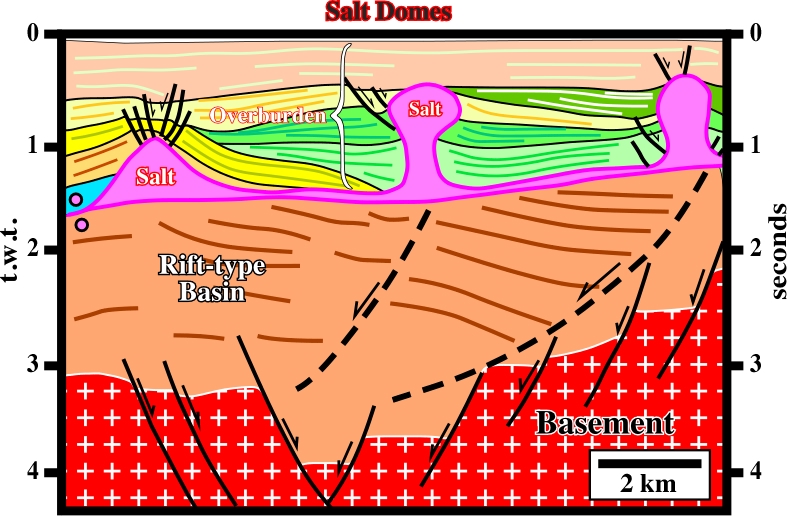
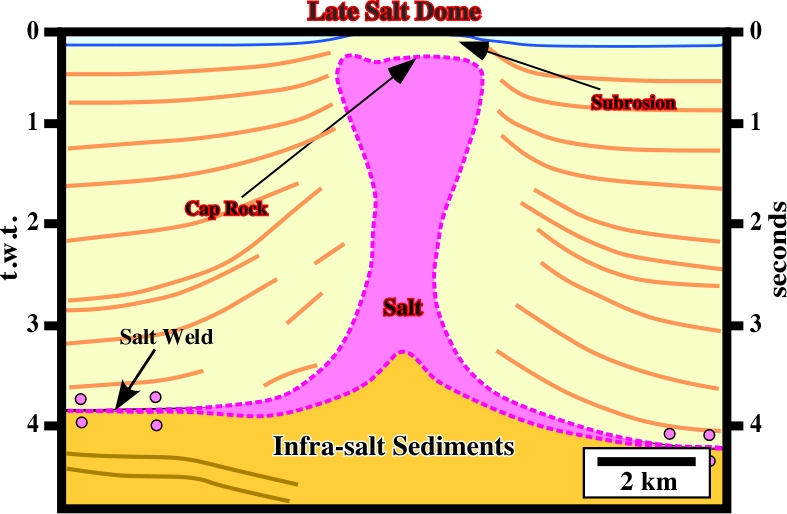
Fig. 63- Not all salt dome are associated with the development of lateral depocenters (rim synclines). In this particular example, the upward salt movement is mainly post-depositional. The sedimentary packages, overlying the mother layer (probable a salt nappe), were deformed by a late upward salt movement. On the top of the salt, subrosion has been quite important. The sub-horizontal geometry of the limit between the cap rock and the salt is quite evident, as well as the positive anomaly of the sea floor at the vertical of the dome.
Table IV
3.4- Vertical Pressure (Pv) Within and Outside a Dome
In the overburden, the geostatic pressure increases with depth and the average density of the sedimentary layers, as illustrated in fig. 64. Taking into account the wildcat as reference, the geostatic pressure (in blue) shows in depth three sharp breaks. They are associated with the stratigraphic boundaries, the last of which is associated with the interface between the autochthonous salt and the overburden.
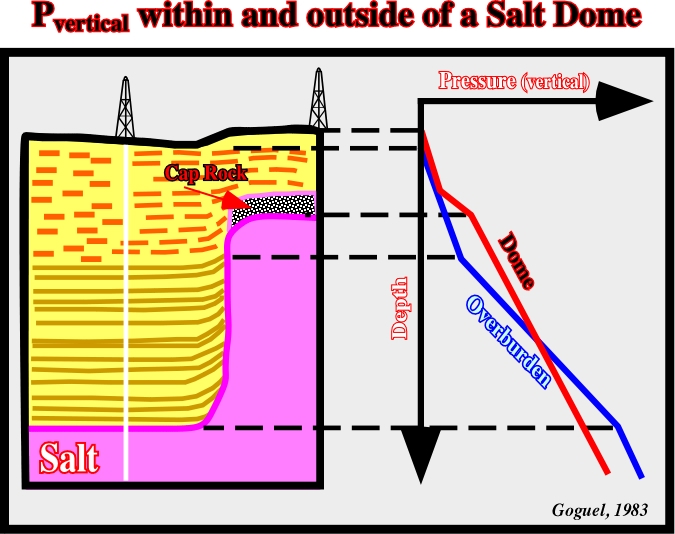
Similarly, the geostatic pressure calculated along a hypothetical well through the salt dome, is illustrated in red on fig. 64. As depicted, two sharp breaks are visible. The first is associated with the cap rock. The second corresponds to salt. In the salt, the geostatic pressure keeps a constant slope, since the density of the salt does change with depth. Two profiles of the geostatic pressure (overburden and salt) illustrated on the depth/pressure diagram, define an inversion point. Above this point, the density of the salt is higher than the average density of the overburden. Below the inversion point, the density of the sediments is higher than the salt. In other words, one can say:
(i) Above the inversion point, the lateral pressure the salt exerts against the sediments is not balanced by the lateral pressure the sediments exert against the salt.
(ii) Below the inversion point, the lateral pressure that the sediments exert against the salt is balanced by the lateral pressure that the sediments exert against the salt.
Additionally, one can say, that a salt dome with vertical sides, as the one suggested on fig. 64, as stated previously, is unlikely. Such geometry represents a mechanical instability due to the presence of an inversion density point.
3.5- Vertical Pressure (Pv) at bottom of a Dome and Overburden
The difference between the geostatic pressure of the overburden and that of a theoretical salt dome (![]() P) growing from an autochthonous mother layer, as illustrated in fig. 65, can be easily calculated. Goguel (1983) knowing:
P) growing from an autochthonous mother layer, as illustrated in fig. 65, can be easily calculated. Goguel (1983) knowing:
a) The average density of the overburden (d),
b) The density of the salt (d’),
c) The height of the dome (H),
d) The height of the topographic anomaly induced by the salt dome (h),
calculated deltaP using the following formula:
![]() PAB = H (d -d’) - hd
PAB = H (d -d’) - hd
The difference of pressure ![]() P is one of the driving forces that induce the salt to flow toward the dome until it reaches a pseudo equilibrium state with the overburden.
P is one of the driving forces that induce the salt to flow toward the dome until it reaches a pseudo equilibrium state with the overburden.
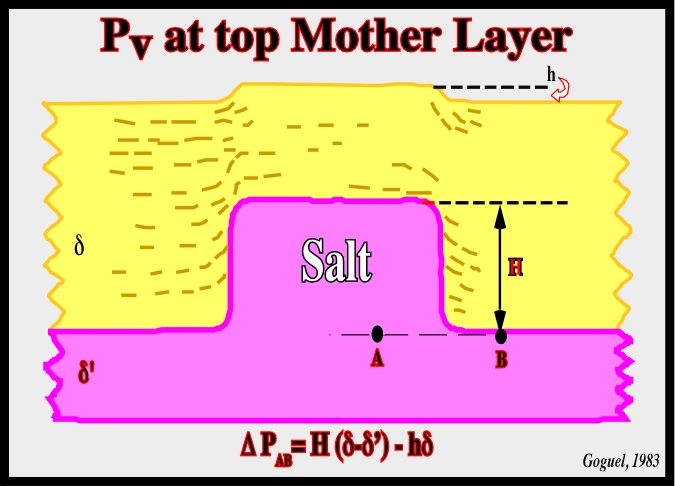
Fig. 65- Goguel calculated the vertical pressure at the bottom of a dome (A, top mother layer) and bottom of the overburden (B) and then
PAB=H(∂-∂’)-h∂. Theoretically, the topographic (or bathymetric) anomaly above the salt dome compensates the deltaP between (A) and (B).
The following seismic examples corroborate the hypothesis that vertical flanks are unlikely since they correspond to an unstable geological situation: (i) Above the inversion point, the salt flows laterally (toward the sediments), creating overhang structures, (ii) Below the inversion point, as the lateral pressure of the sediments is not balanced by the lateral pressure induced by the salt, the salt flows vertically. Such a flowage can disconnect the diapir from the underlying mother layer and create a salt drop structure, which requires also a contraction or collapse of the salt stem, by pressure of the sediments and not just by vertical flow.
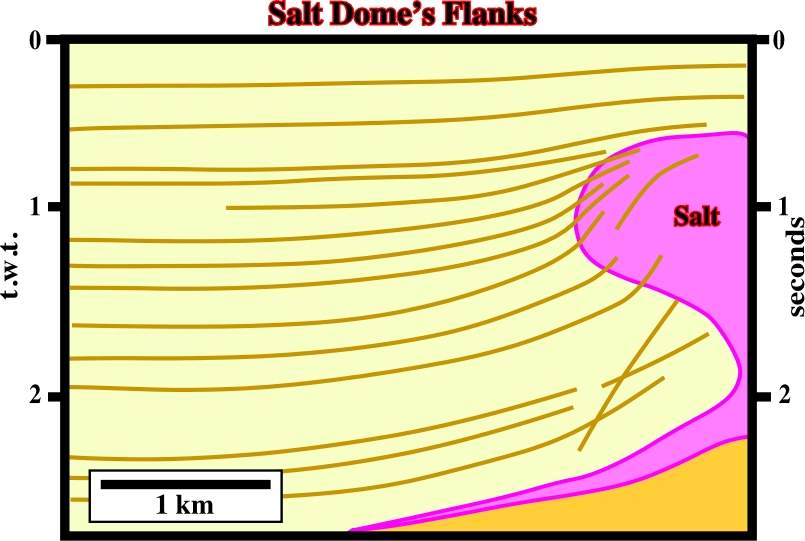
Fig. 69- These salt domes are related with an allochthonous salt nappe, which at present time is mainly represented by a secondary salt weld. The right rim syncline of the left dome (on the right) suggests that the right dome is slightly younger. Indeed, it looks that there is any rim syncline, or depocenter, in the left end of the line.
3.6- Intrusive and Extrusive Salt Domes
Salt domes can be intrusive or extrusive (fig. 70). Intrusive salt domes never outcrop. They do not reach the surface (fig. 71). Extrusive salt domes reach the surface. They induce an apparent diapirism as sedimentation progresses (fig. 72).
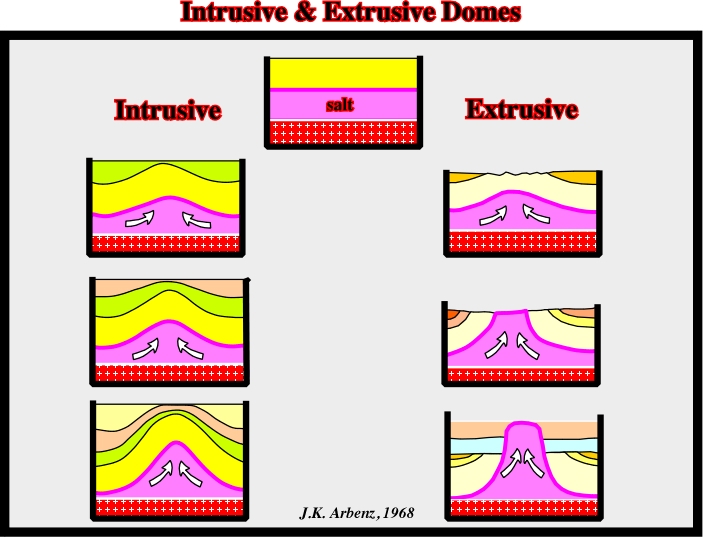
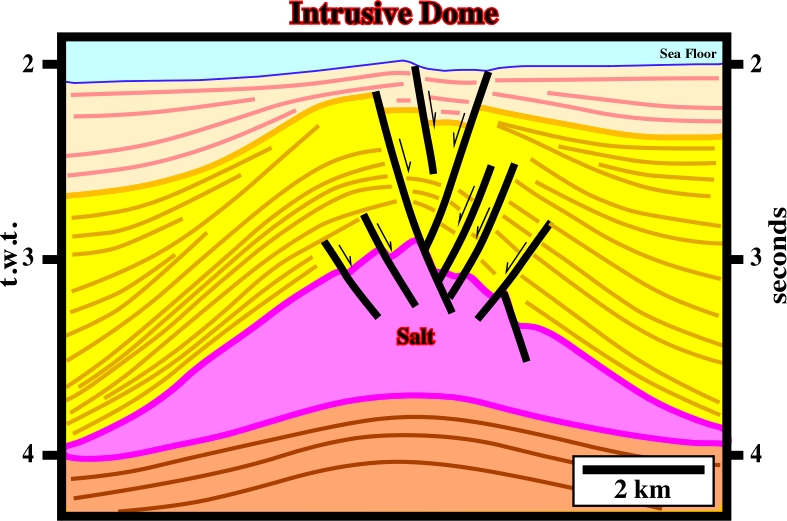
Fig. 71- Intrusive salt domes do not outcrop. They deform all overburden. Stretching-faults on top of the dome are always present. Very often they affect the seafloor as illustrated on this seismic line.
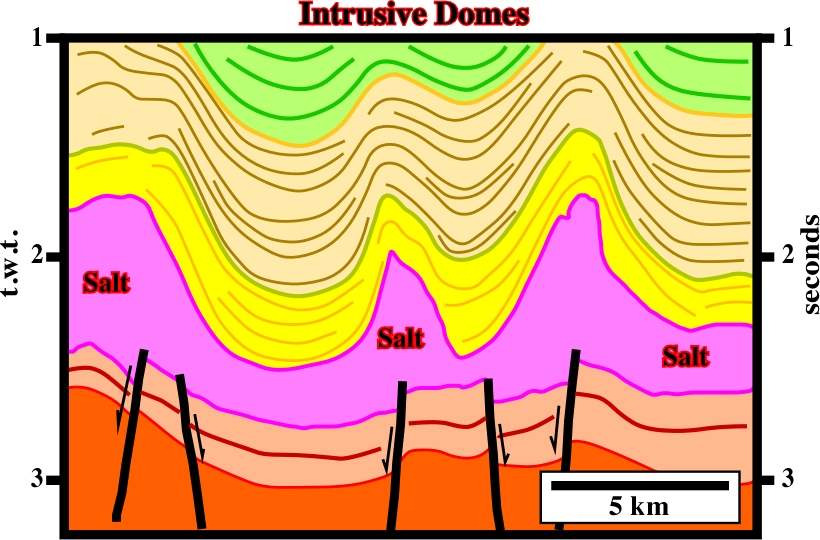
Fig. 72- Intrusive salt domes are frequent in the Southern North Sea. However, as illustrated on this line, the deformation of the overburden cannot be explained exclusively by halokinesis. The concordance between the top of the salt and the overburden reflectors suggests that a compressional tectonic regime shortened the cover, that is to say, the salt and the overburden and probable the infra-salt strata.
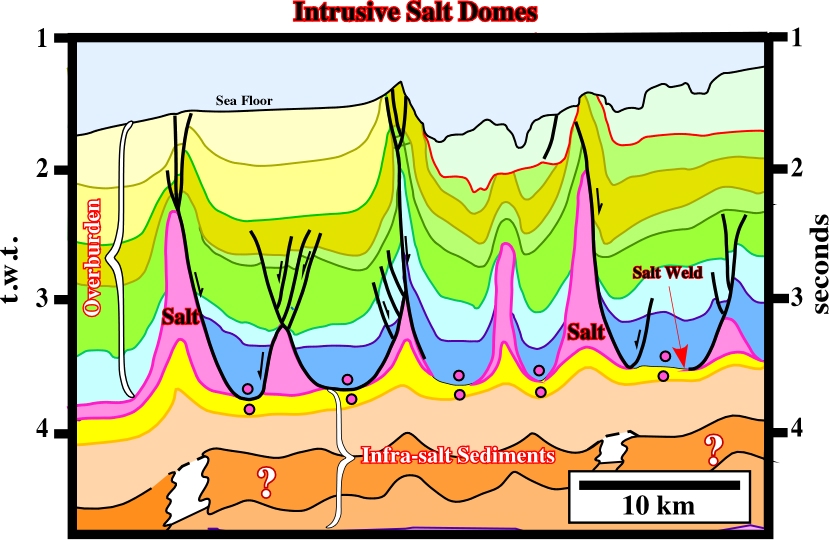
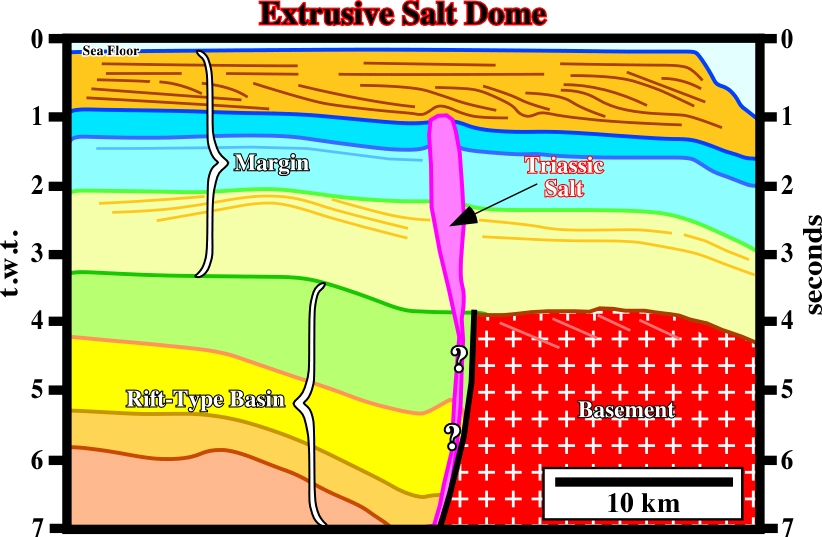
Fig. 74- The Triassic salt dome reached the surface the end of the fill of the rift-type basin. As it was connected with the deep mother salt layer, it progressively grew upward, as deposition progressed, without deforming the margin sediments. When the salt dome became disconnected from the mother salt layer it ceased its upward movement. Probably the stem became a vertical salt weld.
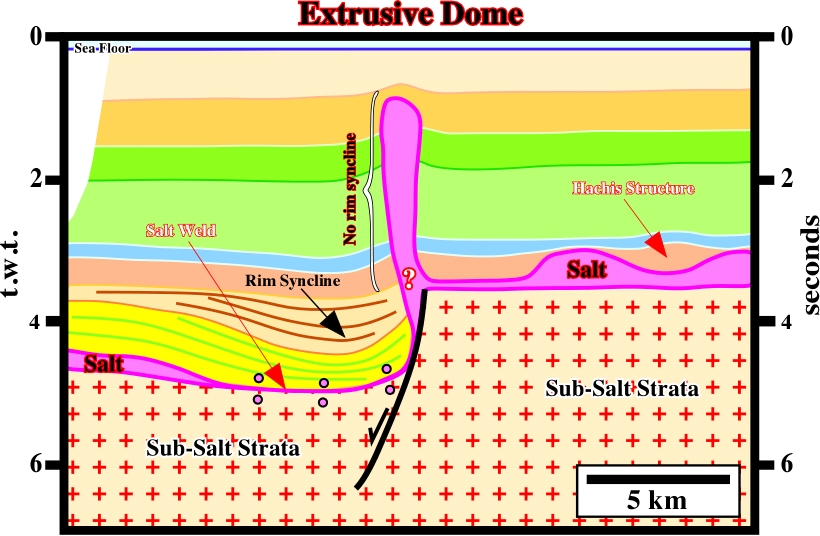
Fig. 75- Since the salt structure became extrusive, that is to say, since the salt reached the surface, deformation of the overburden stopped. On the contrary, before reaching the surface, the salt created a compensatory subsidence, which induced the depocenter recognized on the left part of the line (yellow an orange intervals). The salt structures visible on the right part of the line will be explained later.
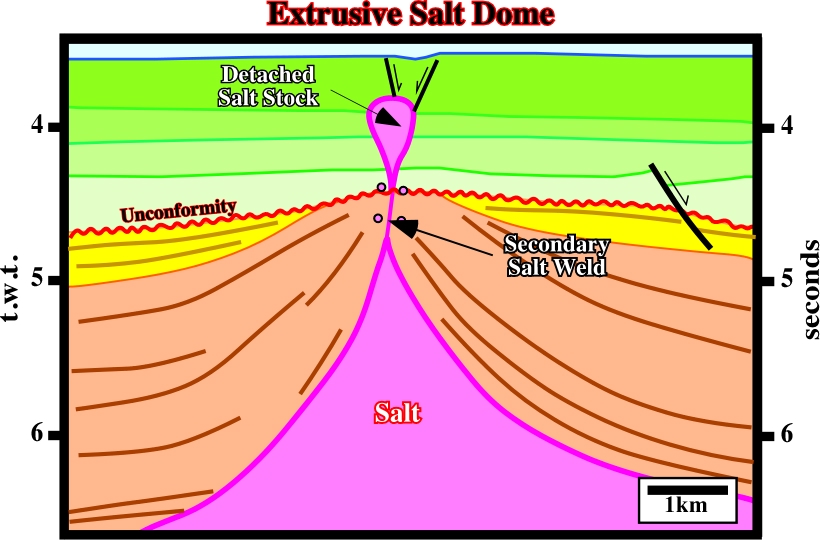
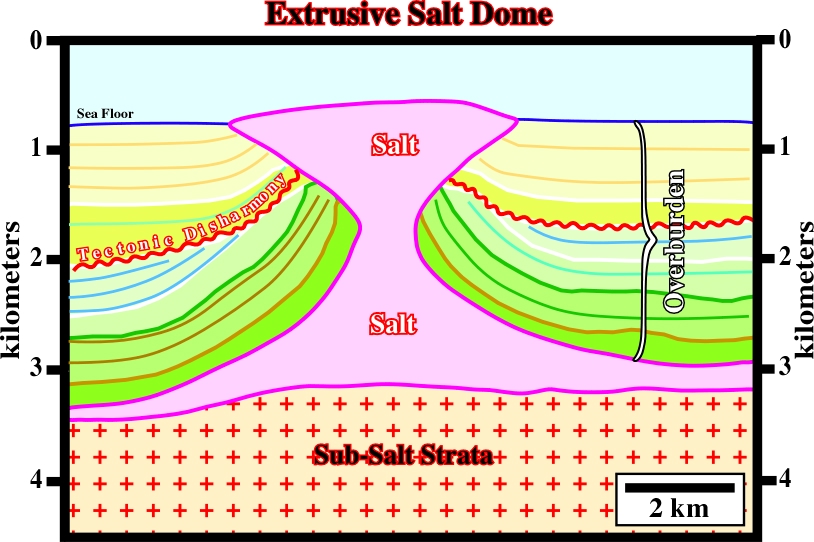
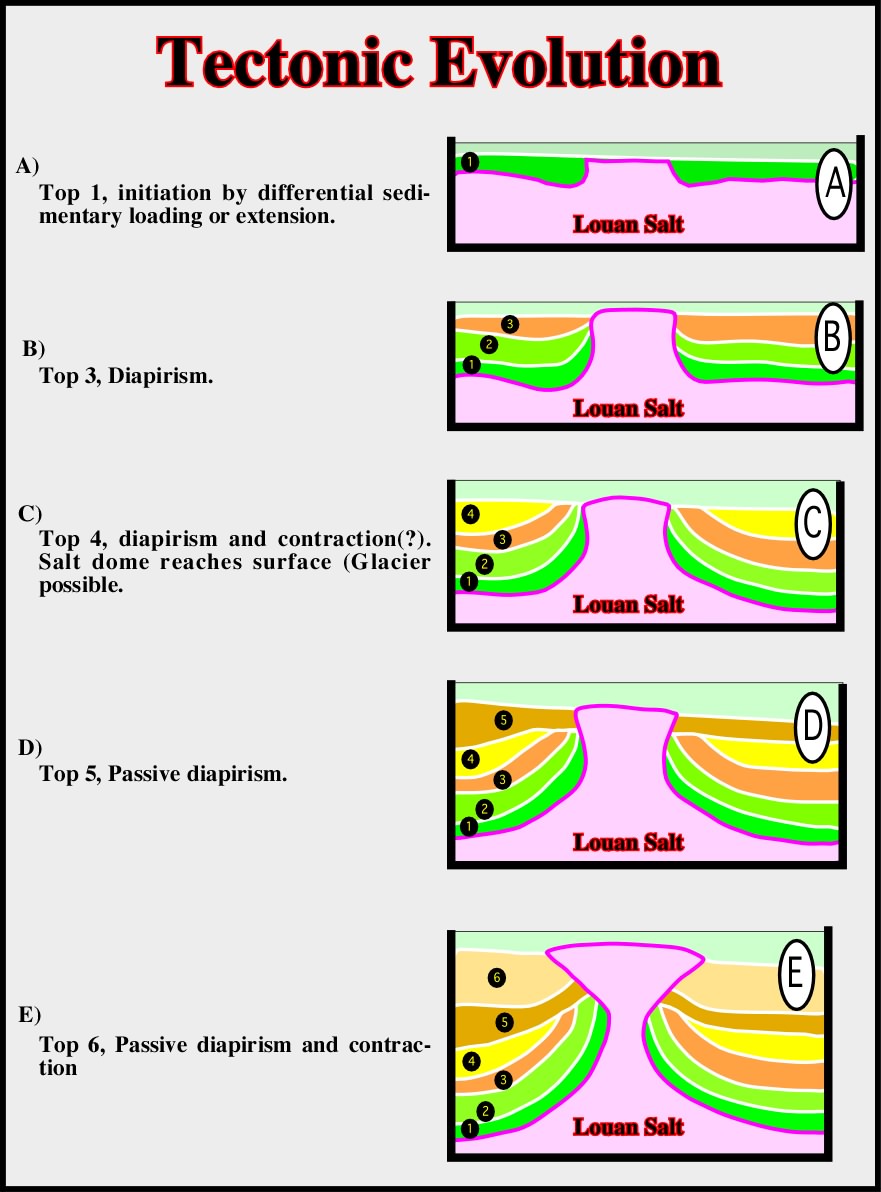
Fig. 78- The extrusive salt structure illustrated in fig. 77, can be explained assuming an early passive Diapirism. The salt reached the surface since the onset of the overburden deposition. A first compressive tectonic phase exaggerated the overburden deformation creating an angular unconformity between the interval 4 and 5. A second compressive tectonic phase was responsible from the deformation of the angular unconformity.
to continue press
next
![]()