Universidade Fernando Pessoa
Porto, Portugal
Geology is systemic. Volume problems cannot be understood in isolation. The understanding of volume problems should progress from general (whole) to particular (part). A geologist correctly understands an individual structure (compressional or extensional) when he understands the complete system. This is particularly true when he tries to interpret seismic lines in fold-belts such as the one illustrated in fig. 1. On the other hand, he must know what he is looking for on a seismic line. Theory precedes observation (Popper, 1934).
An explorationist (or seismic interpreter) cannot start to pick seismic markers, in continuity or not, hoping that a coherent geological model will appear at the end (Ben-Ari, 2005):
- Naive inductive seismic interpretations do not exist.
- The theoretical framework within which one works is critical to the observations and picking.
- When he looks at a seismic line, there is no legend that tells him what he sees.
- To identify reflections and seismic surfaces defined by reflection terminations, he must know what he is looking for.
- If this sounds somewhat circular, it is, and it can explain why scientific exploration progress is difficult.
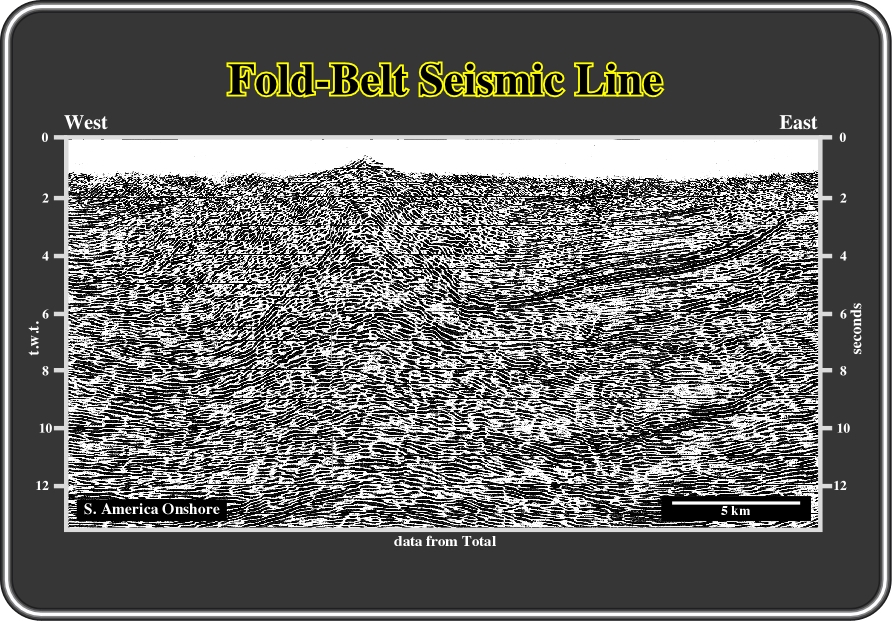
Fig. 1- On this seismic line, an explorationist (lato sensu) must know what he is looking for in order to interpret it. The interpretation must be done progressively by trial and error. He must propose geological hypotheses as tentative solutions and use the seismic data to test them. The hypothesis that best resist criticism must be chosen as the more likely tentative solution. In Science, and therefore in Geology, there are not true interpretations. Sooner or later a tentative solution will be falsified by new data (new seismic lines, well results, etc.). Summing up, an explorationist must know what the geological problem is that he must solve and know, a priori, the more likely tentative geological solutions
In fact, an explorationist must know a priori the geological context of the area and the problem he must solve. In Geology, and particularly in seismic interpretation, one cannot observe if there is not a problem to solve. I remember quite well when my professor in Geology (a fan of the scientific method proposed by Bacon, that is to say, induction), took the class to the field and asked us to observe Nature. The immediate question of all students was: "But, what should we observe, “senhor” Professor? I guess it was the moment that he understood that geologic studies start always with a problem.
As K. Popper (1934) said, without a problem there is no observation. Even if Nature is given as object to observe. In fact, knowing the object (Nature), it was already something, but largely insufficient. In Geology, and consequently in Petroleum Exploration and Seismic Interpretation the following steps should be taken:
Know the problem (step 1),
Geologists propose solutions to solve it (step 2) and then
They refute the proposed tentative solutions with observations (step 3).
In so doing, they chose the least refutable solution as the more likely until new data refute it. At such a moment, they get a new problem and they will be obliged to restart the study (trial and error).
Because hydrocarbon accumulations occur mainly in sedimentary rocks, in these short-course notes, volume problems will be restricted to the rather shallow realm of crustal deformations with overburdens not exceeding those beyond which the search for hydrocarbons is without hope. Our attempts to solve volume problems are not final, but open to improvement. Geological knowledge is conjectural. It consists of guesses, of hypotheses, rather than of final and certain truths. Criticism and critical discussions will be used in order to get less falsifiable proposed geological cross-sections and seismic interpretations. It is relevant here to point out that in these web notes, for confidential reasons, the majority of the seismic lines are illustrated either by their more likely geological interpretations or by picking of the key seismic reflections. The reader can always contact us for discussion of the real data (ccramez@compuserve.com or cramez@ufp.pt).
As a prologue, let us use volume problems to see how Geology depends on the interpretation of basic observations and how it is easy to suggest a hypothesis, in spite of the fact that it is extremely difficult to construct a concise and coherent hypothesis that can be used to explain and predict. Indeed, as in other sciences, circularity exists. Geologists need data on the composition of the Earth in order to develop theories on its structure. Conversely they need theories to guide their observations (Ben-Ari, 2005).
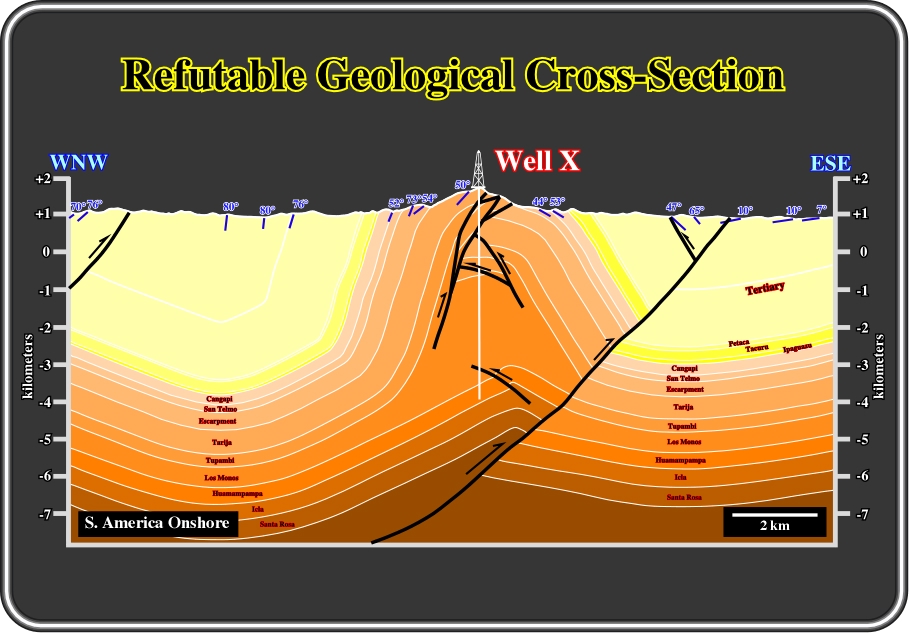
Fig. 2- This cross-section was constructed using seismic data, well results and fieldwork. In other words, the geologist needs geological observations to test (refute) his proposed tentative solutions of the problem that he is supposed to solve. Conversely, as said previously, he also needs hypotheses, or theories, to guide his observations because all geological observations are theory-laden. It is this kind of circularity that we are going to use throughout these notes. For instance, the above cross-section depicts that the problem of volume preservation during deformation (Goguel’s law, 1965) is not just theoretical. It cannot be understood, or solved, in isolation, that is to say, without showing the complete geological system. In reality, although at first glance, the above cross section looks like a plausible interpretation, it does not resist a soft refutation test. Do you known why? If you don’t, you will get the answer in these notes.
Goguel’s law (2sd law of thermodynamic applied to Geology) says, roughly, that throughout deformation volume is kept more or less constant (Goguel, J., 1965, 1983). This law is a volumetric law in the three dimensional realm. However, geological sections and seismic lines are two-dimensional geological data. In addition, generally, the vertical scale is exaggerated and on seismic lines it is in time (t.w.t.). Therefore, to use Goguel’s law in geological profiles, or seismic lines, it is necessary to simplify it:
a) It can be seen as a two dimensional law along the middle effective stress -
2 (see short course: Basic Principles in Tectonics), where displacement is irrelevant. In dip cross-section, or seismic lines, it becomes roughly a surface preservation law.
b) In concentric tectonic folding (realm of petroleum exploration), the thickness of the sedimentary beds, measured perpendicularly to the bedding planes, is constant. Consequently, the length of the beds, or seismic horizons, can be considered as equivalent to the surface, or volume, of the different sedimentary packages. In other words, it becomes a one-dimensional law.
However, Goguel’s law is valid only at natural scale, when vertical and horizontal scales are equal (1:1). Geologists and particularly seismic interpreters, which often are not geologists, have a tendency to forget such basic geological principles (see figs 3 and 4).
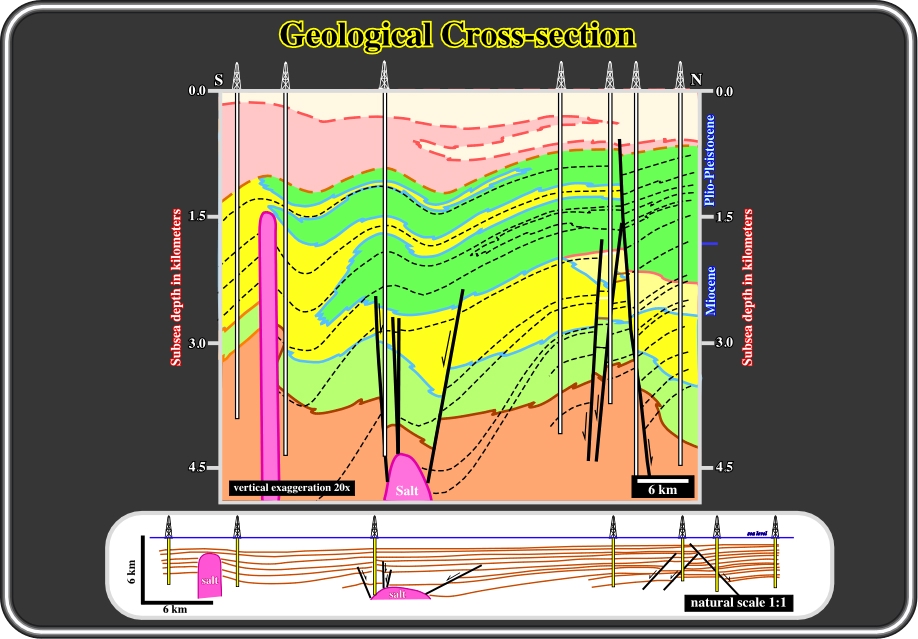
Fig. 3- At first glance, the upper cross-section looks coherent. However, taking into account that the vertical exaggeration is about 20 times, it becomes quite evident that the dips of the normal faults do not respect Anderson's dynamics of faulting (Anderson, 1951). Sure, as said previously, you need to know the theory proposed by Anderson to guide your observations (Theory precedes Observation). If you don’t, you will be obliged to rediscover all the dynamics of faulting). Don't worry, later, we will discuss such dynamics, which roughly can be abridged as follows: (i) conjugate faults intersect along
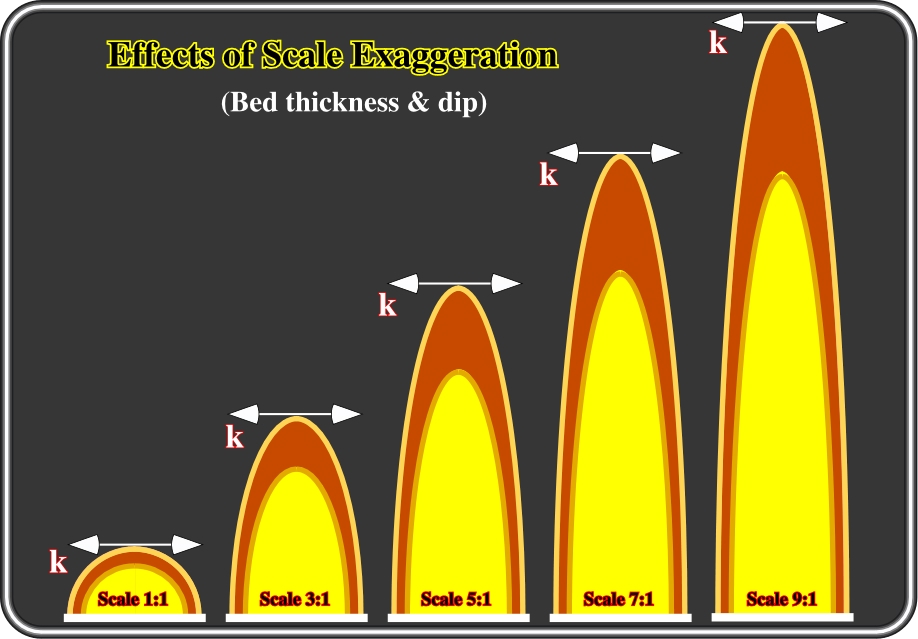
Fig. 4- In this figure, vertical exaggerations of 3x1, 5x1, 7x1, and 9x1 were imposed on an ideal concentric anticline, that is to say, an anticline in which the thickness of the beds, measured perpendicularly to them, is constant. It is easy to perceive that the higher is the vertical exaggeration the thicker the beds will appear at the apex, and the thinner they will appear on the flanks. Similarly, the higher the vertical exaggeration the higher the dips will appear on the flanks. Accordingly, in cross-sections, apparent thickness variations, near the apex of antiform structures should not be interpreted as changes in subsidence. By the same token, and in spite of the fact that seismic lines are time-sections (vertical scale in double time), similar apparent thickness and dip effects are recognized without difficulty on conventional lines, which generally are depicted with a vertical exaggeration ranging between 3 and 5. Summing up: a geologist should not take as real geological dip (sedimentary or structural) the dip of a seismic reflector and as true stratigraphic thickness the thickness of a seismic interval. A simple time-depth conversion of a seismic line can be used as refutation tests of a tentative solution.
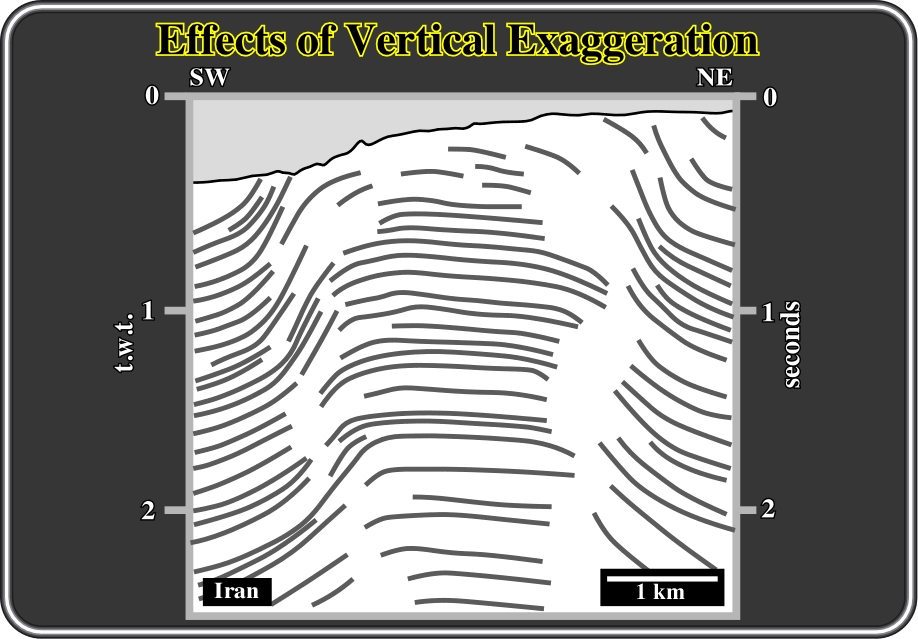
Fig. 5- This figure depicts the picking of the key seismic reflectors of a seismic line shot over an area characterized by concentric folding. The tectonic regime responsible for this sedimentary shortening can be illustrated by an ellipsoid of the effective stresses, in which
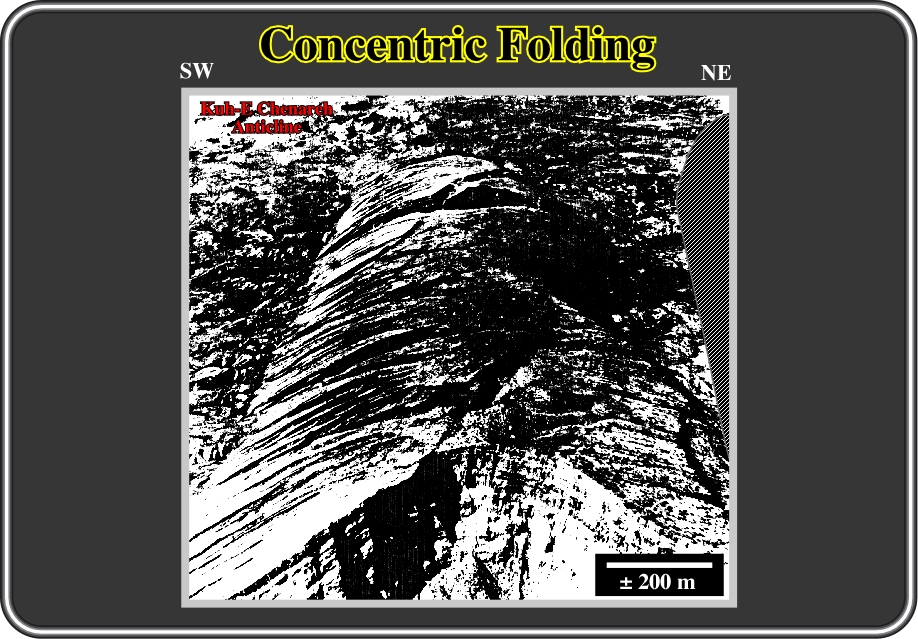
Fig. 6- On the area discussed previously (Iran onshore), the Kub-E. Chenarch anticline corroborates that the sediments were shortened and uplifted by a cylindrical and concentric (or parallel) folding. Indeed, on the ground, that is to say, at natural scale (1:1), as illustrated on this aerial photograph, the thickness of the beds is roughly constant. Therefore, one can say, that the ellipsoid of the effective stresses of the more likely compressional tectonic regime responsible for such a deformation, had a
Note that working on seismic lines, it is quite important; if not fundamental to take into account the scales as well as the vertical exaggeration. Never forget that generally, a seismic line is a time section, i.e., the vertical is in time (two ways time) and the horizontal scale in metres. Consequently, the real geological picture, with the real dips and thickness, is just obtained in time-depth conversion sections and when the horizontal and vertical scales are equal, that is to say at natural scale 1:1
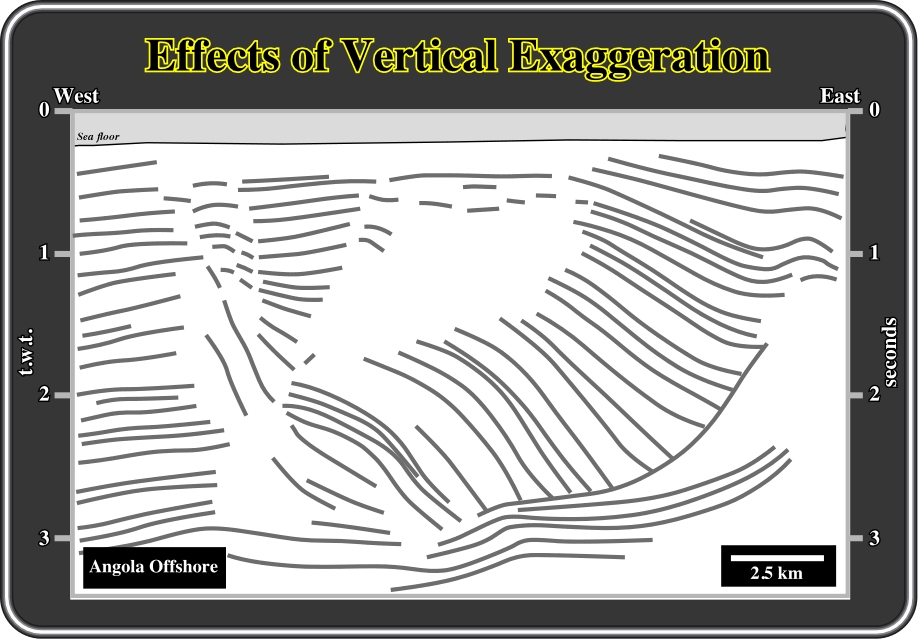
Fig. 7- This figure depicts the picking of the key seismic reflectors of a seismic line from the conventional offshore of Angola where salt tectonics is paramount. In the central area, that is to say, within the depocenter induced by salt flowage (compensatory subsidence), the magnitude of the eastward seismic reflectors dips does not correspond to true structural dips. Indeed, as said previously, a seismic line is a time vertical scale section. In addition, a simple time-depth conversion gives a vertically exaggerated depth section depicting apparent dips and interval thicknesses. The true dips (structural) are those measured on a time-depth line when the horizontal and vertical scales are equal, that is to say, at natural scale, 1:1, as illustrated on fig. 8. Notice, that some of the seismic reflectors do not correspond to chronostratigraphic lines, i.e. reflectors induced by stratigraphic interfaces (bedding panes). They emphasize fault planes filled by salt. In fact, generally, on a seismic line, the faults planes are not underlined by seismic reflection. They appear just as discontinuity surfaces. However, when the fault zone is filled by volcanics or salt, a seismic marker can underline the fault plane. The same happens when a fault puts in juxtaposition sediments and a basement (see later).
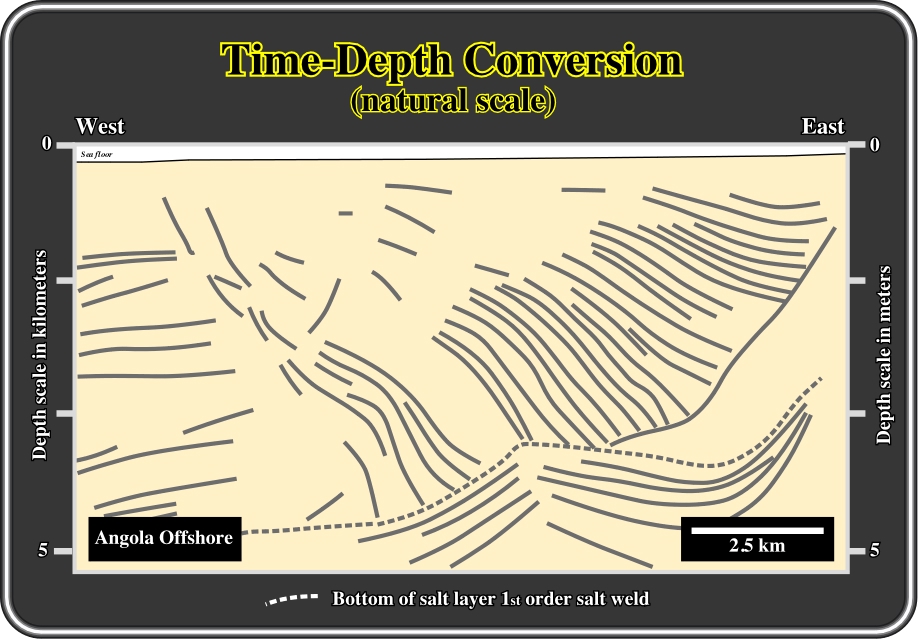
Fig. 8- Here, the picking of key seismic reflectors of a time-depth conversion of the previous line is illustrated. It gives more or less the real structural dips. Indeed, not only the vertical scale is in depth but the scale is natural as well. However, the seismic reprocessing was not excellent. In fact, the bottom of the salt, or the equivalent salt welds, should by rectilinear and this is not the case. In Offshore Angola, from where this line comes, excluding particular cases (salt steps, fracture zones, etc.) and long regional lines, the bottom of the evaporitic interval, and associated 1st order salt welds, are rather rectilinear. Summing up: In conventional seismic lines, the geometry of the seismic reflectors does not exactly depict the geometry of the sediments. Such conditions are most evident in salt basins, such as the Kwanza (Angola) or Campos (Brazil) basins, by lateral variations in velocity intervals induced by evaporites.
![]()
Send E-mail to ccramez@compuserve.com or cramez@ufp.pt with questions or comments about this short-course.
Copyright © 2000 CCramez
Last modification:
Agosto 27, 2006