
Porto, Portugal
Contents:

5.1- Residual Highs
5.2- Turtle-Back Structures
        5.2.1- Quenguela Turtle-Back
                  a) Minimum Stretch with Maximum Salt Reduction
                  b) Maximum Stretch with Minimum Salt Reduction
5.2.2- Examples of Salt Turtle-Backs
In the intermodal salt model proposed by Arbenz (1986), as illustrated in fig. 160, the associated antiform structures may, or may not, have residual salt. These two possibilities have been respectively labeled:
a) Residual high and
b) Turtle-back structure.
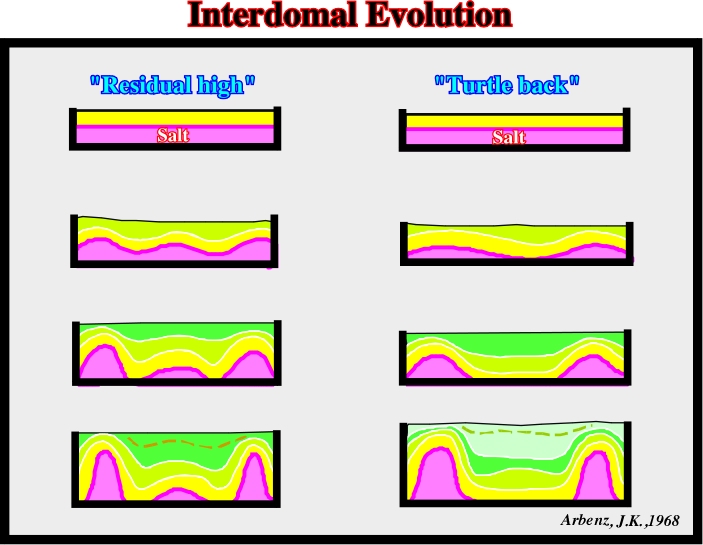
Fig. 160- The interdomal evolution, as proposed by Arbenz, can be subdivided into two large families of salt structures: (i) Residual salt highs and (ii) Turtleback structures.
Residual highs are antiforms with a core of salt that may be disconnected from the adjacent domes.
- In these structures, the high structural points have always been high and the lows always been in a low position. In other words, there is no tectonic inversion associated with them.
Turtle-back structures are also antiform structures. However:
-The high structural points were low, and vice versa. These structures are the result of tectonic inversions due to salt flowage. Therefore, when a turtle-back structure is proposed as a hydrocarbon trap, explorationists should date the tectonic inversion relatively to the migration time of the hydrocarbons. A priori, the migration time must postdate the trap formation.
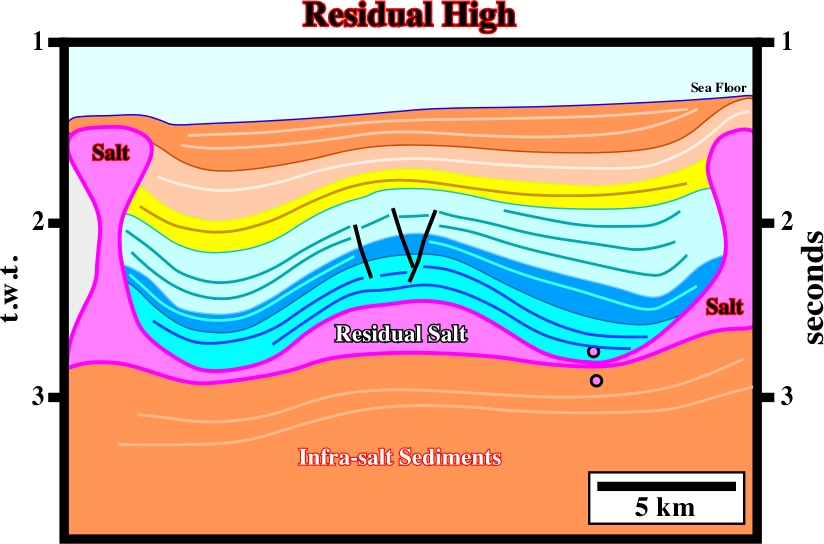
Fig. 161- On this unmigrated seismic line (Seffel, 1968) from offshore Angola, Petrangol (Fina) and Total geologists recognized a large antiform structure with a thick residual salt in its core. At present time, this structure is quite well known. It contains two major oil fields, Girassol and Dalia.
Residual salt highs are illustrated in figures below (fig. 163 and 164).
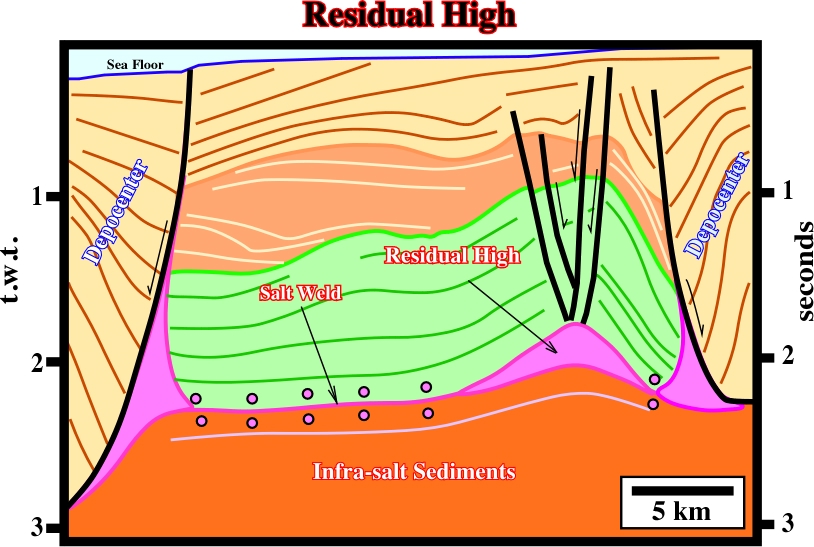
Fig. 163- A residual salt high is located between two Tertiary depocenters. At present time, salt rollers are the vestiges of the pristine salt domes.
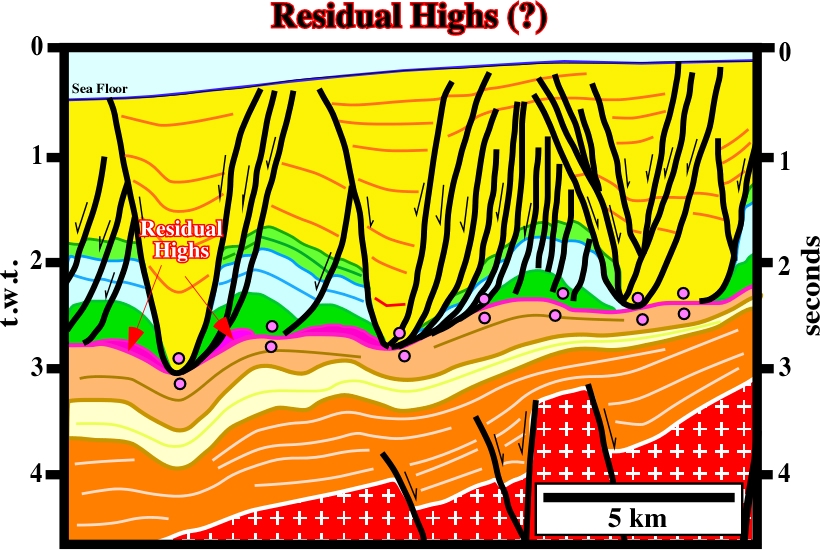
Fig. 164- The large overburden structural highs should not be taken as residual high. Indeed, they cannot be explained by halokinesis alone. As we will see later, a raft tectonics hypothesis is by far the best explanation for Meso-Cenozoic highs between Tertiary depocenters.
Explorationists working on salt basins recognized antiform structures between salt domes as one of the best potential hydrocarbon trap targets. A lot of these targets were tested. However, after a large number of dry wells, explorationists tried to understand how these structures were formed. Trusheim proposed a halokinetic geological model (fig. 165) to explain these interdomal antiform structures that he named “turtle-back structures”. In Trusheim’s model, three structural stages can be recognized:
a) The first stage corresponds to the deposition of the salt mother layer. Such a stage may also include the deposition of a thin overburden interval, in order to increase the geostatic pressure until the salt layer is able to flow.
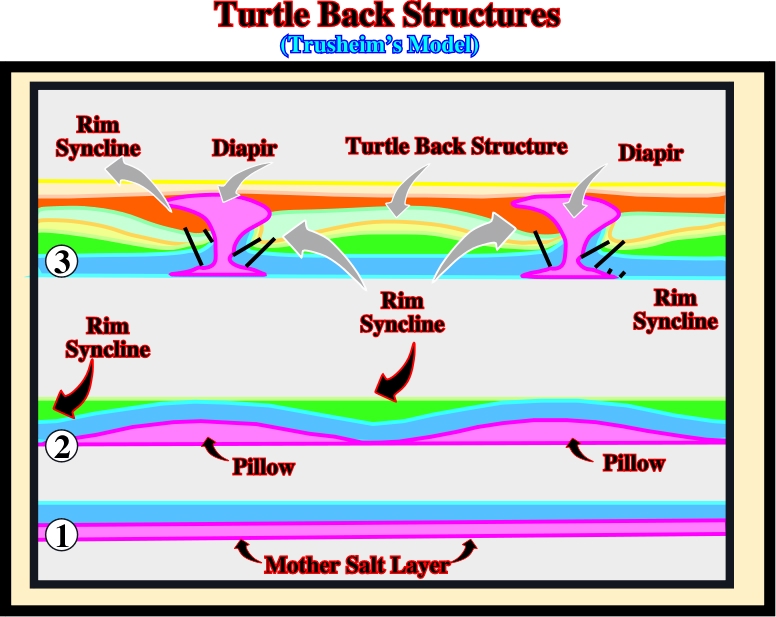
Fig. 165- In this sketch, are pictured the three structural stages taken into account in Trusheim’s model to explain the genesis of the turtle-back structures. The second stage, in which a prekinematic overburden (blue interval) is deposited above the mother salt layer, is not required if the salt thickness is large enough to induce the lower part of the salt layer to flow.
b) The second stage includes the deposition of a lower synkinematic layer in the overburden. During this stage, the compensatory subsidence induces lateral thickness variations within the synkinematic layer. The interval is thicker where the compensatory subsidence is higher.
c) The third stage corresponds to the tectonic inversion and the deposition of the upper synkinematic layer thickening toward the salt diapirs (fig. 166). The depocenters deposited during the inversion stage are conventionally called rim synclines.
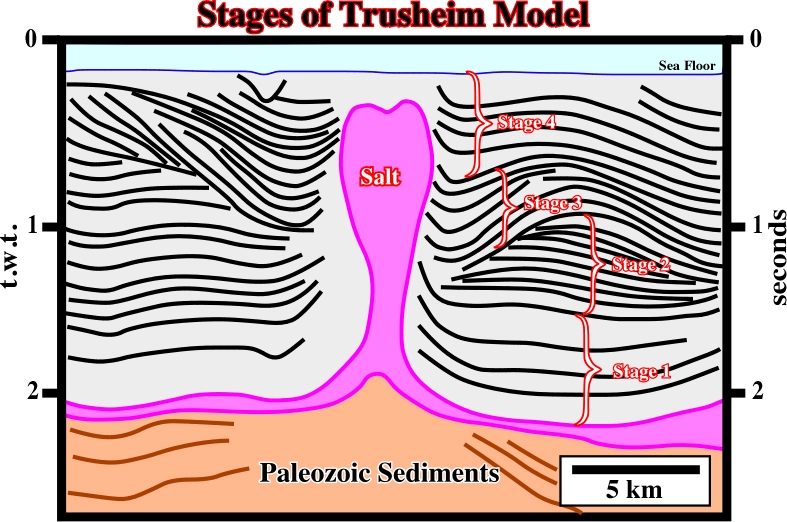
Fig. 166- Three tectonic stages can be observed in the development of salt turtle back structures, as illustrated on this line. From bottom to top, one can recognize: (i) sub-salt strata, (ii) salt, (iii) prekinematic overburden (stage 1), (iv) synkinematic overburden thickening away from the salt diapirs (stage 2) and (v) synkinematic thickening toward the diapirs (stage 3 and 4).
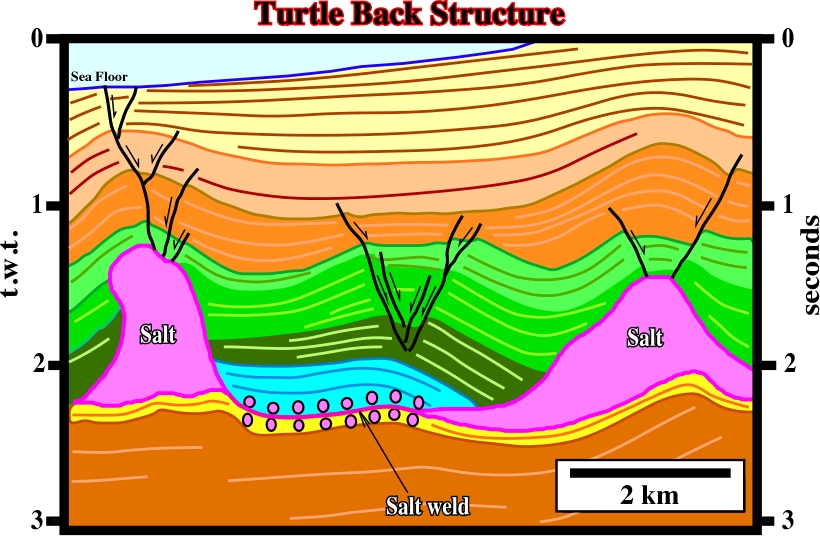
Fig. 167- This line illustrates a typical turtle-back structure in offshore Angola. A late compressional tectonic regime shortened and partially inverted the overburden. The second structural stage of Trusheim’s model corresponds to the green intervals. The asymmetry of the green intervals, the uplift (brown intervals) and the normal faulting in the core of the turtle, are quite evident (see next figures).
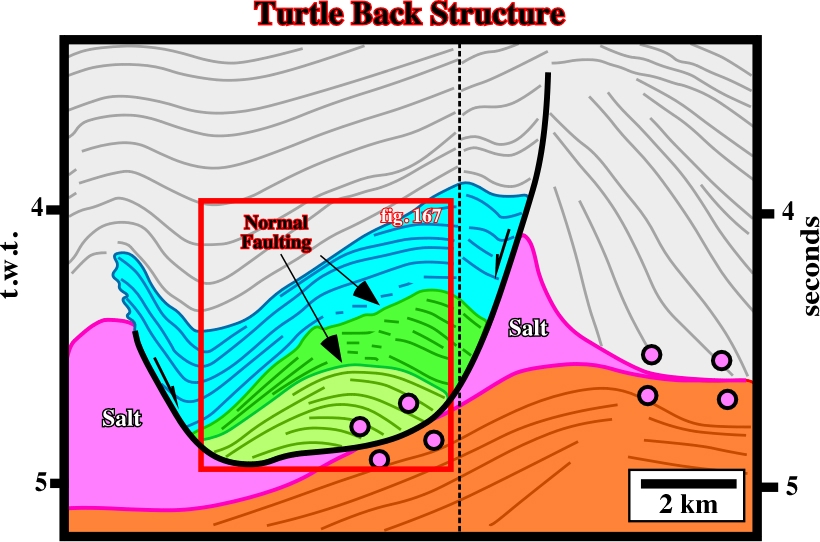
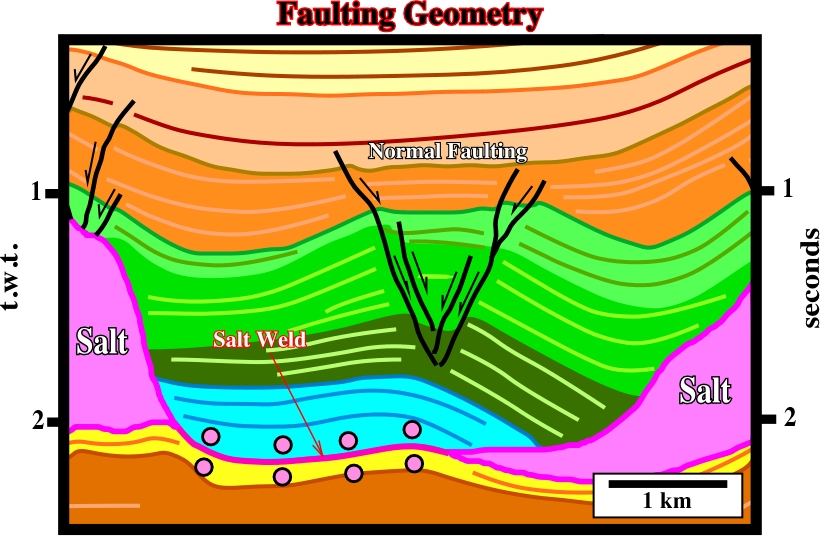
Fig. 168- In this complex turtle-back, the flanks are formed by rollovers into two normal-faults of different age. The SW flank was formed by a late salt withdrawal feeding the adjacent diapir. The synform was later amplified by shortening of the diapir. Extension associated with inversion induced by salt withdrawal is emphasized by the normal-faults in the core of structure (see detail fig. 169).
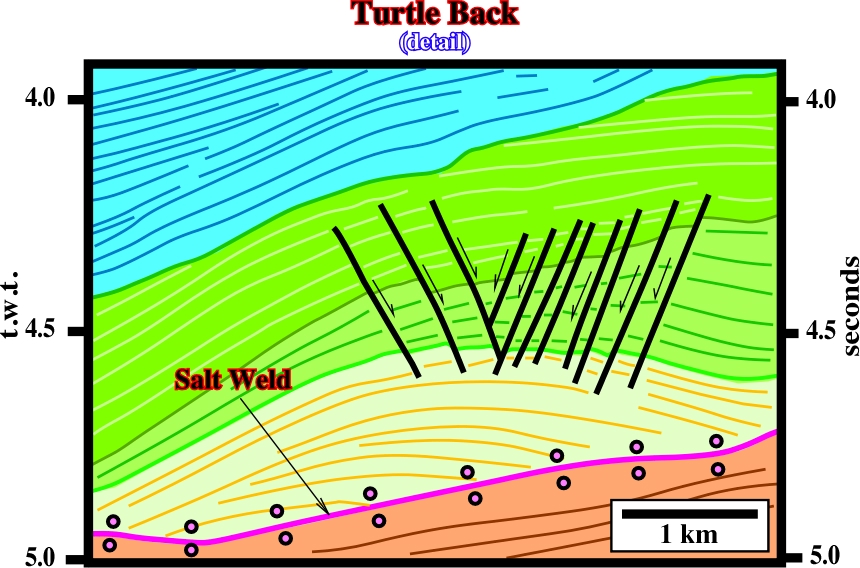
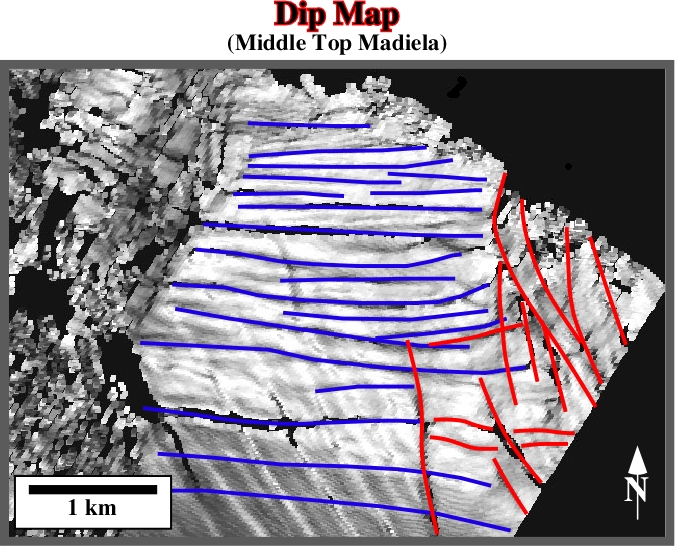
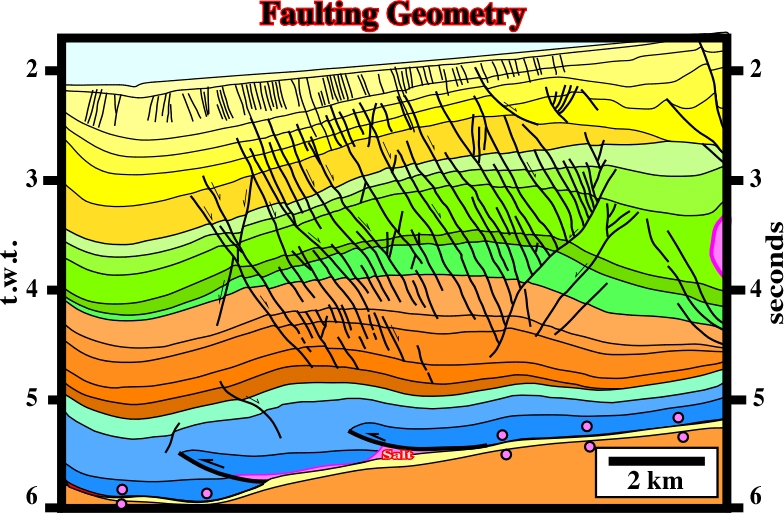
Fig. 169- Normal faulting, in the core of a turtle back, is a sine qua non characteristic. In other words, generally, a mounded structure without abundant normal-faults near the apex is not a turtle-back. When the turtle-back is asymmetric, different normal-fault systems are developed, as suggested by the dip map illustrated in fig. 170.
Petrangol’s explorationists working in onshore and offshore Angola were the first geologists to advance a coherent hypothesis explaining formation of turtle-back structures. However, the majority of wells drilled to test the hydrocarbon potential of such salt structures were unsuccessful. In onshore Angola, as well as in the offshore, the age of the turtle back structures postdate to the migration time of the hydrocarbons produced by the conventional generating petroleum subsystem ( until the 70’s, in onshore Angola, both in the South Congo basin or in the Kwanza basin, the organic rich lacustrine shales deposited in the rift-type basins composed the known generating petroleum subsystem. Later, explorationists recognized that an alternative Albian subsystem accounted for the small oil accumulation found in onshore (Cabo Ledo, Benfica, etc.). At present time, another generating petroleum subsystem is recognized a as a major hydrocarbon contributor in the oil fields of the conventional offshore (Palanca, Lombo East, Tubarão, etc)).
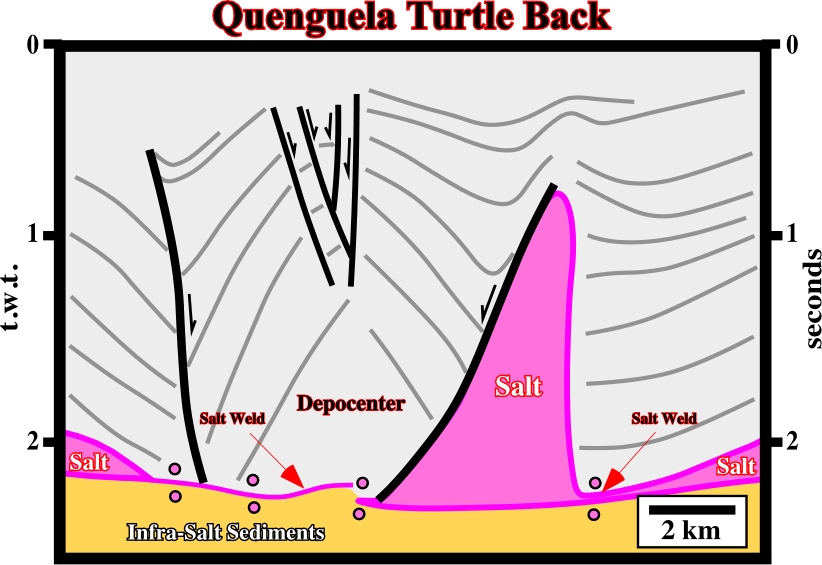
The biggest discovery made by Petrangol in onshore Angola was Quenguela Field (around 40 Mb), which is a turtle back. However, the generating petroleum subsystem (potential source rocks) is abnormal and quite local. It corresponds to the organic Paleocene-Eocene shales deposited in the core of the structure. Indeed, one can say that the most famous turtle-back structure in the oil industry is the Quenguela turtle back, where Petrangol, in the 60’s, discovered a significant oil accumulation, in onshore Angola, no far from the capital, São Paulo de Luanda. Such a discovery was made using unmigrated seismic data, in which a large antiform surrounded by salt rollers was relatively evident, as illustrated in fig. 175. On the contrary, the generating petroleum subsystem and the potential reservoir were questionable.
At the time of the Quenguela oil discovery, explorationists did not understand how the organic matter of the source-rocks could be mature. In absence of biomarkers, several bold hypotheses were advanced. At present time, explorationists working in the area assumed that landward of the Atlantic-hinge, the Angola continental shelf and onshore were uplifted 2000-3000 m, during the Upper Tertiary.
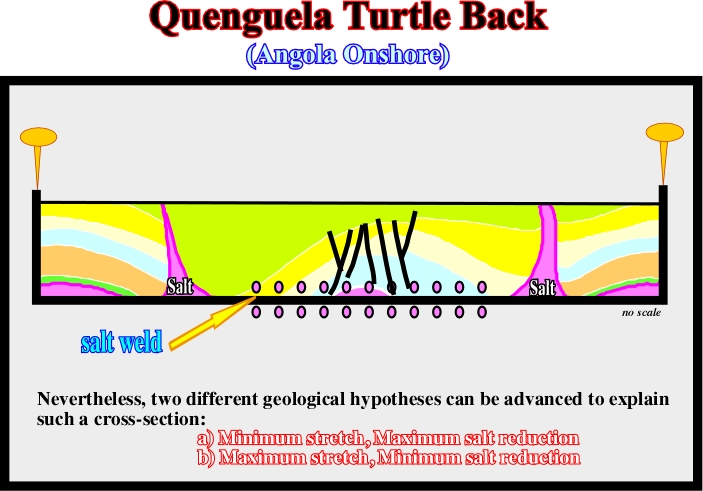
The proposed geological cross-section of Quenguela field (fig. 176), can be explained, by two quite distinct hypotheses: (i) Minimum stretch and Maximum salt reduction (fig. 177), or (ii) Maximum stretch and Minimum salt reduction (fig. 178):
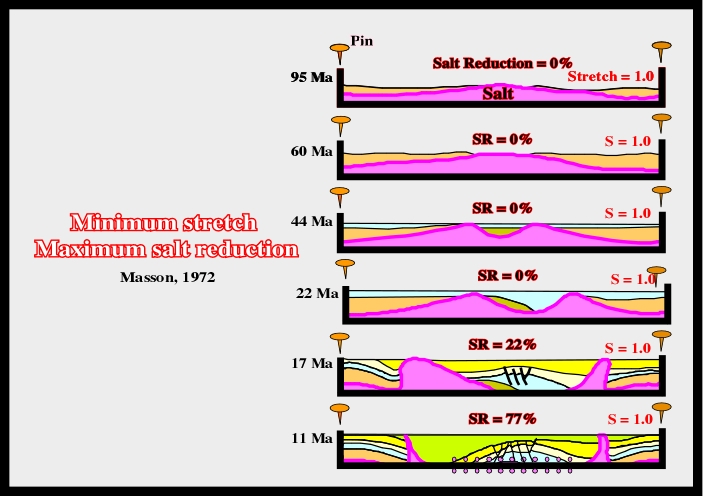
(ii) Maximum Stretch, Minimum Salt Reduction
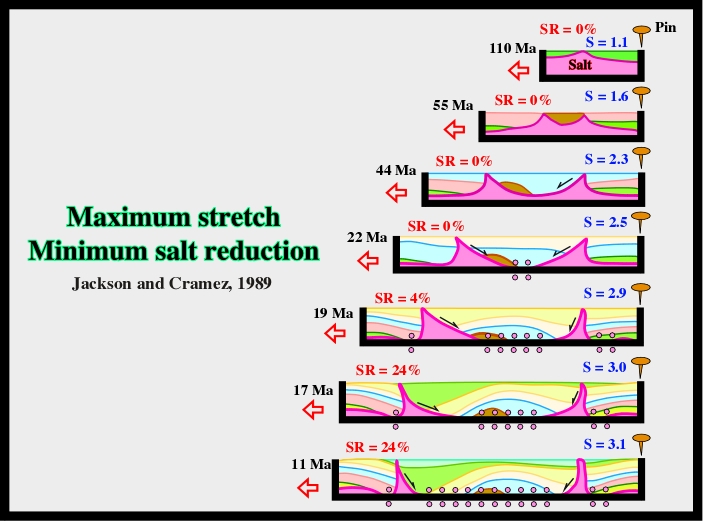
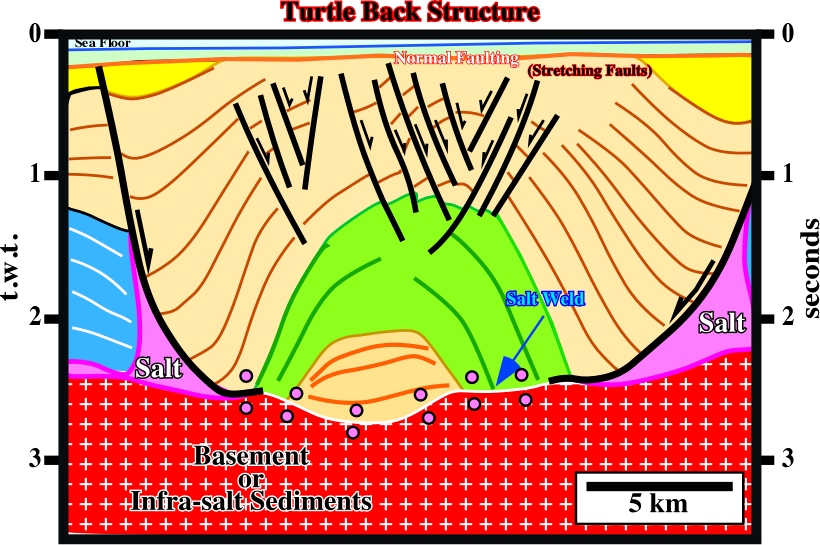
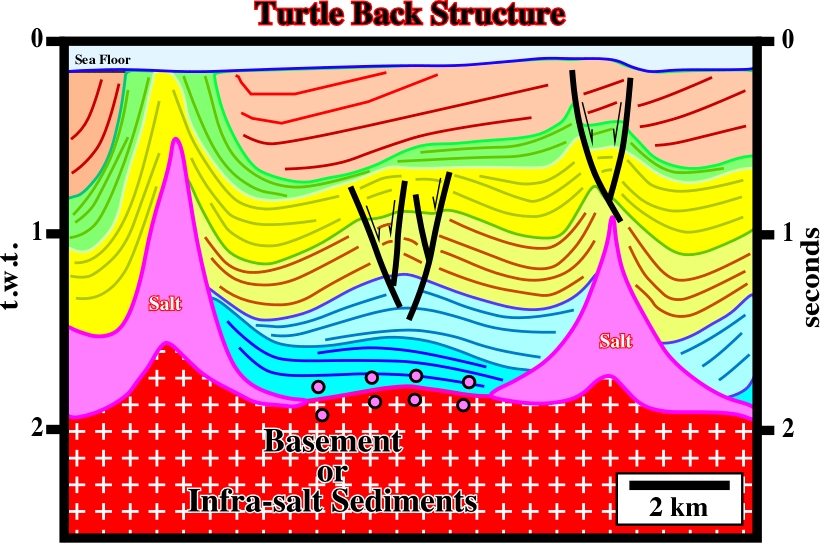
Fig. 180- In spite of a late shortening, which deformed the cover, the characteristics of an asymmetric turtle-back are easily recognized. In offshore Angola, the majority of the turtle-back structures are asymmetric and shortened. The associated domes are very often squeezed as illustrated on this line.

Fig. 182- In offshore Campos, large Cretaceous turtle, such those illustrated on this line, have been object of intense exploration. Unfortunately, the reservoirs are not buried deeply enough to avoid biodegradation of the trapped oil. When the reservoir temperature, at oil migration time, is less that 60°C, bacteria not are destroyed and so they progressively biodegrade the oil.
to continue press
next
![]()
Send E-mails to ccramez@compuserve.com or cramez@ufp.pt with questions or comments about these notes.
Copyright © 2001 CCramez
Last modification:
Março 19, 2006