Gabbro.........................................................................................................................................................................................................................................................Gabbro
Gabro / Gabro / Gabbro (Gestein) / 辉长岩(岩) / Габбро / Gabro (rocca) /
Mafic intrusive rock, of dark colour and coarse grain, chemically equivalent to basalt. The vast majority of the Earth's surface is supported by gabbro formed within the oceanic crust by the basalt magmatism in the ocean ridges.
See: « A-Type Subduction Zone (Ampferer) »
&
« Ophiolite »
&
« Crust »
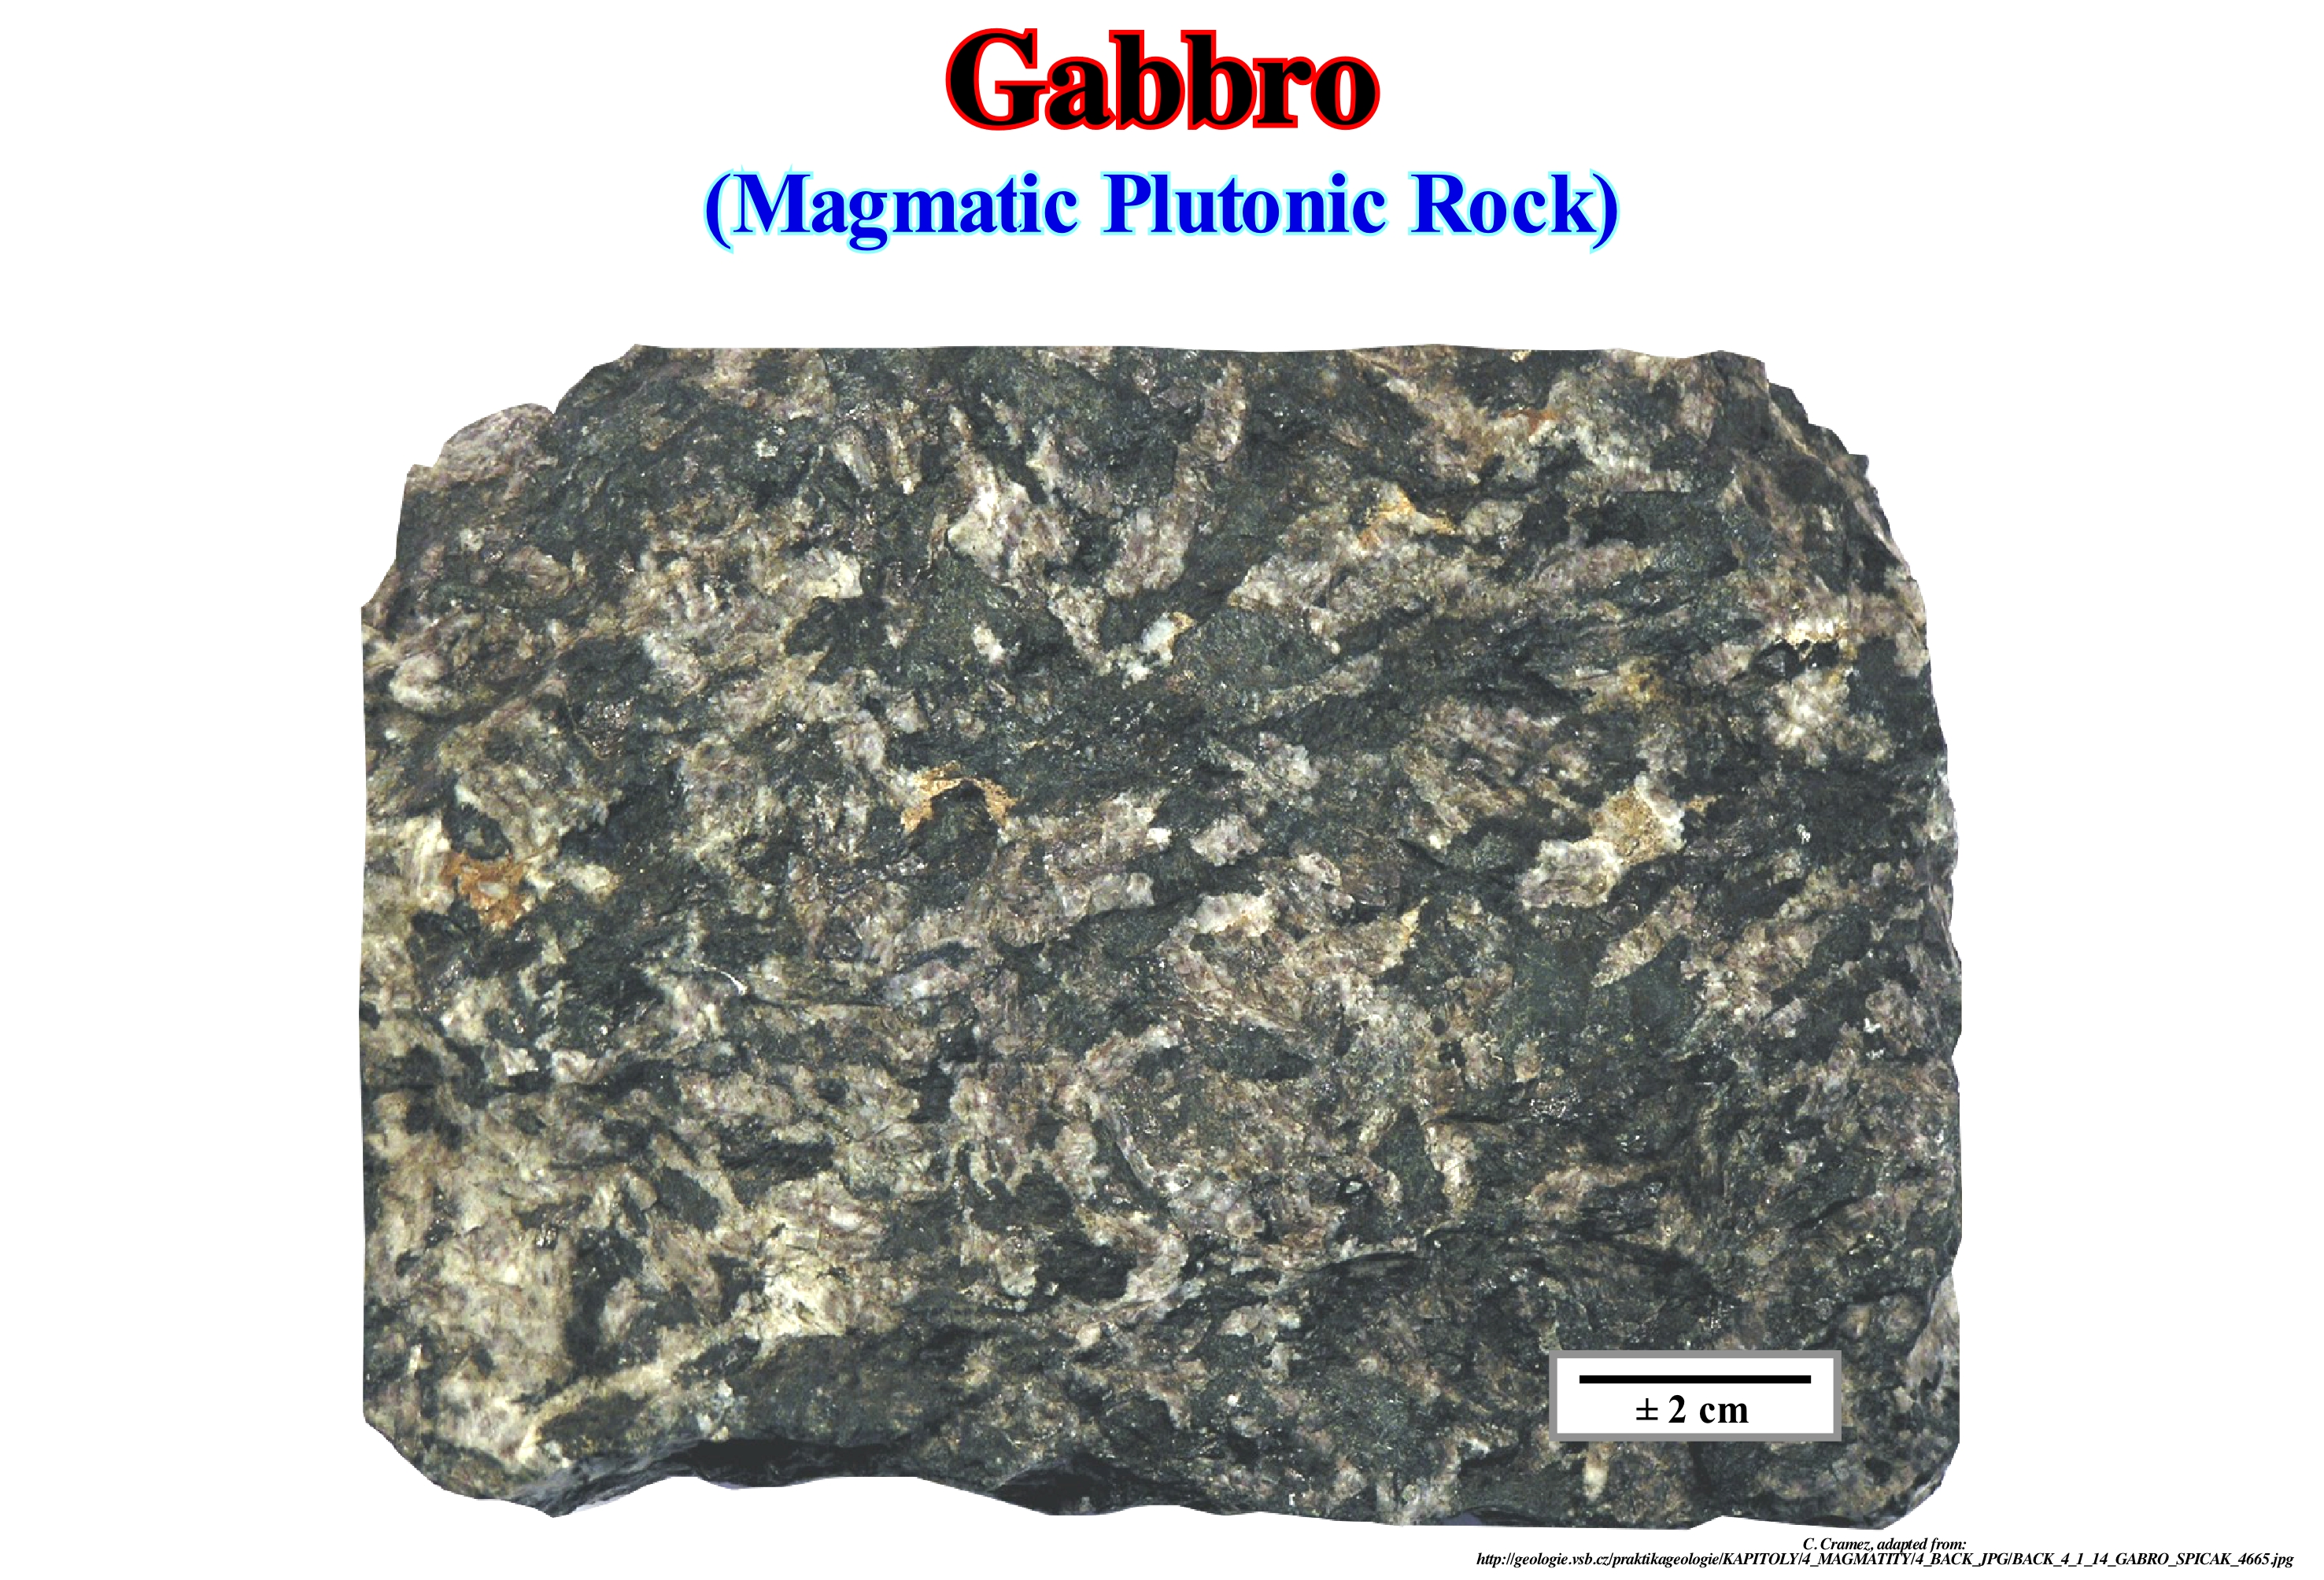
Gabbro is a plutonic igneous rock (formed from slow cooling, in depth of large masses of magma) composed of plagioclase (feldspars tectosilicates), ferro-magnesium minerals and pyroxenes (inosilicate, i.e., a set of simple chains of SiO4 tetrahedral complexes). A gabbro contains silicates of aluminium, and of calcium as fundamental minerals. Gabbros are heavy rocks, grainy in colour between dark grey and green. Are the basic plagioclase, pyroxene, olivine*, amphibole** and other minerals which give them their colour. Usually, gabbros occur in oceanic crust in association with basalts. Some geoscientists divide the gabbros into: (i) Augitic gabbros (i.e., rich in augite, which is a mineral of the pyroxene family, a clinopyroxene, and calcium) and (ii) Hypersthenic gabbros (hypersthene is a mineral of the group of silicates, sub-group of inosilicate, which belongs to pyroxenes). A feldspathic gabbro contains nepheline (sodium aluminium tectosilicates in which sodium is, partly, replaced by potassium and sometimes calcium) and other feldspars (a group of tectosilicates minerals, i.e. minerals formed by the association of elemental tetrahedral motifs, SiO4 in all vertices, which are the main constituents of igneous rocks, but which can be found in any other type of rock). The astronauts brought from the Moon rocky samples very similar to the terrestrial gabbros, but distinguished by their abundance in refractory elements (titanium, zirconium and yttrium) and a low content of volatiles (potassium, sodium and bismuth).
(*) Minerals from the silicate group, subgroup of the tectosilicates, i.e., group SiO4- associated with a positively charged group.
(**) Generic name given to an extensive mineralogical group known as the amphibole group containing the hydroxyl ion and various metal cations (Ca2+, Mg2+, Fe2+, Al3+, Na+, and the others). They are grouped into monoclinic amphibole and orthorhombic amphibole).
Gaia (Hypothesis).................................................................................................................................................................................................................Gaïa (hypothèse)
Gaia/ Gaia (hipótese) / Gaia-Hypothese / 蓋亞假說 / Гипотеза Геи / Ipotesi Gaia /
Earth is a living system. It is difficult to know what to do with the Gaia hypothesis, which says that the Earth is a living system, because it has no original prediction that can be tested experimentally, which is a requirement of all scientific theory.
See: « Earth »
&
« Big Bang (theory) »
&
« Systems' Theory »
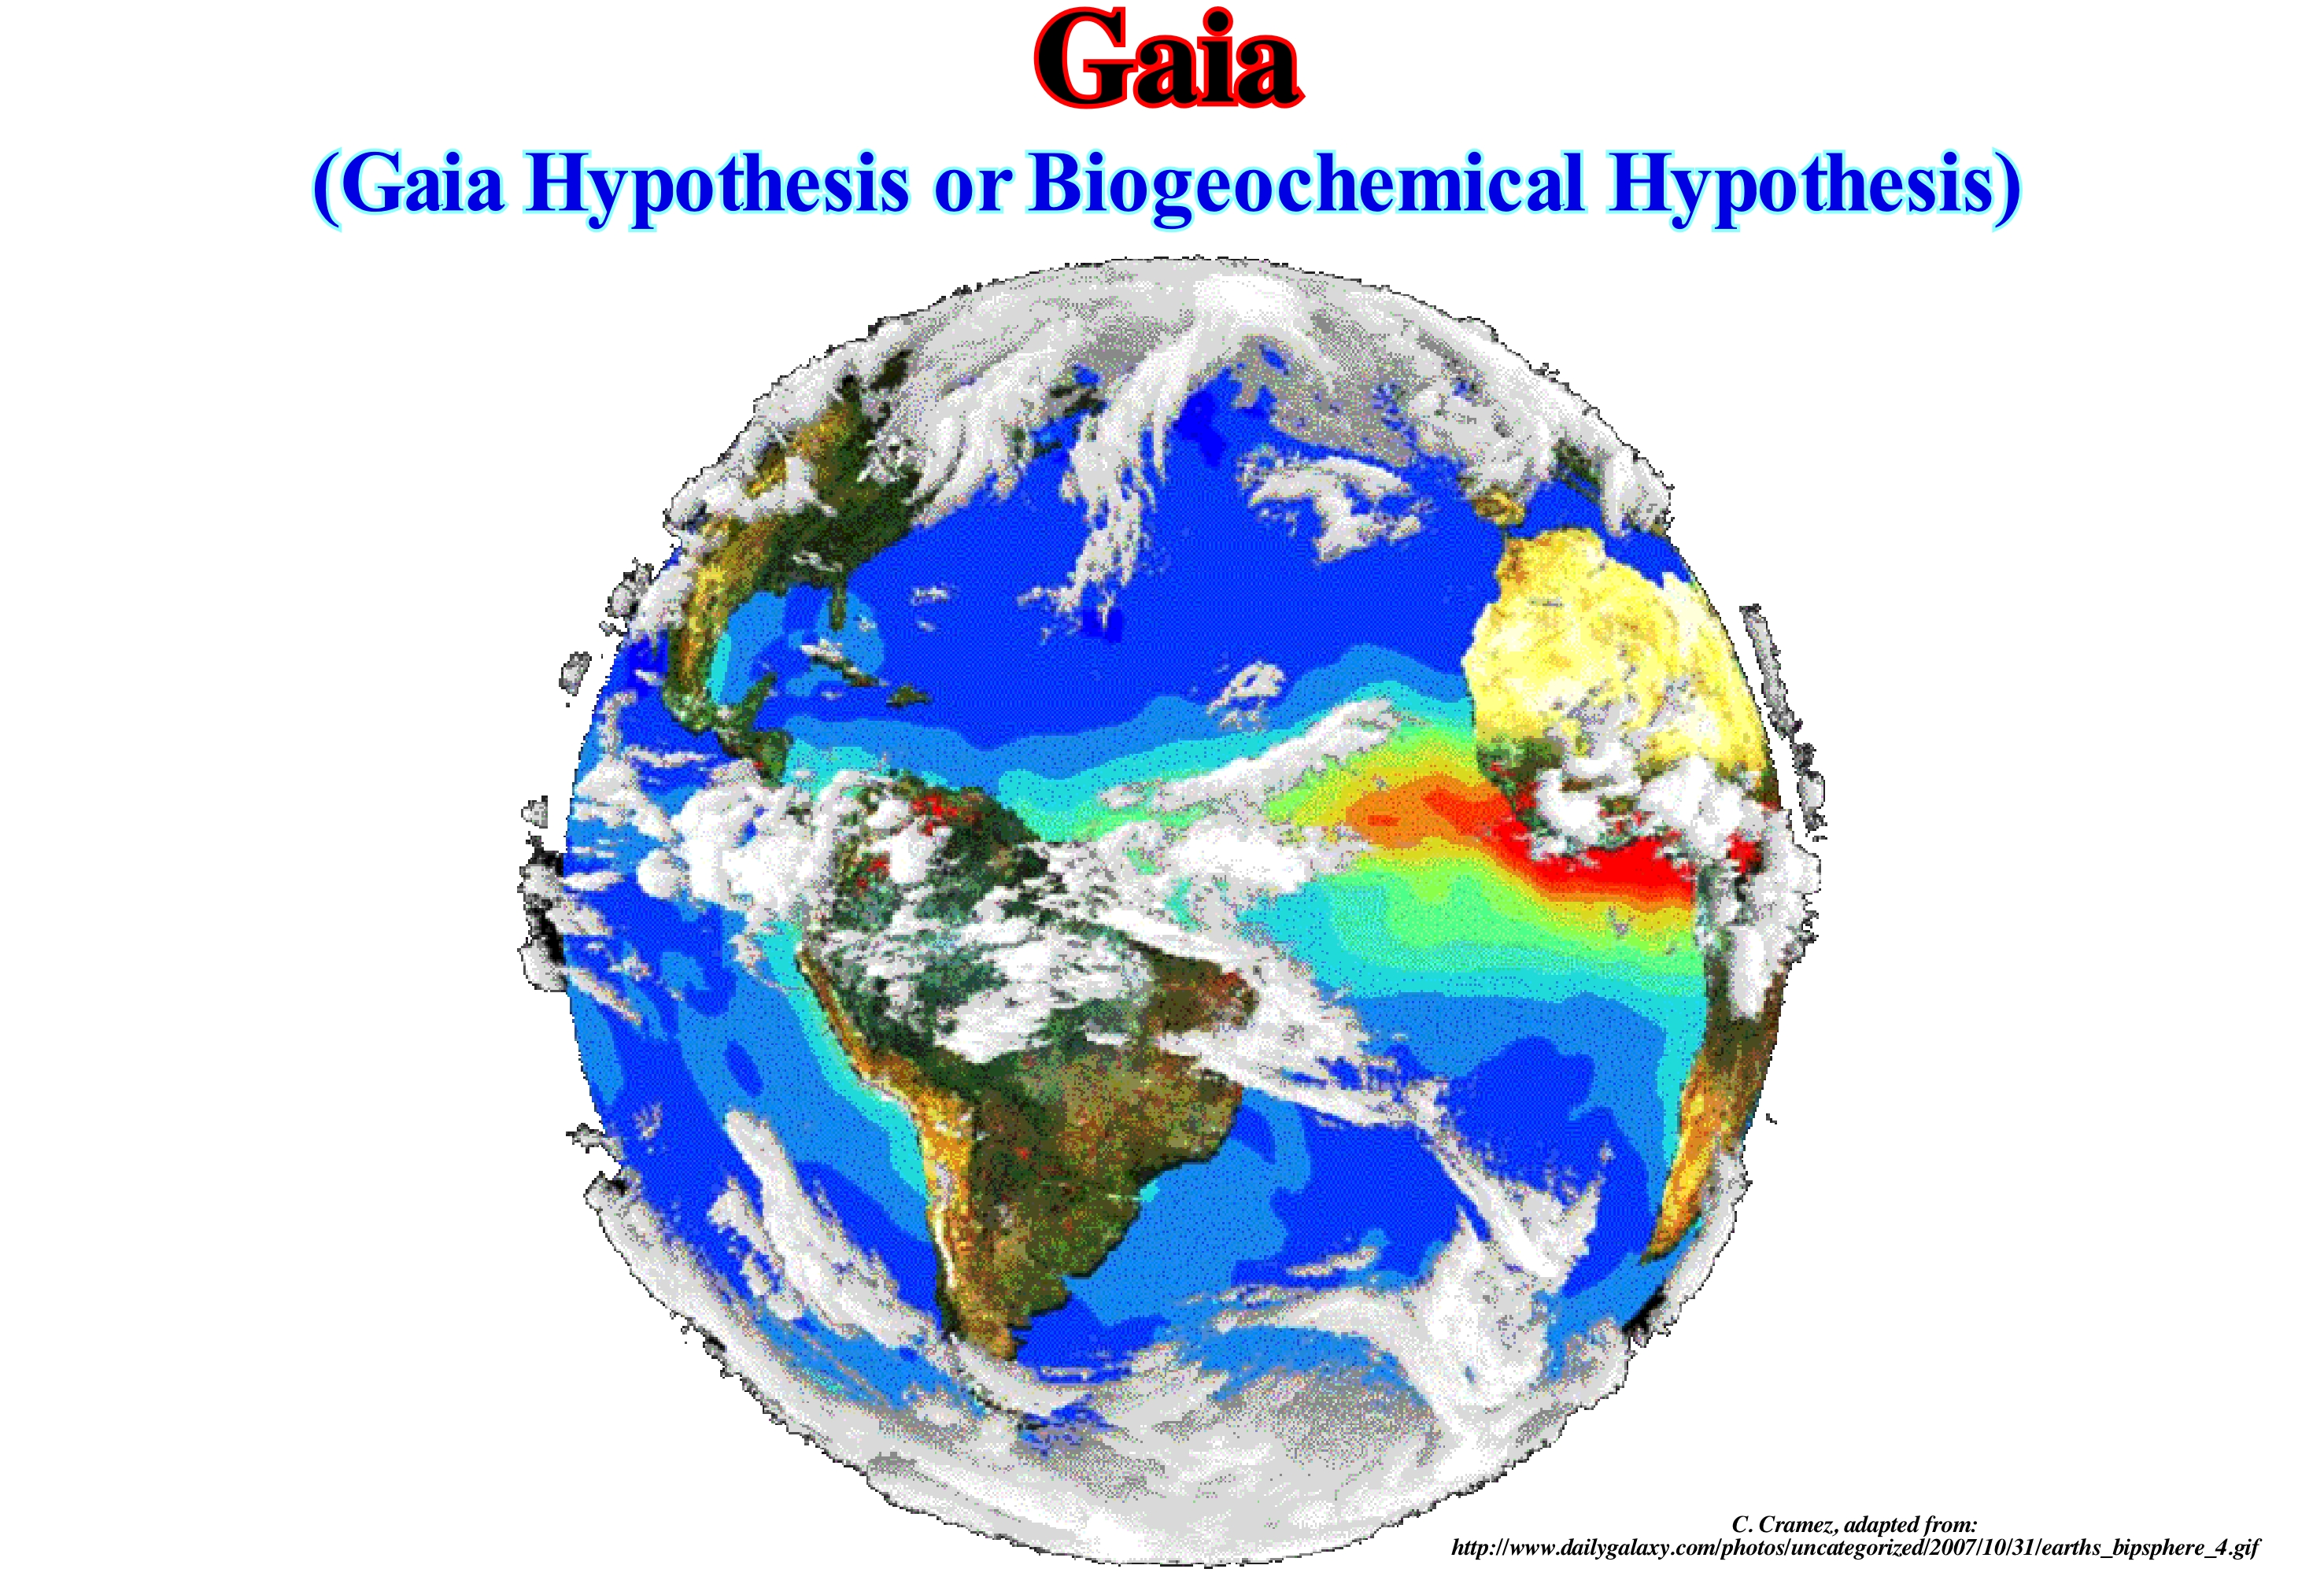
The Gaia hypothesis proposes that the biosphere and the physical components of the Earth (atmosphere, cryosphere, hydrosphere and lithosphere) are, intimately, integrated to form a complex system that maintain climatic and biogeochemical conditions in homeostasis*. Originally, proposed by James Lovelock as the Earth's response hypothesis, is often described as the Earth being a single living organism. Lovelock and other geoscientists who support the idea, now regard it as a scientific theory and not just a hypothesis. Gaia's hypothesis is not wrong. The Earth is, in fact, a self-regulated living system, capable of metabolising energy in a cybernetic way**. This hypothesis formulated as it is: "Earth is a living being," many geoscientists find it incomplete. According to Joël de Rosnay (2008), such a hypothesis seems to make man the end point of evolution and, thus, a dangerous geopolitical vision can be induced: (i) It is very global ; (ii) Takes the contribution of human cultures as an insignificant amount, or vice versa ; (III) Refuses the man because he is dangerous to the Gaia. In this sense, particularly, claimed by the adherents of deep ecology, the systemic thinking can become totalitarian, as certain geoscientists said. They think that systemic not as a point of arrival, but as a starting point. All models are points of departure for reflection, never points of arrival. A point of arrival implies that certain people believe and become totalitarians, like certain ecologists. A totalitarian vision can lead to all kinds of ideologies. For Rosnay, man is not a purpose, but a starting point and the catalyst for a new way of life, from which we can already trace the emergence.
(*) Property of an open system of regulating your internal environment to maintain a stable condition.
(**) Communication and control mechanisms, where, for instance, dark forests absorb light, while white spaces on the surface reflect it, which causes a whole atmospheric interactions system.
Gas......................................................................................................................................................................................................................................................................................Gás
Gaz / Gas / Gas/ 气体 / Газ / Gas /
Natural product resulting from the cracking of sediments organic matter when they are buried deep enough for the large molecules of hydrocarbons to break into smaller molecules, i.e., in molecules composed of 1 to 5 carbon atoms. The limiting case of a cracking is reached when the sediments reach about 5 km deep (function of the thermal flow), with the formation of methane (dry natural gas), whose molecule only has a carbon atom (CH4).
See: « Methane »
&
« Biogenic Gas »
&
« Gas Window »
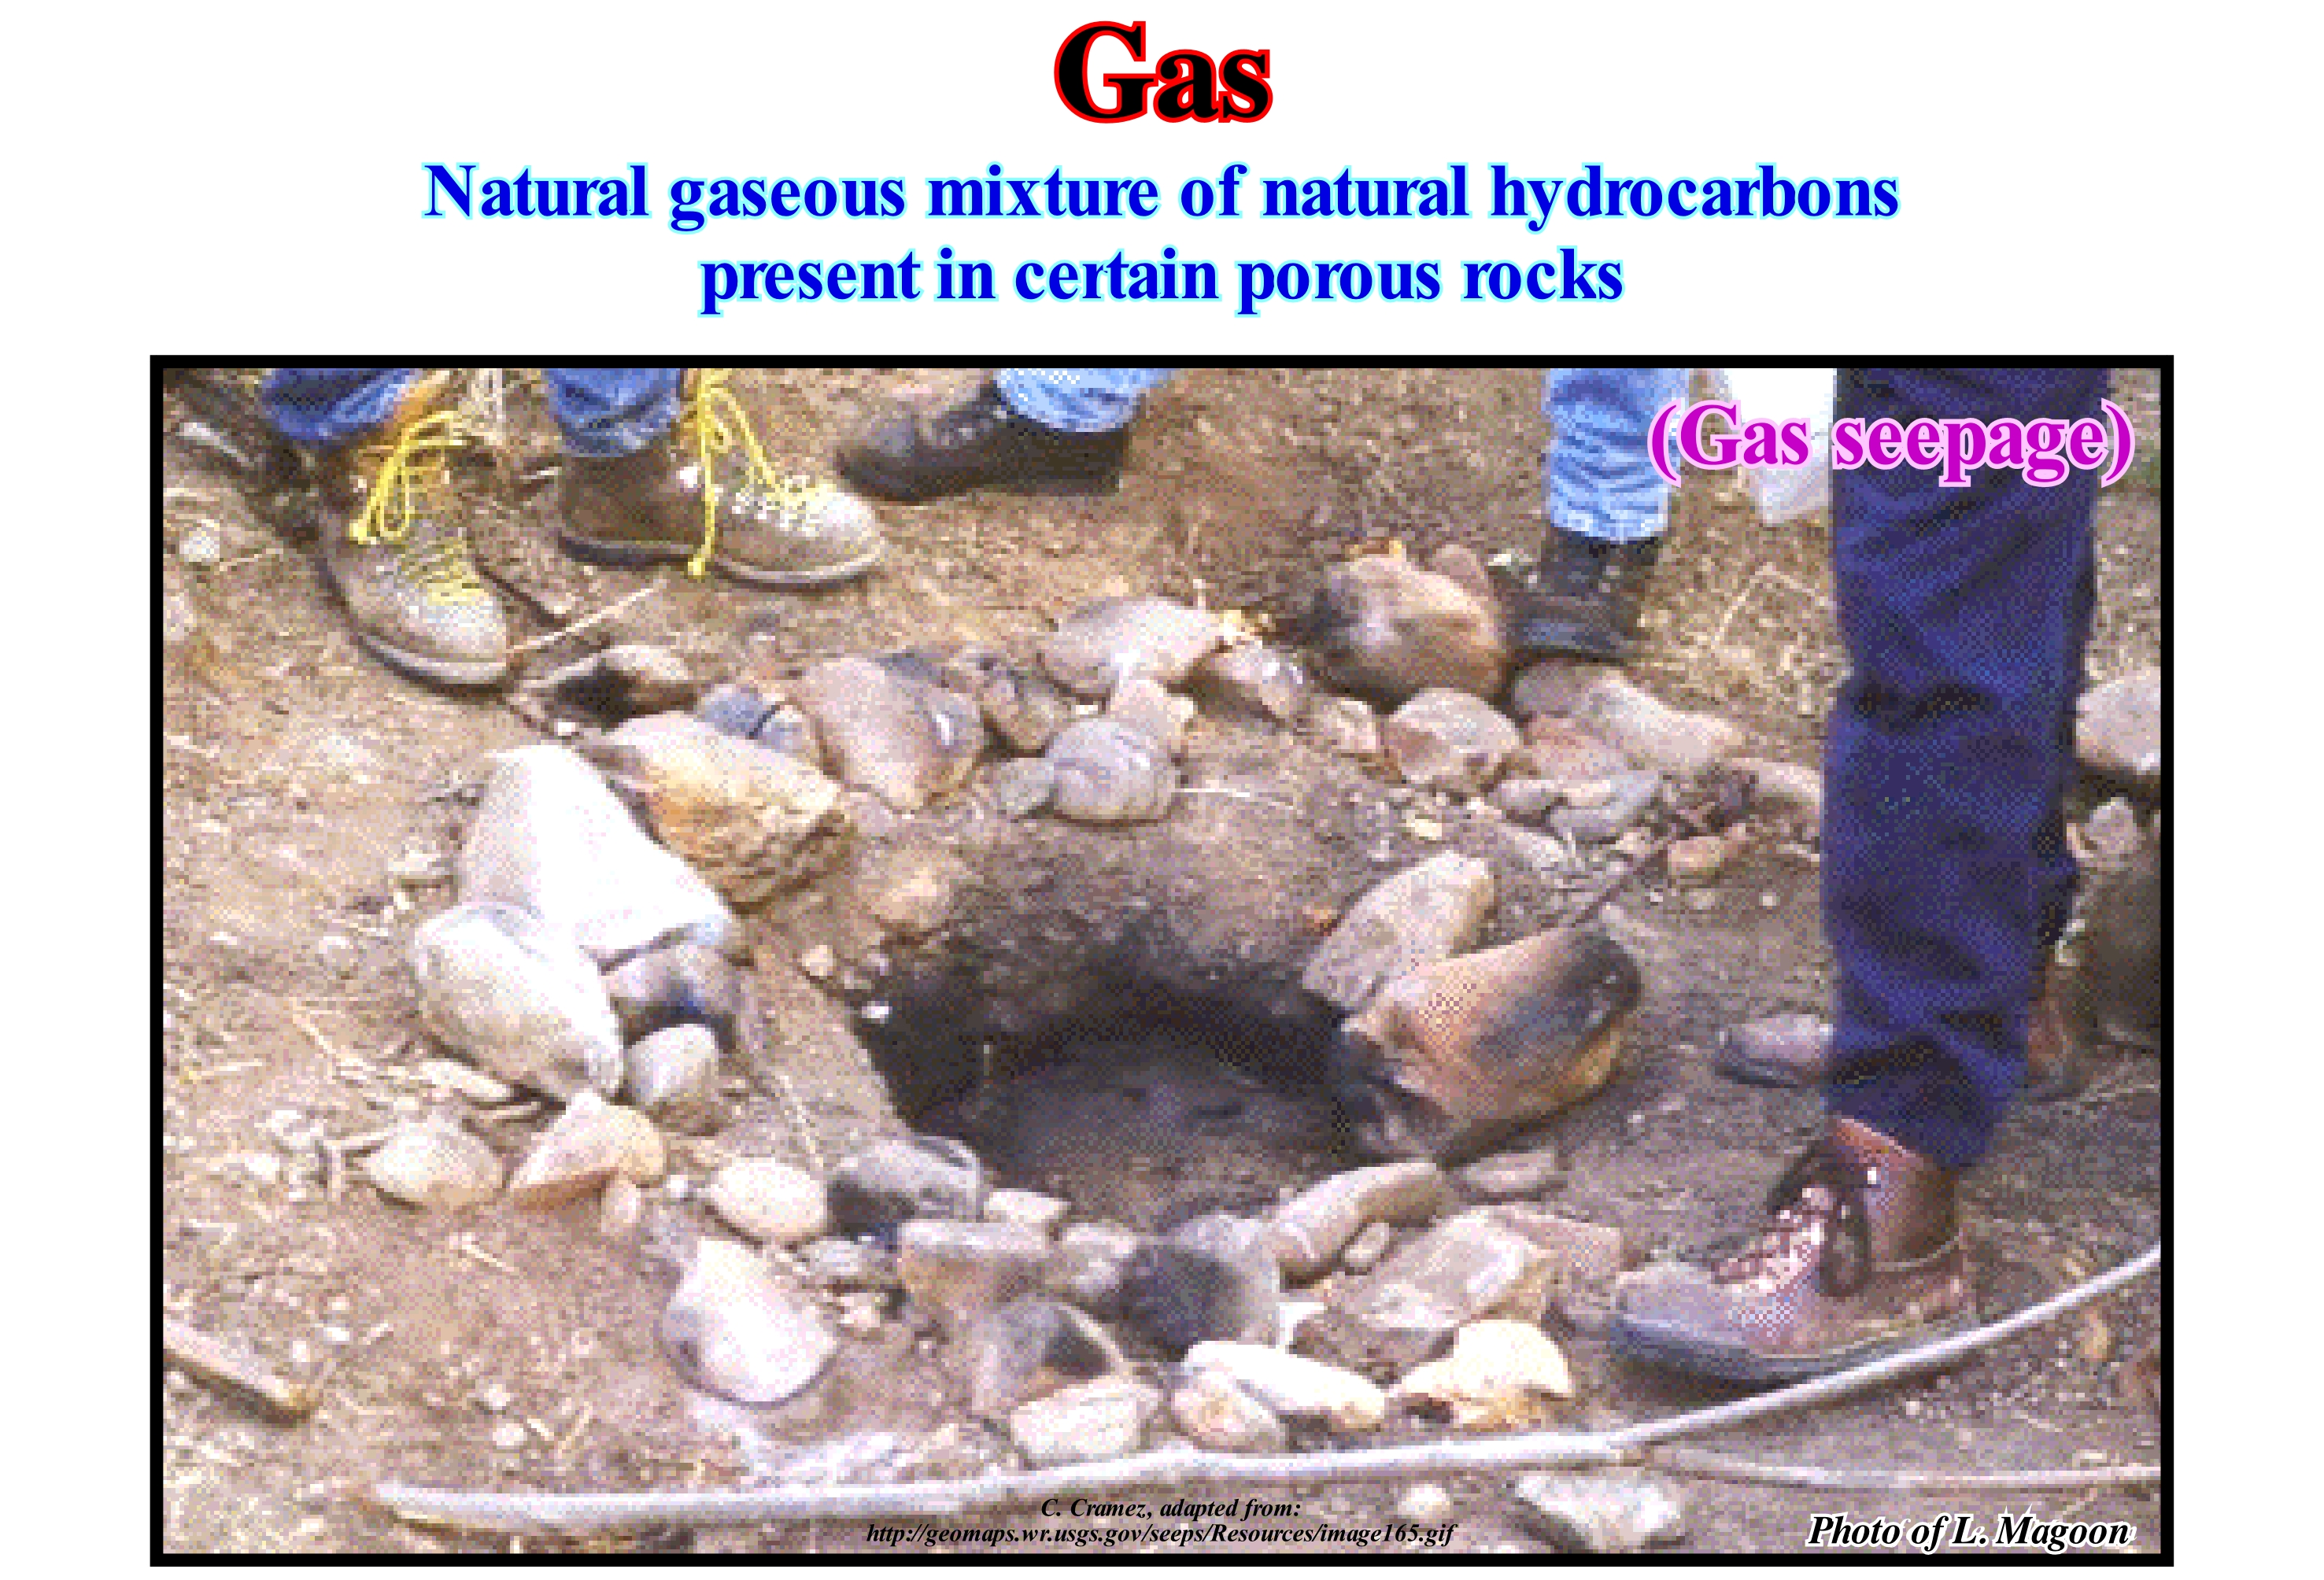
In the oil industry, geoscientists distinguish four types of gas: (i) Gas dissolved in oil; (ii) Coverage gas, which is sometimes above an accumulation of oil ; (iii) Gas formed underneath the oil window (usually methane) and (iv) Coal bed methane Gas of coal or or layered coal methane. Natural gas (methane) is rarely dry. It, often, has small amounts of ethane (C2H6), propane (C3H8), butane (C4H10), pentane (C5H12), which are removed before methane is used as fuel. In addition to these accessory gases, carbon dioxide (CO2), nitrogen (N), helium (He), hydrogen sulphide (SH2) and others may also be associated with methane. Natural gas or methane (all other gases are also natural) have two important characteristics: (i) Colourless and (ii) Odourless. From the environmental standpoint, natural gas (dry methane) is much more dangerous than oil. Oil is liquid and smells bad (much easier to detect in case of leakage). On other hand, gas is much harder to transport than oil. Without being toxic, it forms an explosive mixture when combined with air. In addition, it has a greenhouse effect 23 times greater than CO2, which is also non-toxic (not to be confused with CO). However, the environmental "lobby", for dogmatic reasons rather than ignorance, still considers natural gas (the petroleum is, also, natural) much less dangerous and less polluting than CO2 (which is true, 20-30% less). This photograph (taken by L. Magoon) illustrates a natural gas seepage in Humboldt County (California, USA), where the gas was used by local people to grill food. This seepage emits a mixture of flammable gases, including methane, ethane and pro pane.
Gas Clathrate (Hydrate of gas)....................................................................................................................................................Gaz de clathrate
Gás de clatrato / Gas de clatratos / Gashydrat / 天然气水合物 / Гидрат газа / Idrato Clatrato /
Crystalline solid resulting from the freezing of a mixture of gas and water (under the permafrost or the seabed). The dominant molecule of natural gas (methane), is just one of the dozen molecules that make clathrates. Among them are: nitrogen, oxygen, chlorine, carbon dioxide, chloroform, etc. Methane hydrate contains 4 molecules of methane and 23 molecules of water. It is not stable at temperature and ambient pressures. A relative sea level fall or an increase in global temperature, can release hydrates that are hundreds of feet below the seafloor and cause huge disasters, since it is a greenhouse gas highly flammable. Synonym with Hydrates of Gas.
See: « Methane »
&
« Biogenic Gas »
&
« Gas »
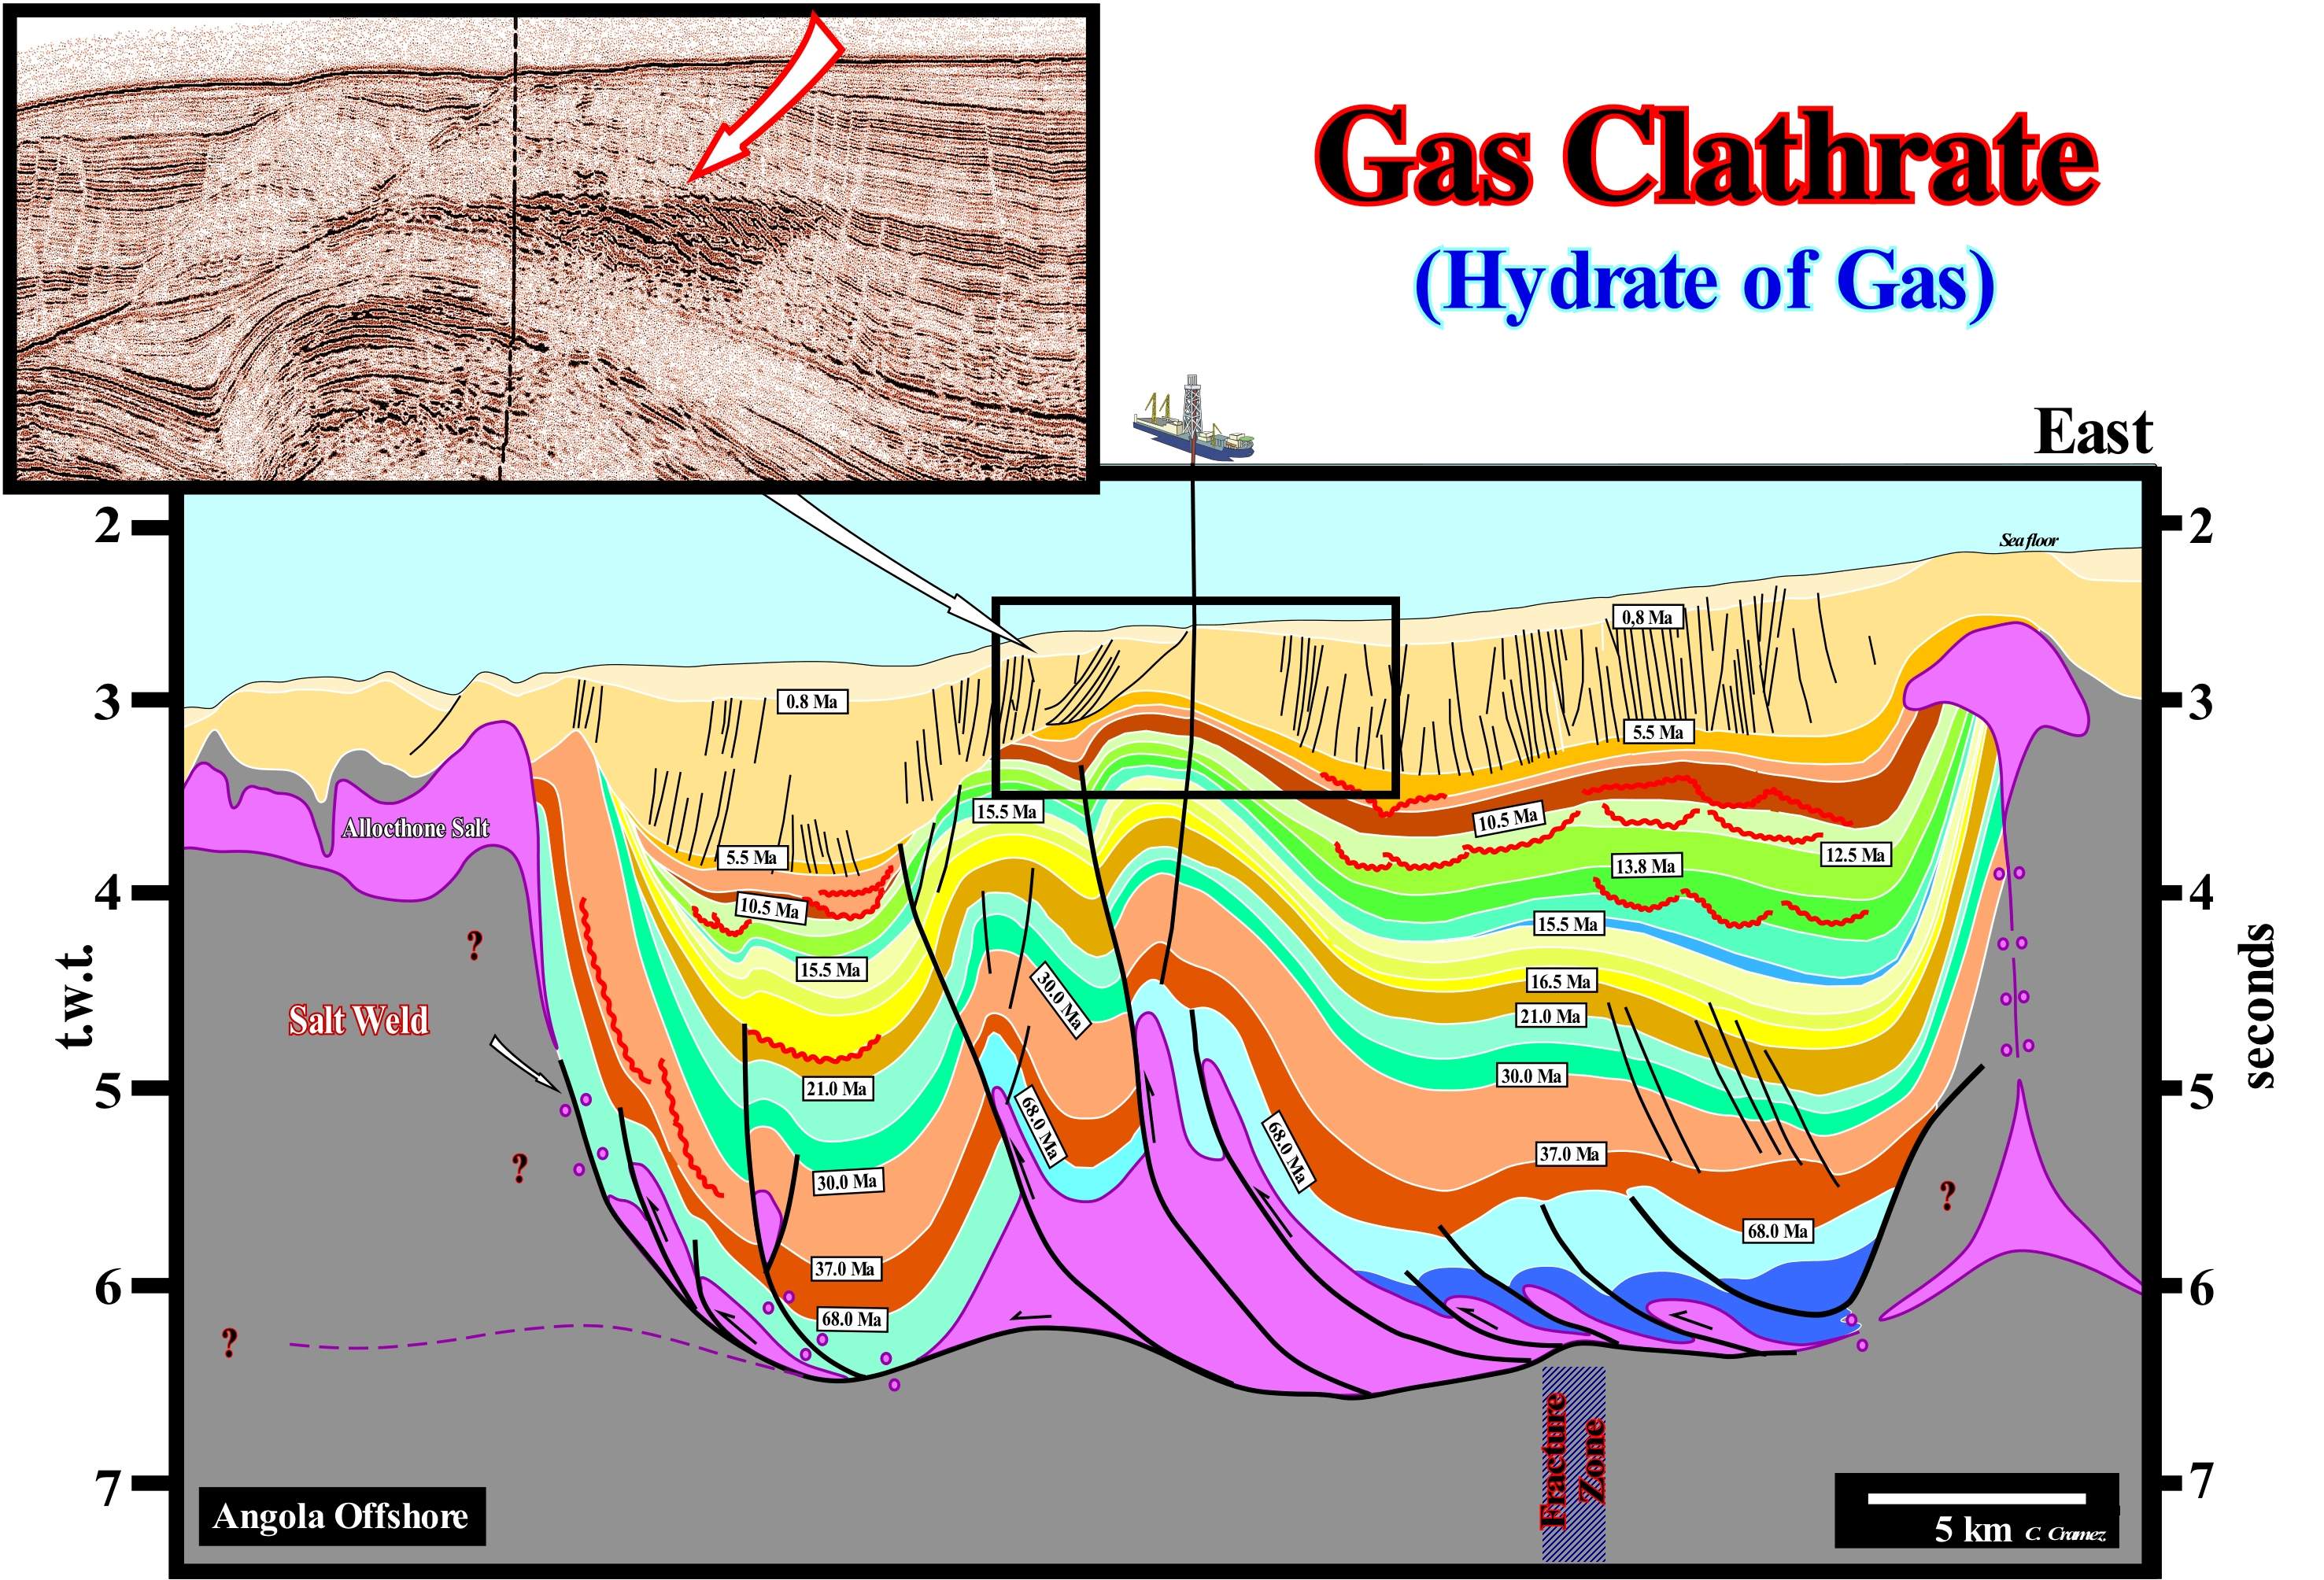
Clathrate gas is, basically, the natural gas stored in ice crystals, either in the permafrost area either on the ocean floor (burial less than 500 meters). On this tentative geological interpretation of a regional seismic line of the north of Angola deep offshore, the group of diachronic seismic reflections, i.e., reflections that cut the chronostratigraphic reflectors (detail of the seismic line above and to the left part of the figure), underlines the upper limit of the zone with gas hydrates or clathrates. This BSR (Bottom Simulating Reflector) is mimetic of the reflector associated with the sea floor. It can not be a multiple of the sea floor. The water-depth is greater than the distance between the sea floor and the reflector. Probably, the diachronic reflector corresponds to a BSR induced by natural gas droplets (methane) at the base of the clathrate gas stability zone, which can not be considered as an impermeable zone (sealing area). The porosity is filled (more than 95%) by water. Although some geoscientists claim, in some offshores, potential resources associated with hydrates in excess of 100,000 Tcf*, no one is currently able to recover methane from gas hydrates. They disappear as long as the drilling bit penetrates the clathrates. Several drilling rigs have sank when the exploration wells have entered the hydrate zone before prevention devices have been installed. The released gas, rapidly, reaches the surface and creates a low density fluid, which forces the drilling rig to sink to the bottom of the sea floor according to the Archimedes principle. The Clathrate Gas Stability Zone (CGSZ) occurs in the first few hundred meters of sea floor sediments. In this zone, all the methane produced by the decomposition of organic matter, including seepages coming from underneath, is converted into solid hydrates and stored, in situ. The origin of methane is poorly understood. Even its biogenic origin is put in doubt. At present time, there is no gas production from clathrates. Although, some geoscientists think that in the Messoyakha field (northern of central Siberia), where clathrates serve as vertical sealing for gas accumulation, the clathrates have contributed to production. Some geoscientists think, that in the future, clathrate gas can partly solve the energy problem. However the vast majority of the geoscientists do not believe. When the BSR is crossed by an exploration well, the gas disappears.
(*) Natural gas volume measure used by the US oil and gas industry. One trillion cubic feet (1x 1012 = 1 000 000 000 000 cubic feet) is a measure of volume that is equivalent to approximately a Quad of Btu (British Thermal Unit). A Quad is an abbreviation for quadrillion or one thousand trillion (1 x 1015 = 1 000 000 000 000 000) Btu. A Btu (British Thermal Unit) is a unit of measure for energy, which represents the amount of heat that is needed to raise the temperature of a pound of water to a Fahrenheit degree at sea level.
Gas Condensate......................................................................................................................................................................................Gaz à condensât
Gás Condensado / Gas condensado / Gas-Kondensat / 凝析气 / Газоконденсат / Gas condensato /
One of the liquid hydrocarbons dissolved in the saturated natural gas leaving the solution when the pressure is below the dew point. Condensate gases are a mixture of low density liquid hydrocarbons present as gaseous components in many natural gas fields. This mixture condenses when the temperature is reduced below the temperature and pressure of the dew point of the gas. Condensed gases are also called simply condensate or even sometimes gasoline because they contain hydrocarbons within the gasoline boiling range.
See: « Methane »
&
«Convencional Gas »
&
« Petroleum »
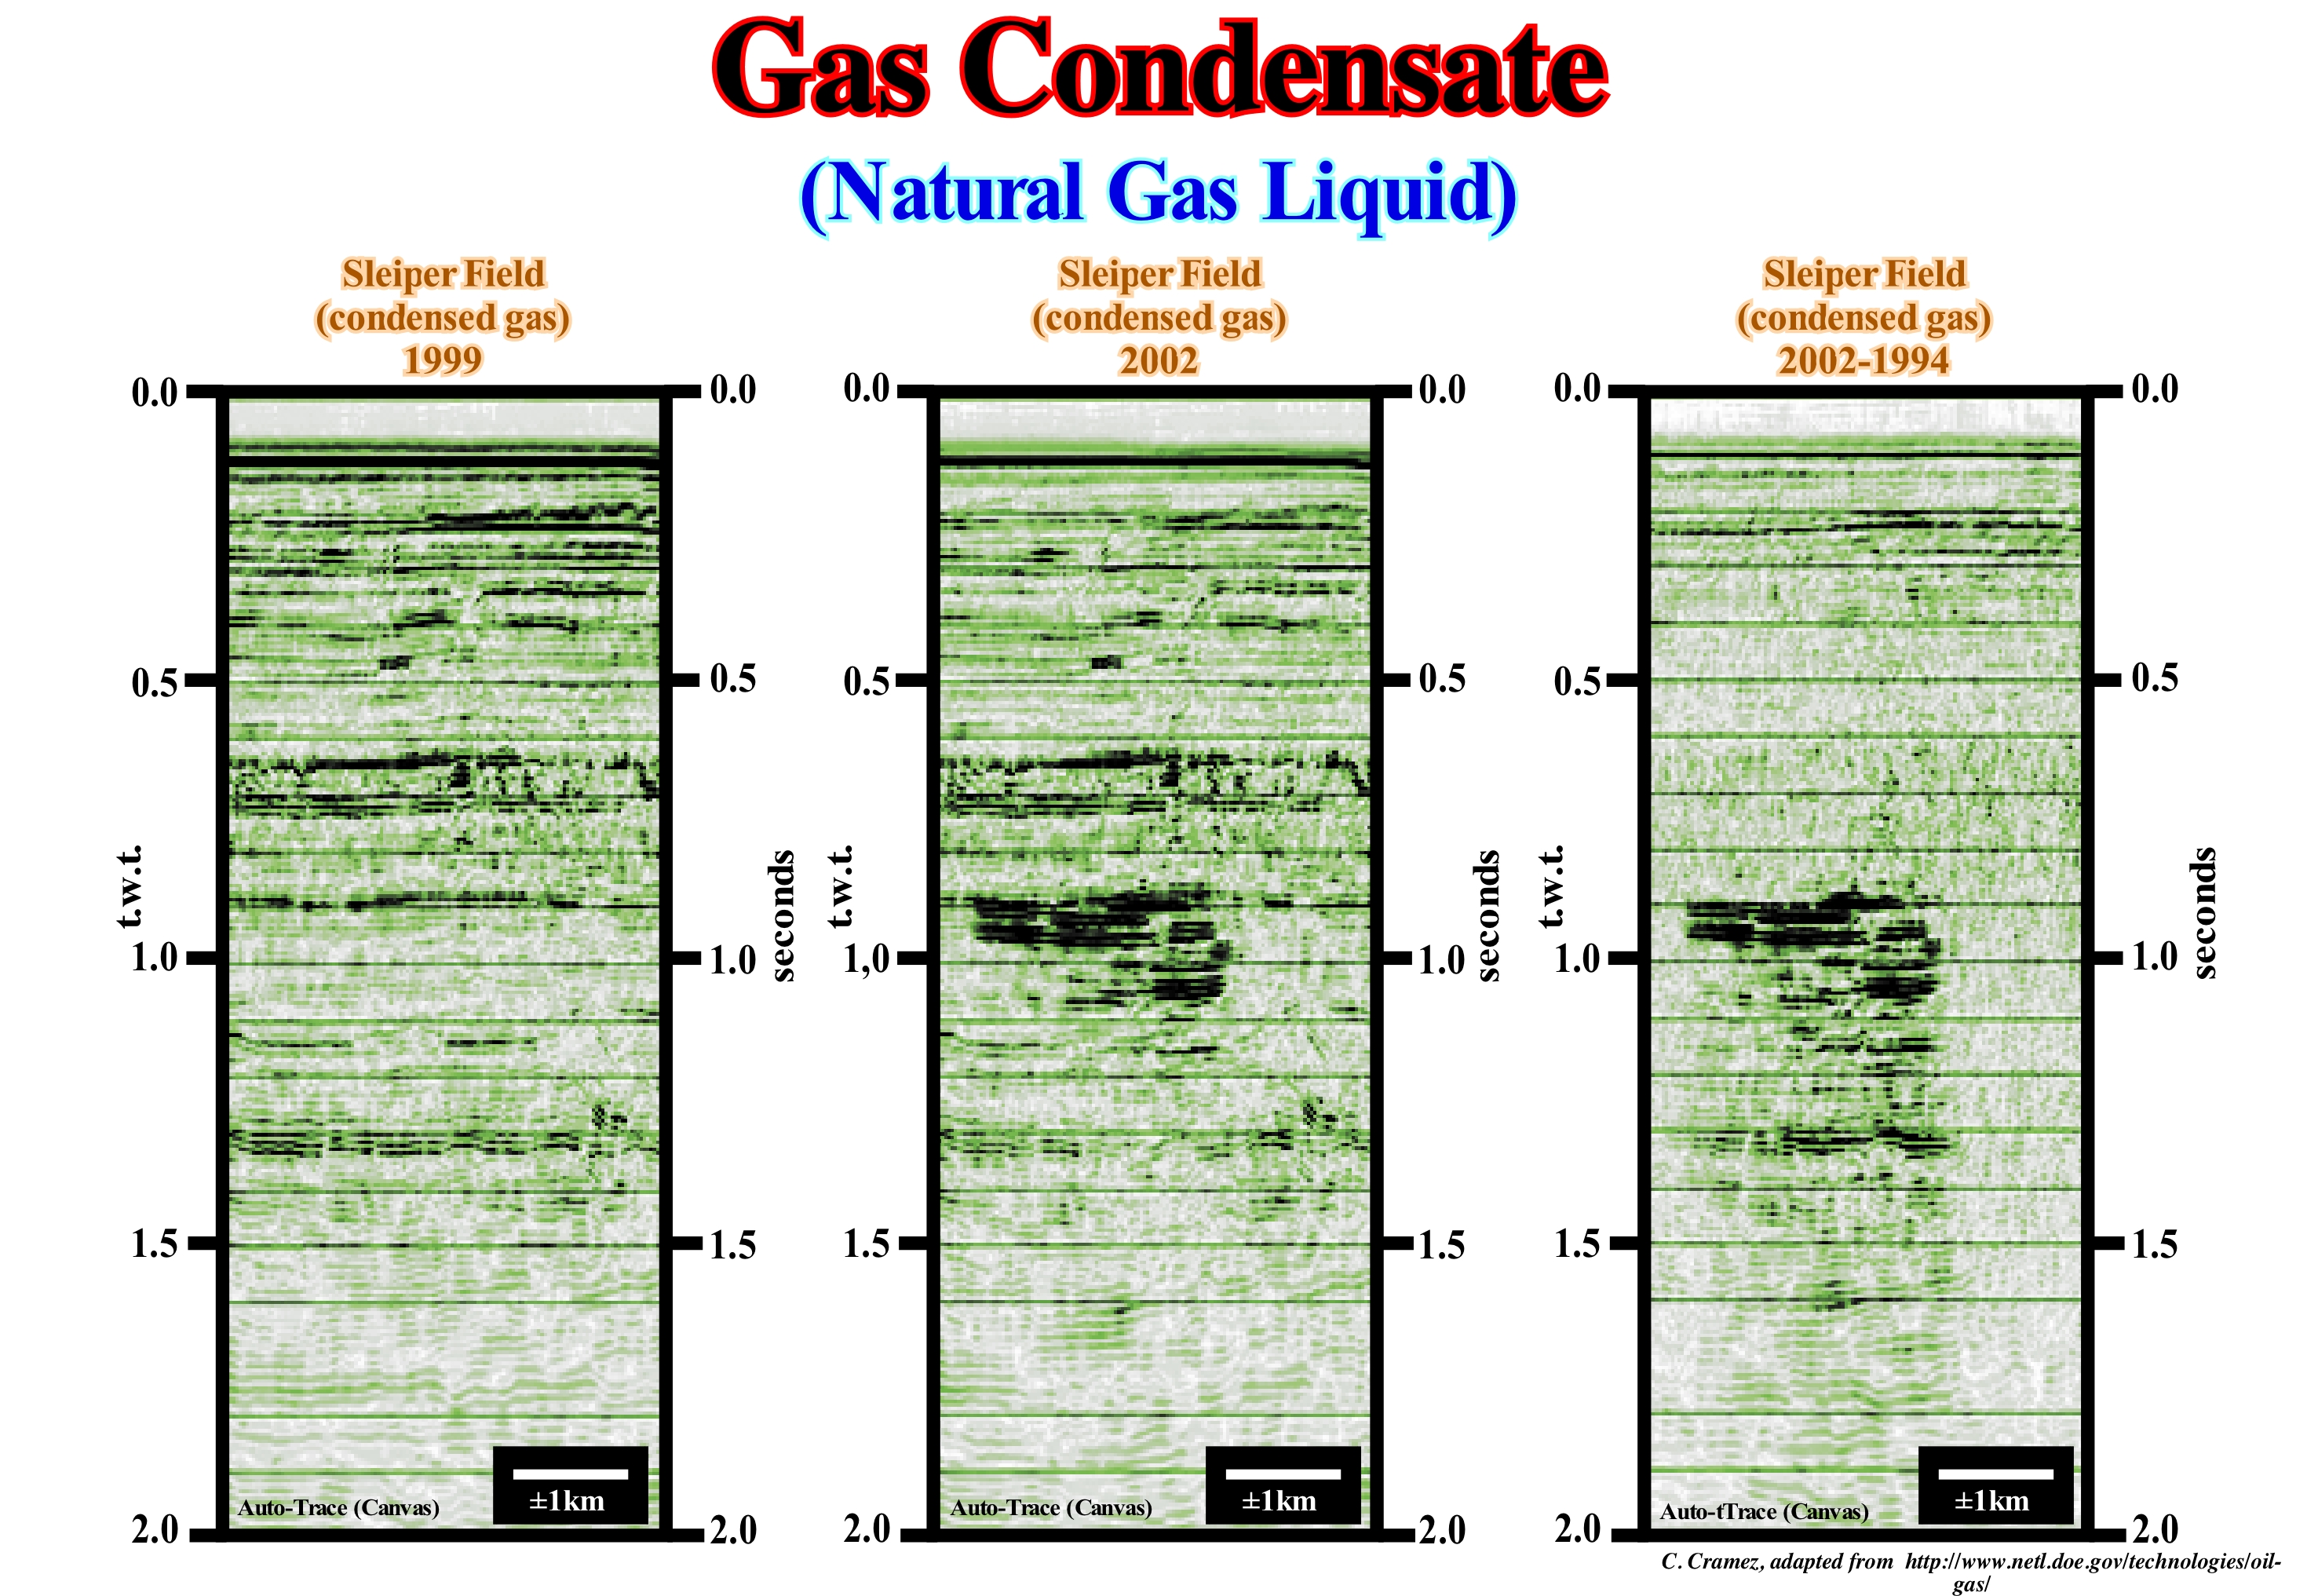
These Canvas auto-trace details of seismic lines illustrate the evolution of the condensed gases production in the Sleiper field (natural gas/condensates giant field in the Norwegian part of the North Sea) between 1999 and 2002. This evolution is underlined by the seismic reflections induced by the successive CO2 injections in the reservoir-rocks. The CO2 injection started in 1996. The auto-traces (in this figure is just illustrated gas field) were taken in 1999 (left auto-trace) and 2002 (central auto-trace). The auto-trace on the right corresponds to the difference between the auto-traces taken in 1994 and 2002. An amplitude anomaly is, perfectly, visible on all auto-traces at about 900 milliseconds (t.w.t.). In the United States, CO2 injection has become a very important enhanced oil recovery (EOR) technique, also called tertiary recovery, to recover residual oil. About half of the world's CO2 injections are made in the Permian Basin. They contribute to the production of more than 20% of the total oil production of the basin. It can be said that CO2 injections in the US increase by about 43 Gb to conventional reserves. It is clear that if CO2 is one of the factors responsible for the increase in global temperature (a very contentious conjecture, but admitted by many politicians, journalists, ecologists and certain geoscientists), CO2 injections into reservoir-rocks sequester large amounts of CO2 (provided there are no dismigration*) and therefore are good for the environment. However, CO2 has to be available not far from the fields, otherwise any environmental project (not to be confused with business) will be a pure utopia.
(*) Migration to the surface, either from a reservoir-rock or source-rock. Also called tertiary migration.
Gas from Fractured Shales...............................................................................................Gaz des schistes (Argiles fracturées)
Gás das rochas argilosas fracturadas / Gas de arcillas fracturadas / Gas aus gebrochenen Schiefers / 天然气从裂缝页岩 / Газ из растрескавшихся глинистых сланцев / Gas da scisti fratturati /
Gas produced from relatively organic fractured clayey rocks, such as that produced in the State of New York (USA) since 1821. This production of type of gas contributes to a significative United States gas production*.
See: « Methane »
&
« Biogenic Gas »
&
« Unconvencional Gas »
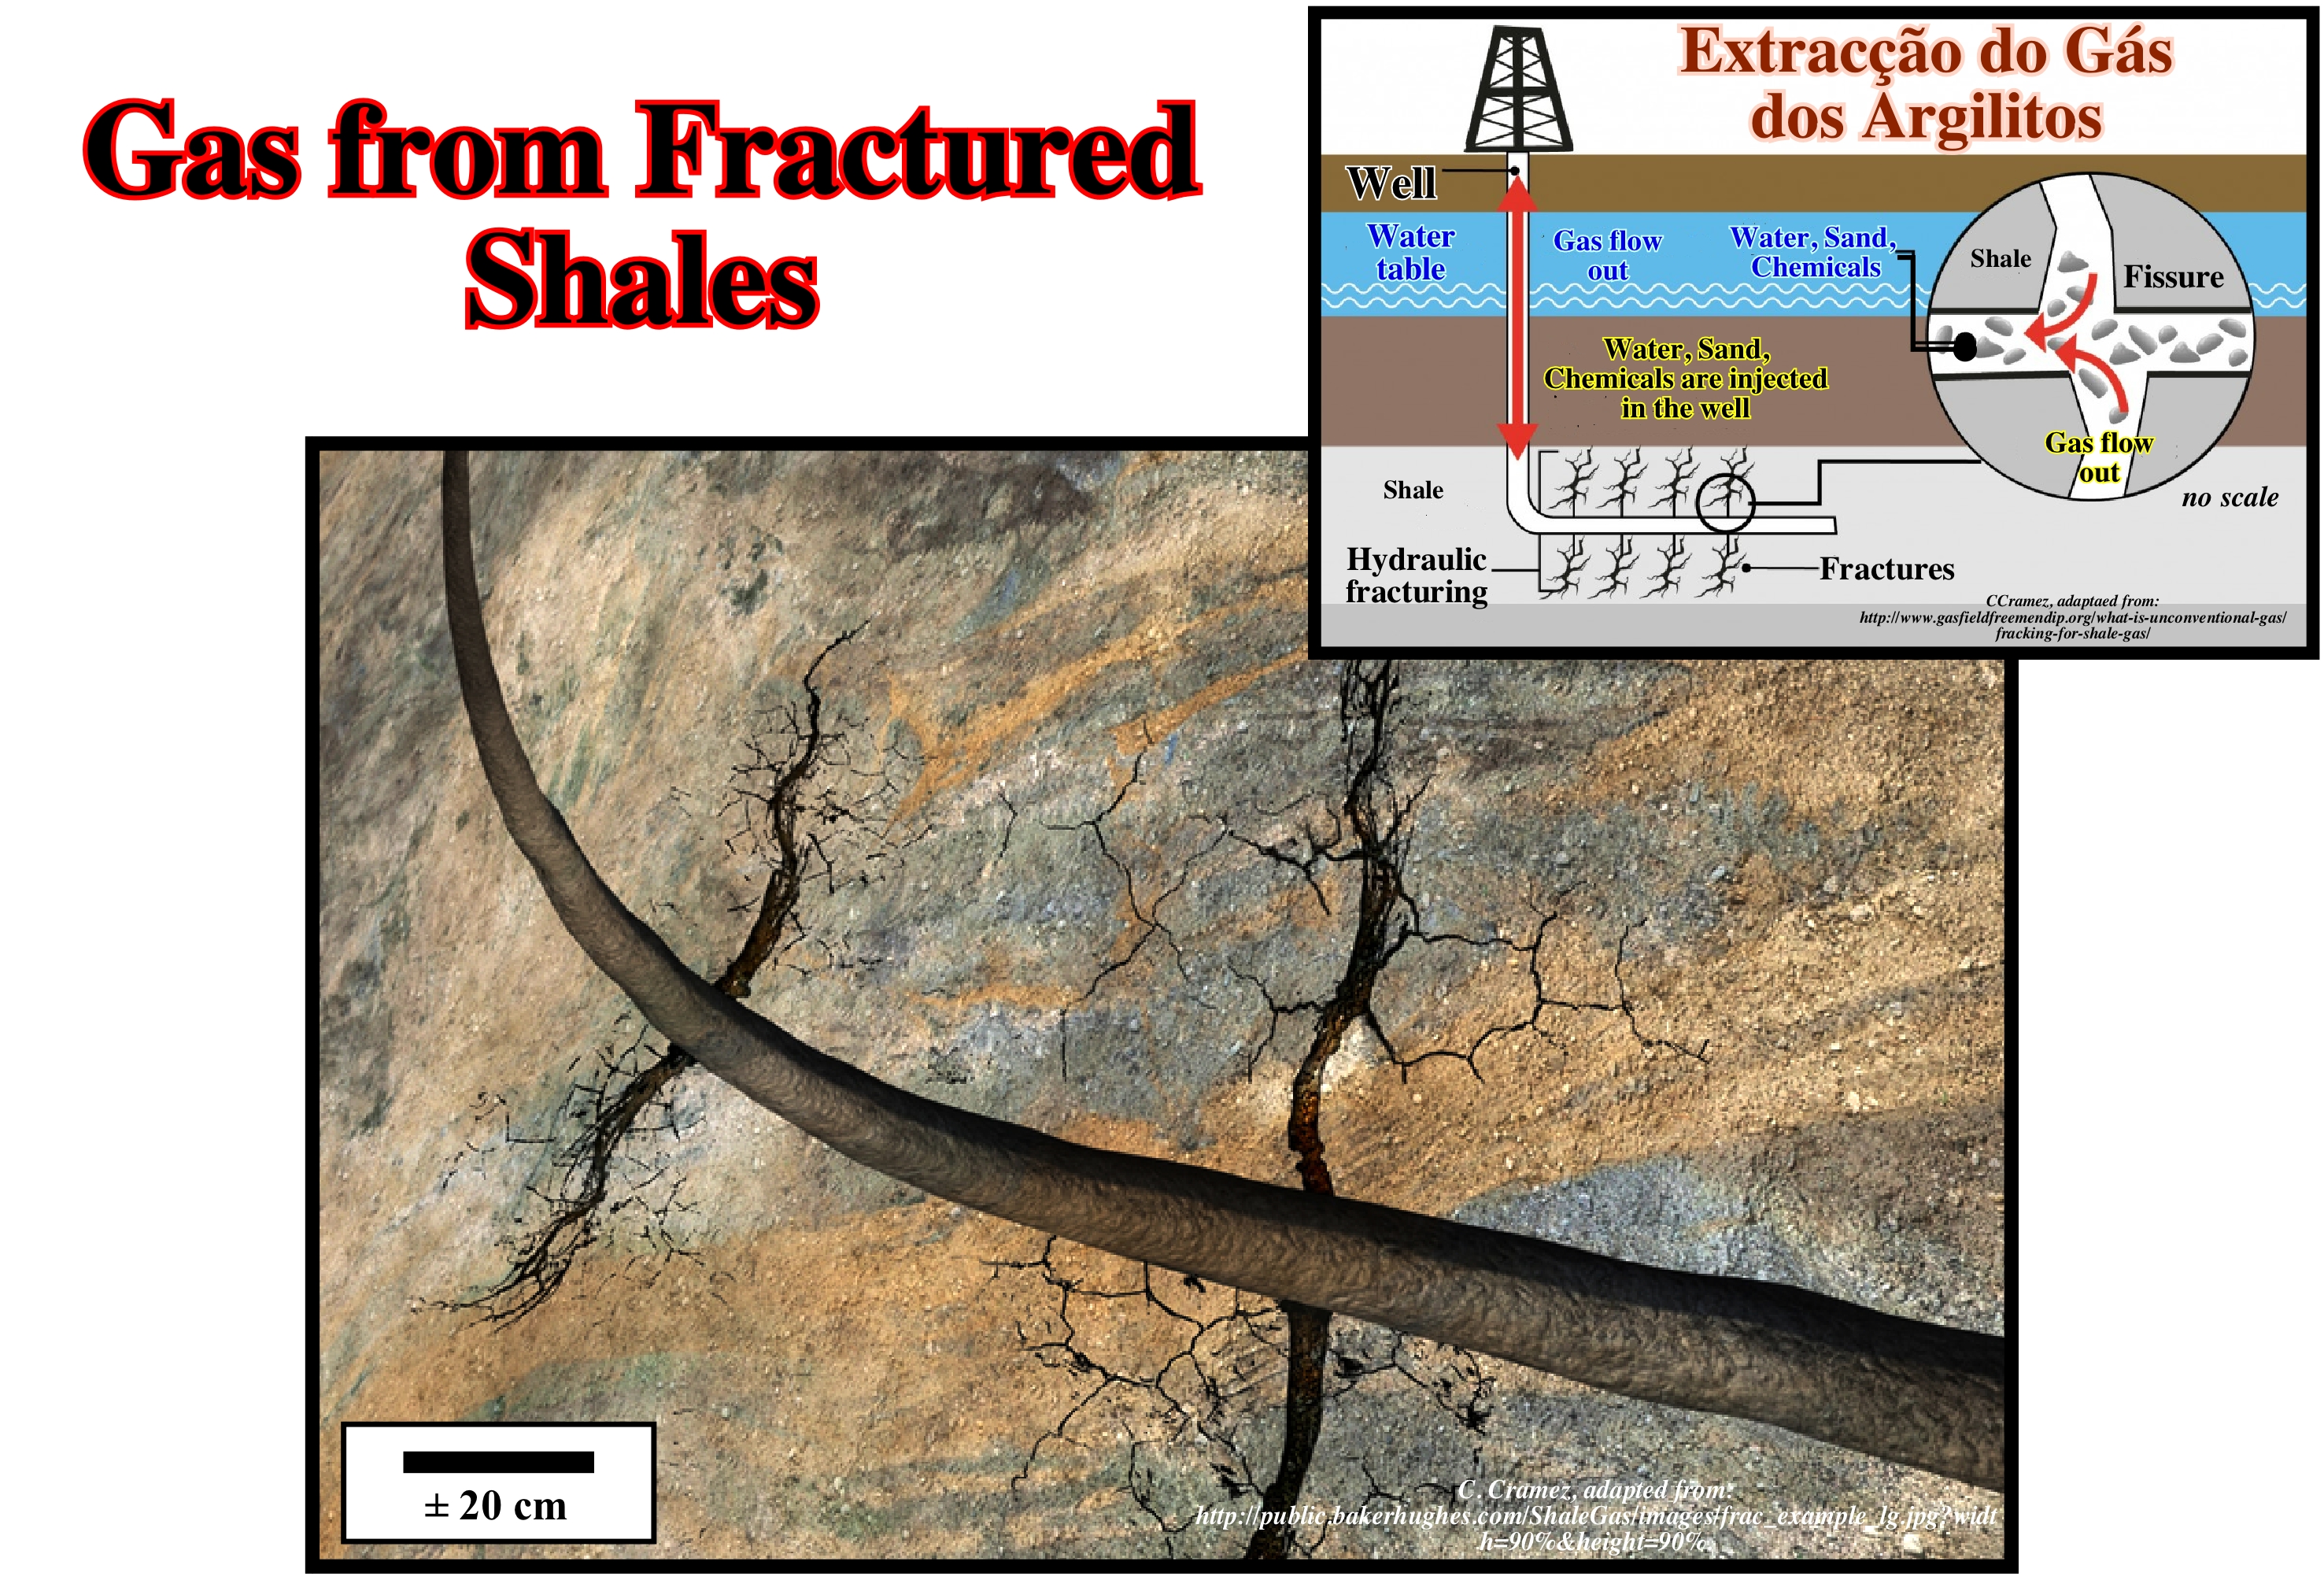
The exploration of gas from organic rich fractured shaly rocks, as illustrated in this figure, has long been ignored by the major oil companies. They have focused the gas exploration on easier objectives with faster investment returns, i.e., production of conventional gas. With the drop in conventional gas reserves that has caused a significant rise in prices, this type of exploration (gas from fractured shales ) is making the fortune of medium-sized oil companies. This is, particularly, true, in the United States, where the amount of natural gas trapped (in situ) in this type of reservoir is estimated to be around 500-780 Tcf. In the state of Texas, for instance, the gas exploration from the shales of the Barnett formation (Mississippian age, i.e., , about 330 Ma) has been a tremendous success. Certain geoscientists have suggested that these shales form, certainly, the largest onshore gas field in the United States. The proved reserves are around 2.5 Tcf of natural gas (resources about 30 Tcf **). Small amounts of oil are also found in Barnett shales. They will be, economically, profitable when the price of oil, steadily, reaches at least 110 US dollars. It is these reserves and, above all, the gas production from the shales and impermeable sands, which explains the difference in gas prices between Europe and United States. The challenge for oil companies is to release gas from a rock that is almost as tight (impermeable) as cement. Recent progress in drilling and production, such as hydraulic fracturing, is making gas from this type of rocks, largely economical (when the price of the barrel is above 70-80 US $.) Attempts to exploration and produce these reservoir-rocks have been made in several other countries, such as Canada (Saskatchewan, Alberta and British Columbia). However, so far (2005) very few economically viable project has been announced.
(*) In its Annual Energy Outlook for 2011, the US Energy Information Administration (EIA) more than doubled its estimate of technically recoverable shale gas reserves in the US, to 827 trillion cubic feet (23.4 trillion cubic metres) from 353 trillion cubic feet (10.0 trillion cubic metres), by including data from drilling results in new shale fields, such as the Marcellus, Haynesville, and Eagle Ford shales. In 2012 the EIA lowered its estimates again to 482 tcf. Shale production is projected to increase from 23% of total US gas production in 2010 to 49% by 2035. (https://en.wikipedia.org/wiki/Shale_gas_in_the_United_States).
(**) A 'Trillion Cubic Feet' or Tcf is a measure of volume used in the oil industry. One trillion cubic feet (1 000 000 000 000 = 1012 cubic feet) is a measure of the volume of natural gas equivalent to approximately one Quad. A Quad is the abbreviation for a quadrillion (1000000000000000 = 1015 or 1,000 trillion) Btu. A Btu (British Thermal Unit) is a unit of energy measurement, which represents the amount of heat needed to raise the temperature of a pound of water by one degree Fahrenheit.
Gas Hydrate (Gas clathrate)................................................................................................................................................................Gaz de hydrate
Gás de hidrato / Gas de clatratos / Gas Clathraten / 天然气水合物 / Газовые гидраты / Gas clatrati /
Crystalline solid resulting from the freezing of a mixture of gas and water (under the permafrost or the seabed). The dominant molecule of natural gas, i.e., the methane, is only one of the dozen molecules that make clathrates. Among them are: nitrogen, oxygen, chlorine, carbon dioxide, chloroform, etc. Methane hydrate contains 4 molecules of methane and 23 molecules of water. It is not stable at temperature and ambient pressures. A relative drop in sea level, or an increase in global temperature, can release hydrates that are hundreds of feet below the sea floor and cause huge disasters, since it is a greenhouse gas highly flammable. Synonym with Gas Clathrate.
See: « Methane »
&
« Gas »
&
« Biogenic Gas »
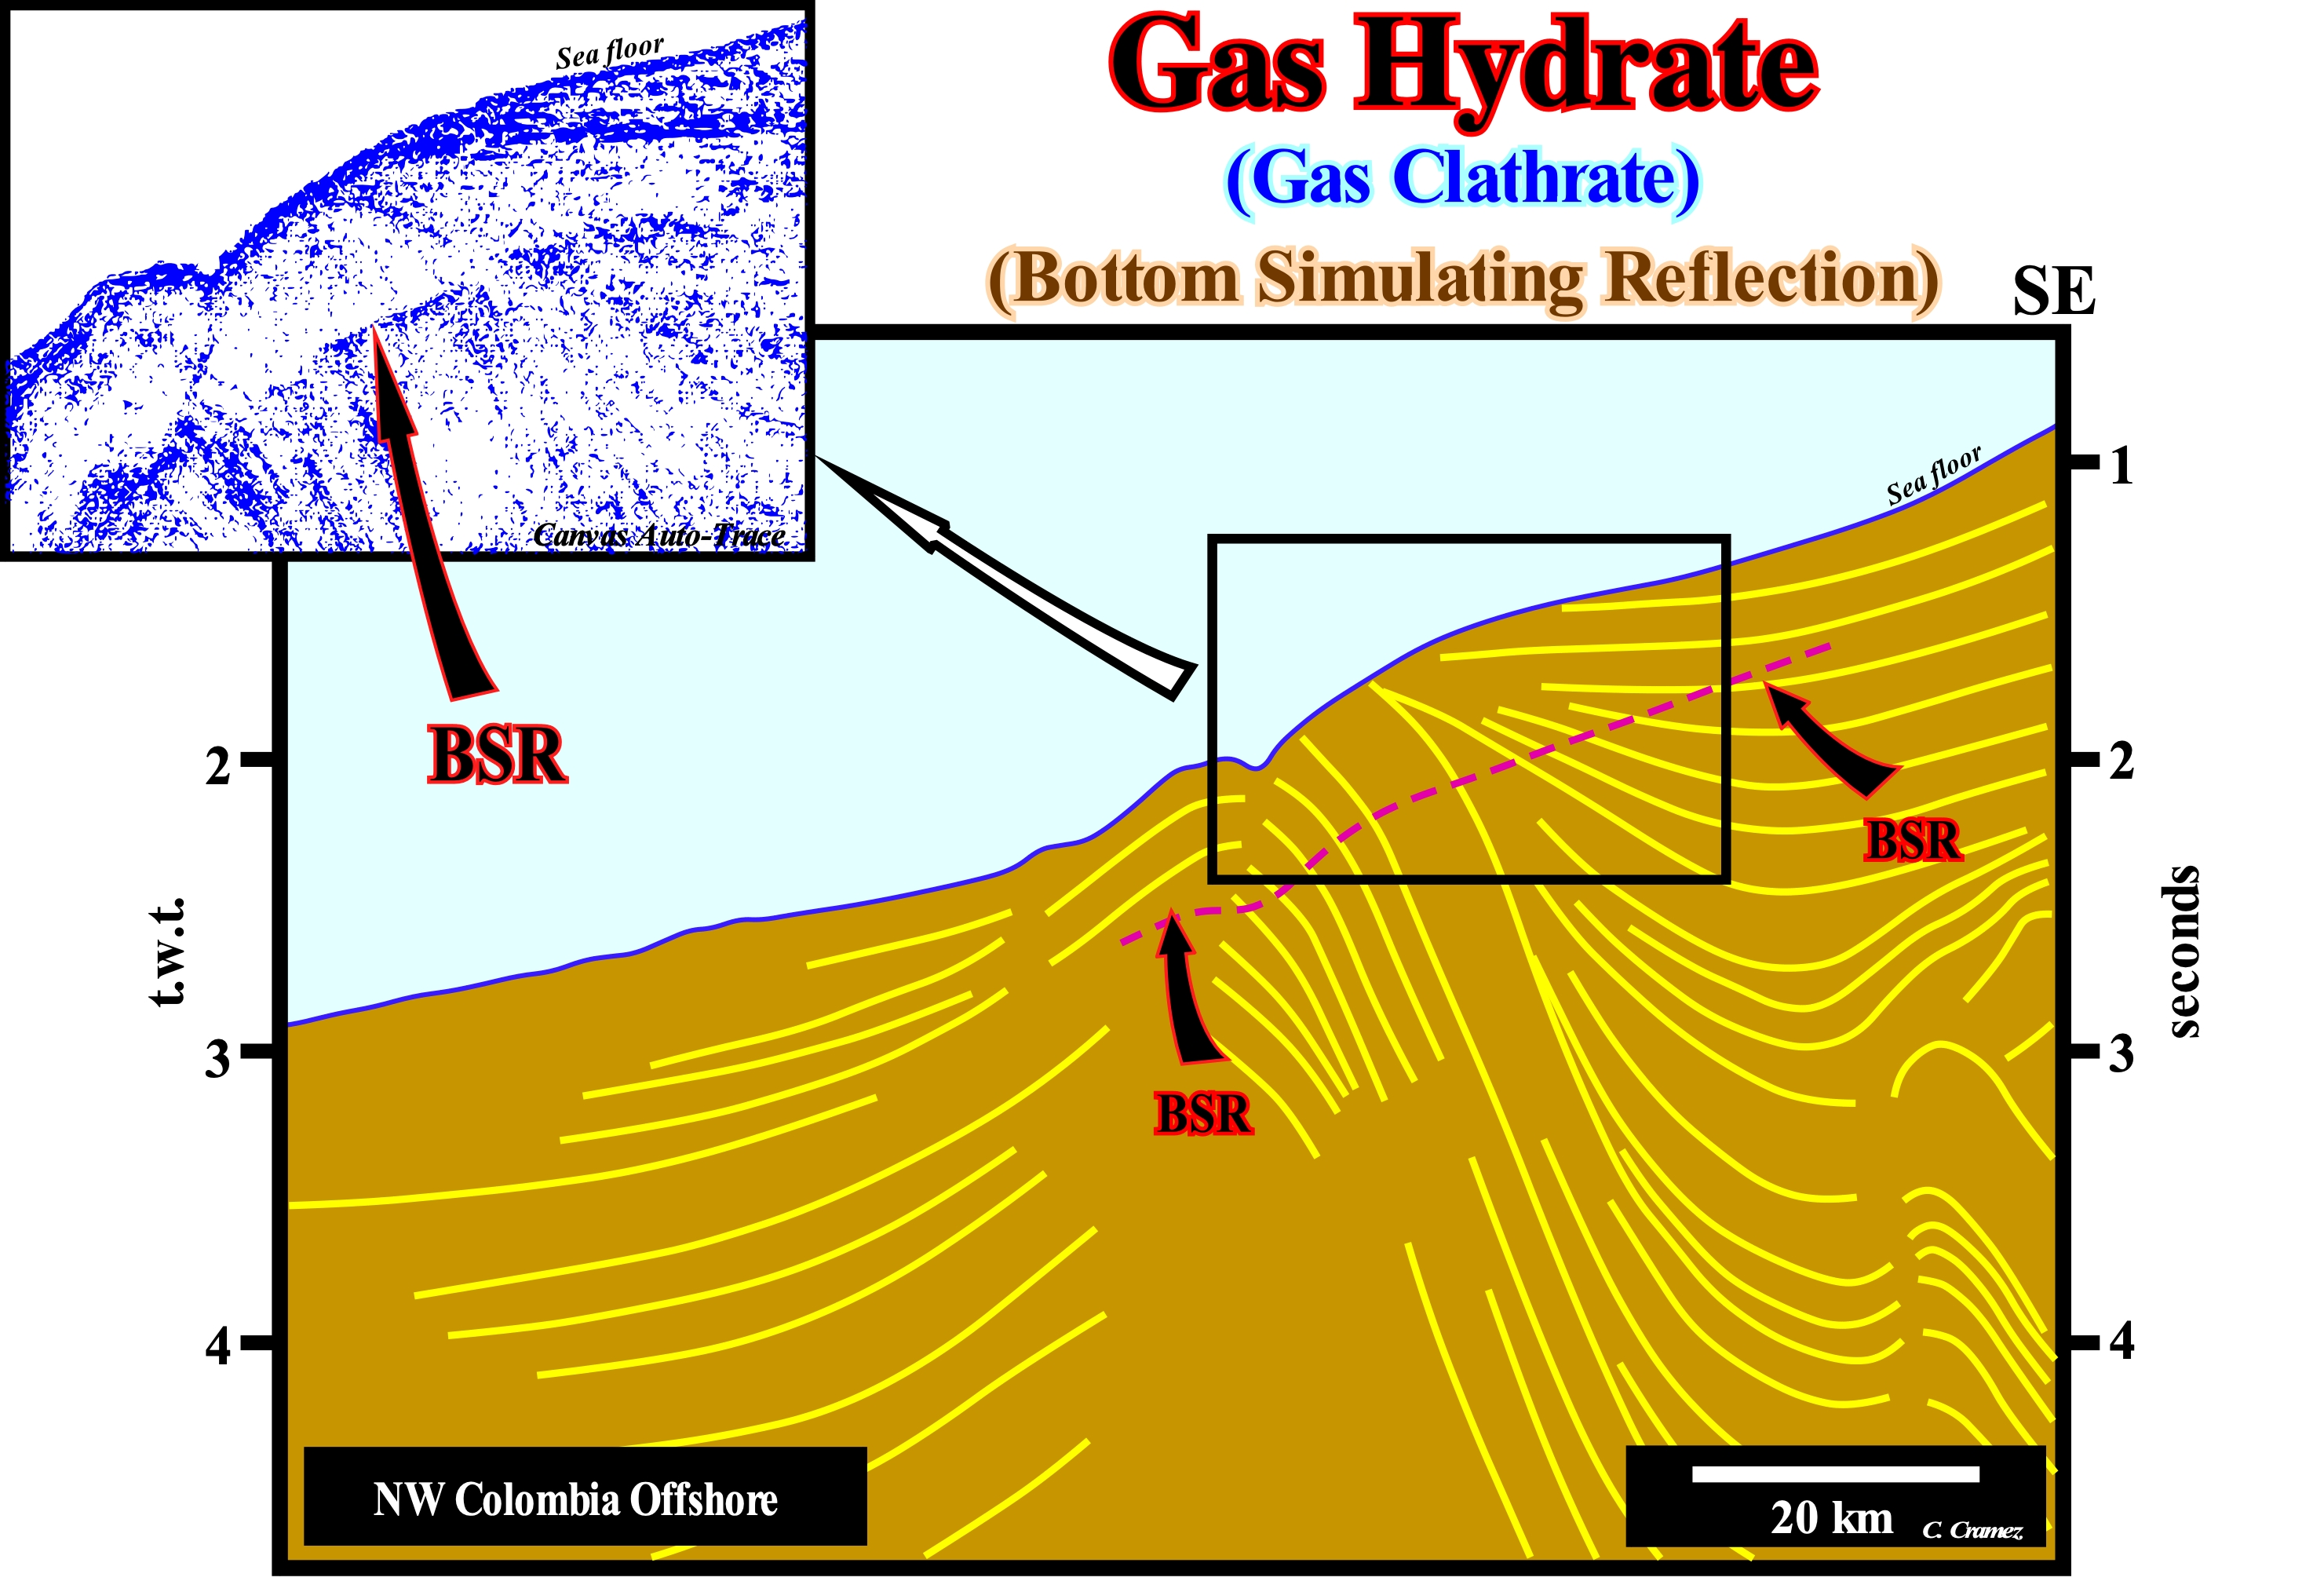
Gas clathrate is, basically, the natural gas stored in ice crystals, either in the permafrost area or on the ocean floor (burial less than 500 meters). On this tentative geological interpretation of a seismic line from the west of Colombia offshore, a diachronic reflector is, easily, visible around 0.5 seconds depth (t.w.t.). This reflector (BSR, i.e., Bottom Simulating Reflector of the sea floor) is caused by the gas bubbles at the base of the clathrate gas stability zone, which can not be considered as a sealing zone. Its porosity is filled for more than 95% by water. The Clathrate Gas Stability Zone (CGSZ) occurs in the first few hundred meters of sea floor sediments. In such a zone, all the methane produced by the decomposition of organic matter, including seepages coming underneath it, is converted into solid hydrates and stored, in situ. The origin of methane is poorly understood. Even its biogenic origin is put in doubt. At present-time, there is no gas production from clathrates. Although some geologists think in the Messoyakha field (northern central Siberia), where clathrates seem to serve as vertical cover for gas accumulation, a possible contribution to production is likely. Some geoscientists think, that in the future, clathrate gas can, partly, solve the energy problem. However the vast majority of the geoscientist do not believe in such a conjecture. Indeed, every time that a BSR is crossed by an exploration well the gas disappears.
Gas Window.............................................................................................................................................................Fenêtre de maturation à gaz
Janela do Gas / Ventana de gas / Gas-Fenster / 燃气窗口 / Главная зона газообразования / Finestra delle gas /
Zone where the gas is formed, generally, where the temperature varies between 110-120° and 200° C. When the temperature of the geological formations (and especially of the source-rock) is greater than 110°, which corresponds in average to 2% of VRP (vitrinite reflecting power), certain ruptures occur in the C-C bonds of the remaining kerogen and the hydrocarbons already formed. With the increase in temperature, hydrocarbons are increasingly lighter and represented, mainly, by gases and, finally, by methane.
See: « Source-Rock »
&
« Oil Window »
&
« Kerogen »
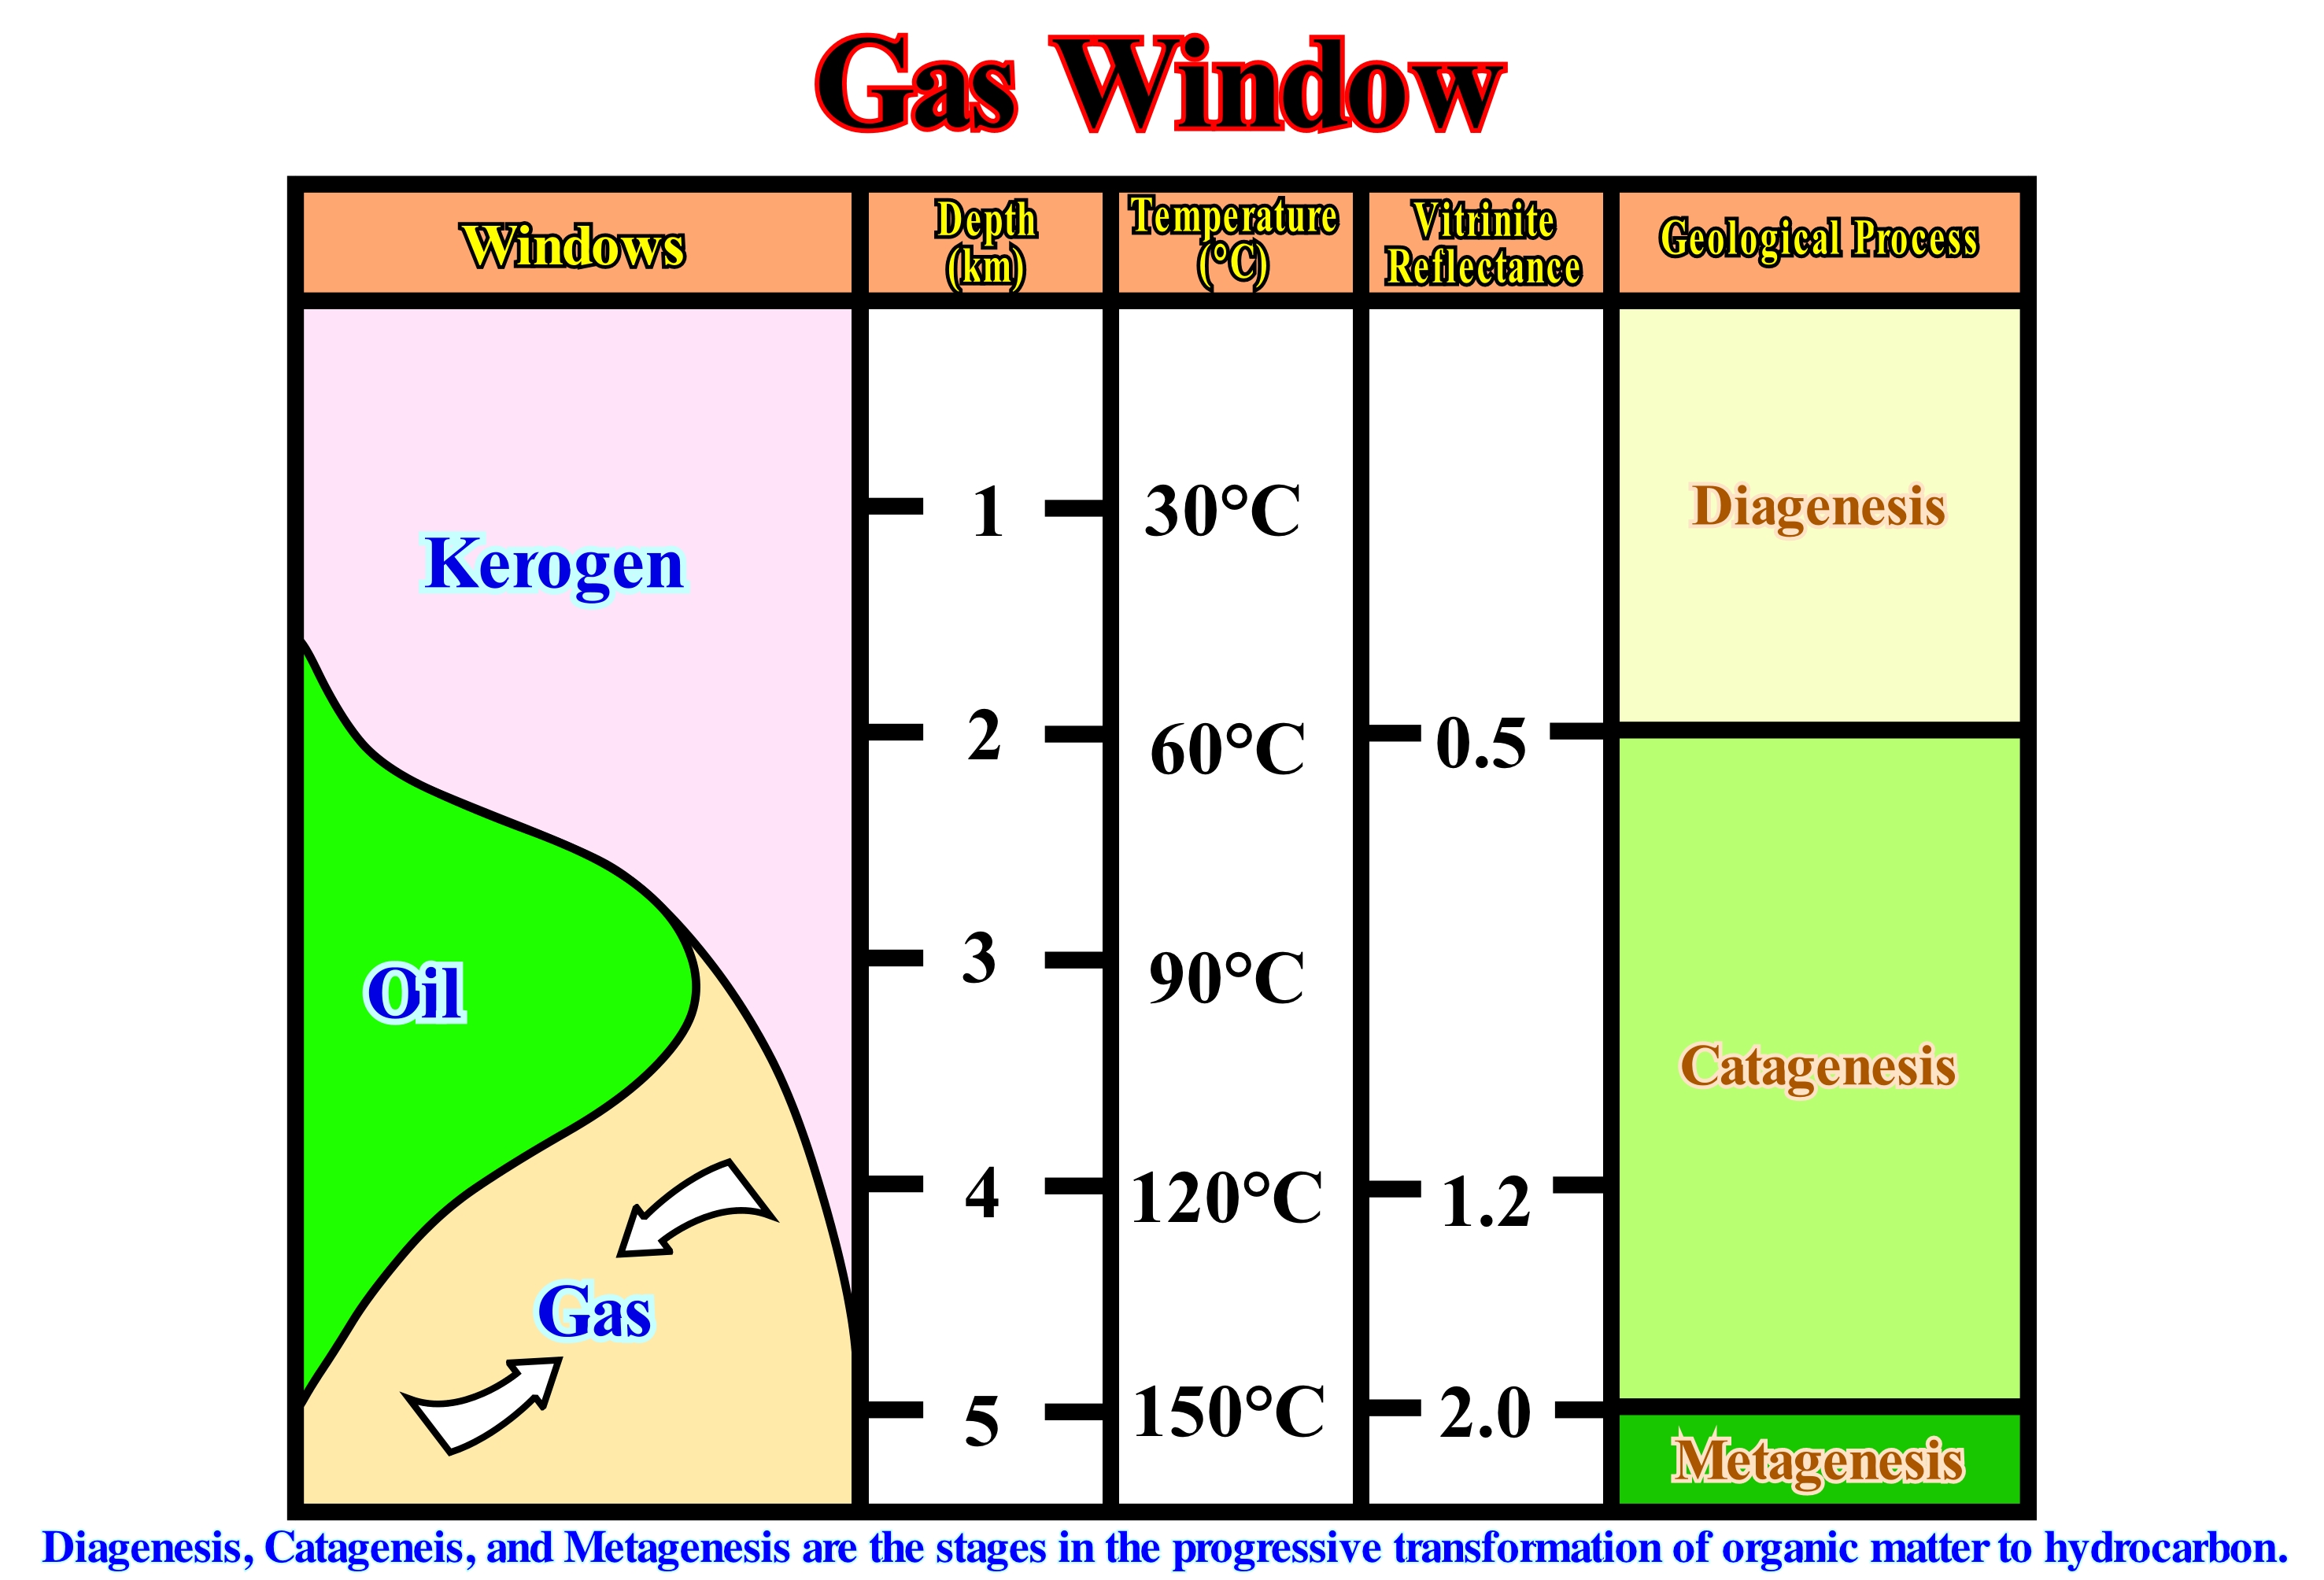
As shown on this diagram, there are three geological processes in the evolution of organic matter in depth: (i) Diagenesis ; (ii) Catagenesis and (iii) Metagenesis. Diagenesis, i.e., the chemical, physical and biological changes or transformations undergone by the sediments after their deposition, i.e., compaction, cementation, autigenesis, polymerization, adsorption, bacteriological action, etc. Catagenesis includes the processes by which organic kerogens are converted into hydrocarbons, first oil and then gas. Metagenesis, which encompasses the processes by which the H:C ratio decreases with methane formation until the carbon is in the form of graphite. For some geoscientists, in the metagenesis there is no more formation of hydrocarbons. All carbon (C) is present just as graphite. In combination with these processes three hydrocarbon window formation can be defined: (a) Kerogen window, which is located within the diagenesis zone, up to , more or less, 60° C of temperature and characterized a vitrinite reflectance index of about 0.5 ; (b) Oil window, which is located within the catagenesis zone characterized by a temperature ranging between 60° and 120° C and by a vitrinite reflectance index between 0.5 and 1.2 and (c) Gas window, which is located in the lower part of the catagenesis and upper part of the metagenesis zone. The gas window is characterized by a temperature higher than 120° C and a vitrinite reflectance index greater than 1.2. In the kerogen window, a biogenic gas zone (methane) can be considered. Under the action of anaerobic microbes, the organic matter can be decomposes into gas, usually methane.
Generating Petroleum Sub-system (Source-rock).....................................................................................Roche-mère
Subsistema petrolífero gerador / Roca madre / Quelle Rock, Muttergestein / 烃源岩 / Нефтематеринская порода / Roccia fonte /
Sedimentary rock, rich in organic matter, which has been buried sufficiently, so that organic matter can generate hydrocarbons in economical and profitable quantities.
See: « Sealing-Rock »
&
« Lacustrine Source-Rock »
&
« Reservoir-Rock »
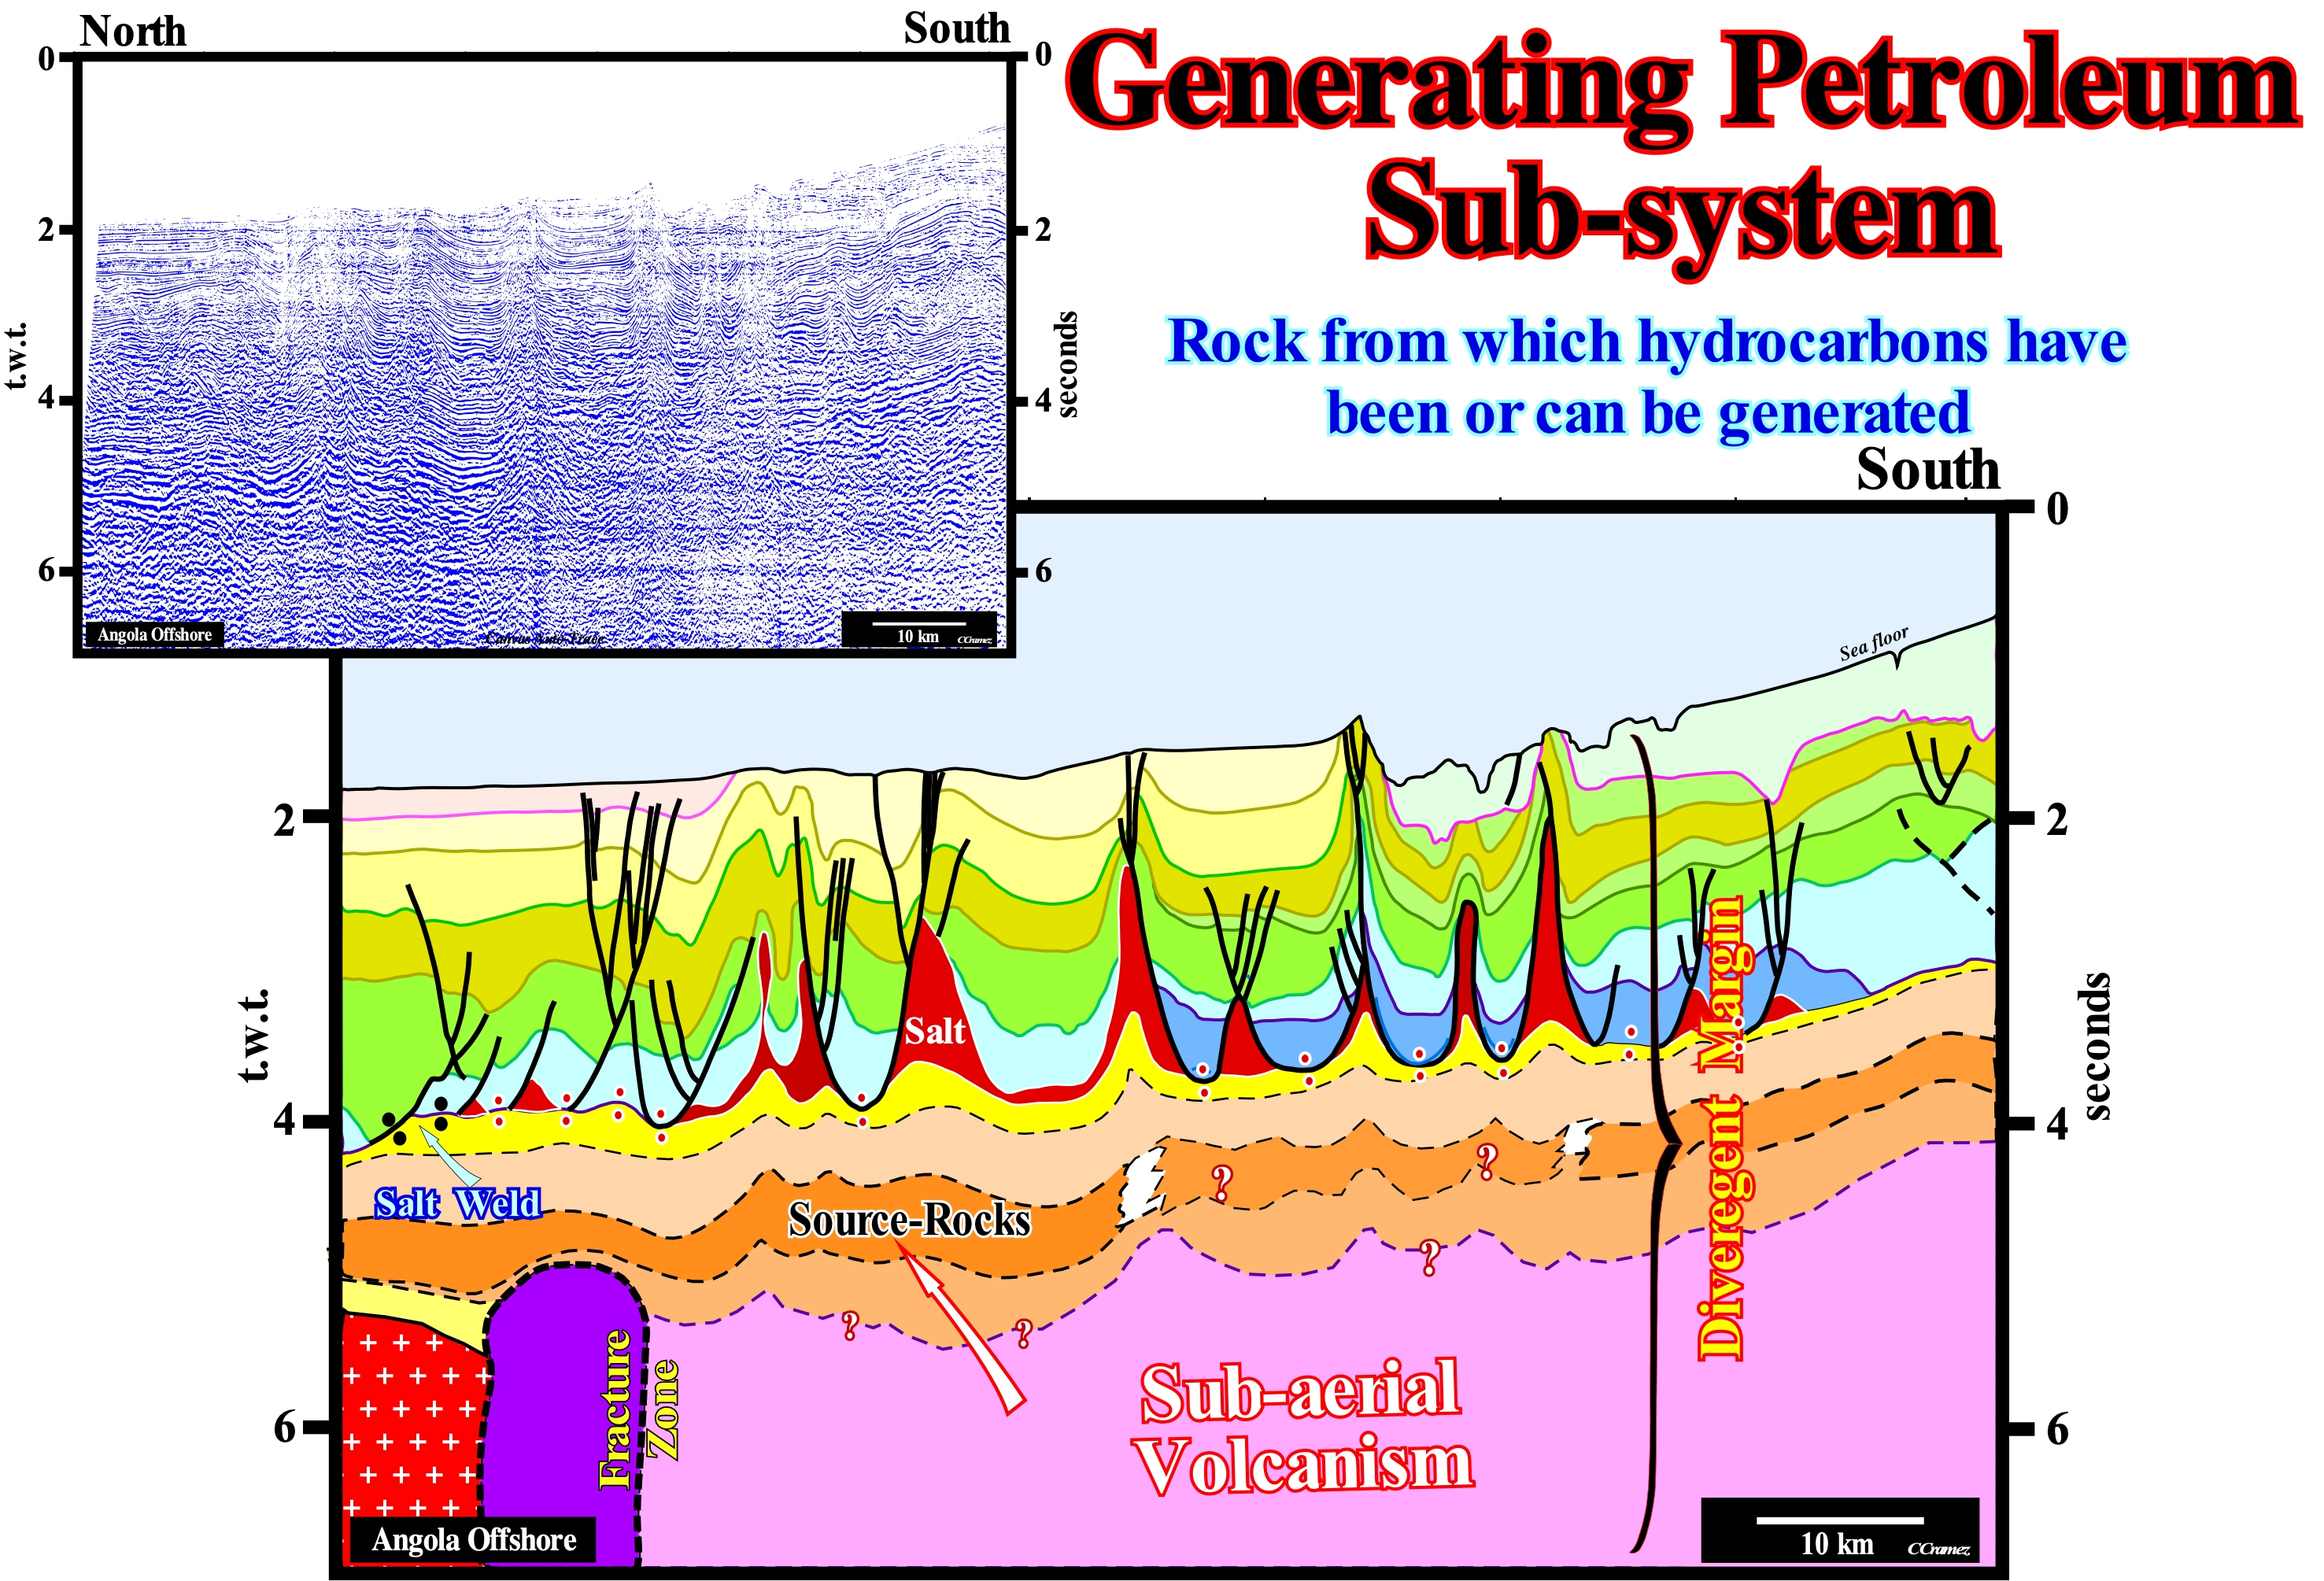
On this tentative geological interpretation of a Canvas auto-trace of an Angola offshore seismic line (Kwanza Basin) is illustrated a source-rock interval, identified by exploration wells, that are not too frequent in this offshore. Stratigraphically, this source-rock interval is underlying the evaporitic interval (Aptian) of the margin and overlying to the subaerial volcanism (SDR, i.e., Seward Dipping Reflectors) which was, also, corroborated by several exploration wells. The source-rock interval is part of the lower sector of the continental Atlantic-type divergent margin. It does not associated with any rift-type basin, as it is, often, the case in onshore and Cabinda offshore (north Congo geographic basin). The sub-aerial lava flows (there are no submarine volcanic flows, since the lava under water freeze, i.e., lithificated very quickly) began to flow, from the expansion centres continentward, after the break-up of the lithosphere,i.e., after the individualization of Africa and South America lithospheric plates. The source-rock interval, illustrated on this tentative interpretation, was deposited during the first stages of the divergent margin and not within a rift-type basin. The least falsifiable hypothesis (the one that best withstands the refutation tests) is that the sedimentary interval of the base of the margin, where the source-rock are located (between the sub-aerial lavas and the top of the salt interval (base of the carbonates) was deposited in a shallow epicontinental basin or even in a large lake bounded between the expansion centres (west) and the continent at east. It was, certainly, in such a sedimentary environment that organic rich clayey rocks that constitute the source-rock interval were deposited. Unfortunately, there is, practically, no evident traps in the infra-saliferous interval. All the "structures" visible on this tentative interpretation correspond, most likely, to seismic artefacts. The lateral velocity changes, induced by salt thickness variations, create these time artefacts. They do not exist in a depth converted seismic lines. The migration paths of hydrocarbons (note that the infra-saliferous sediments slope, continuously, to the north-west) and the presence of salt, do not favour accumulations in the supra-salt sediments.
Genetic Increment Strata................................................................................Incrémentation génétique (Des strates)
Incrementação genética (estratos) / Incremento genético (de los estratos) / Genetische Inkrement (Schichten) / 遗传增量(地层) / Генетические прирост (страты) / Incremento genetico (strati) /
Set of lithologies, genetically, associated within a sequence-cycle. It corresponds, more or less, to a simple sedimentary systems tract or to a subgroup of systems tract, such as the transgressive interval (IT) or the highstand prograding wedge (HPW), which form the highstand sysytems tract group (HST).
See: « Facies »
&
« Facies vs Environment »
&
« Stratigraphic Cycle »
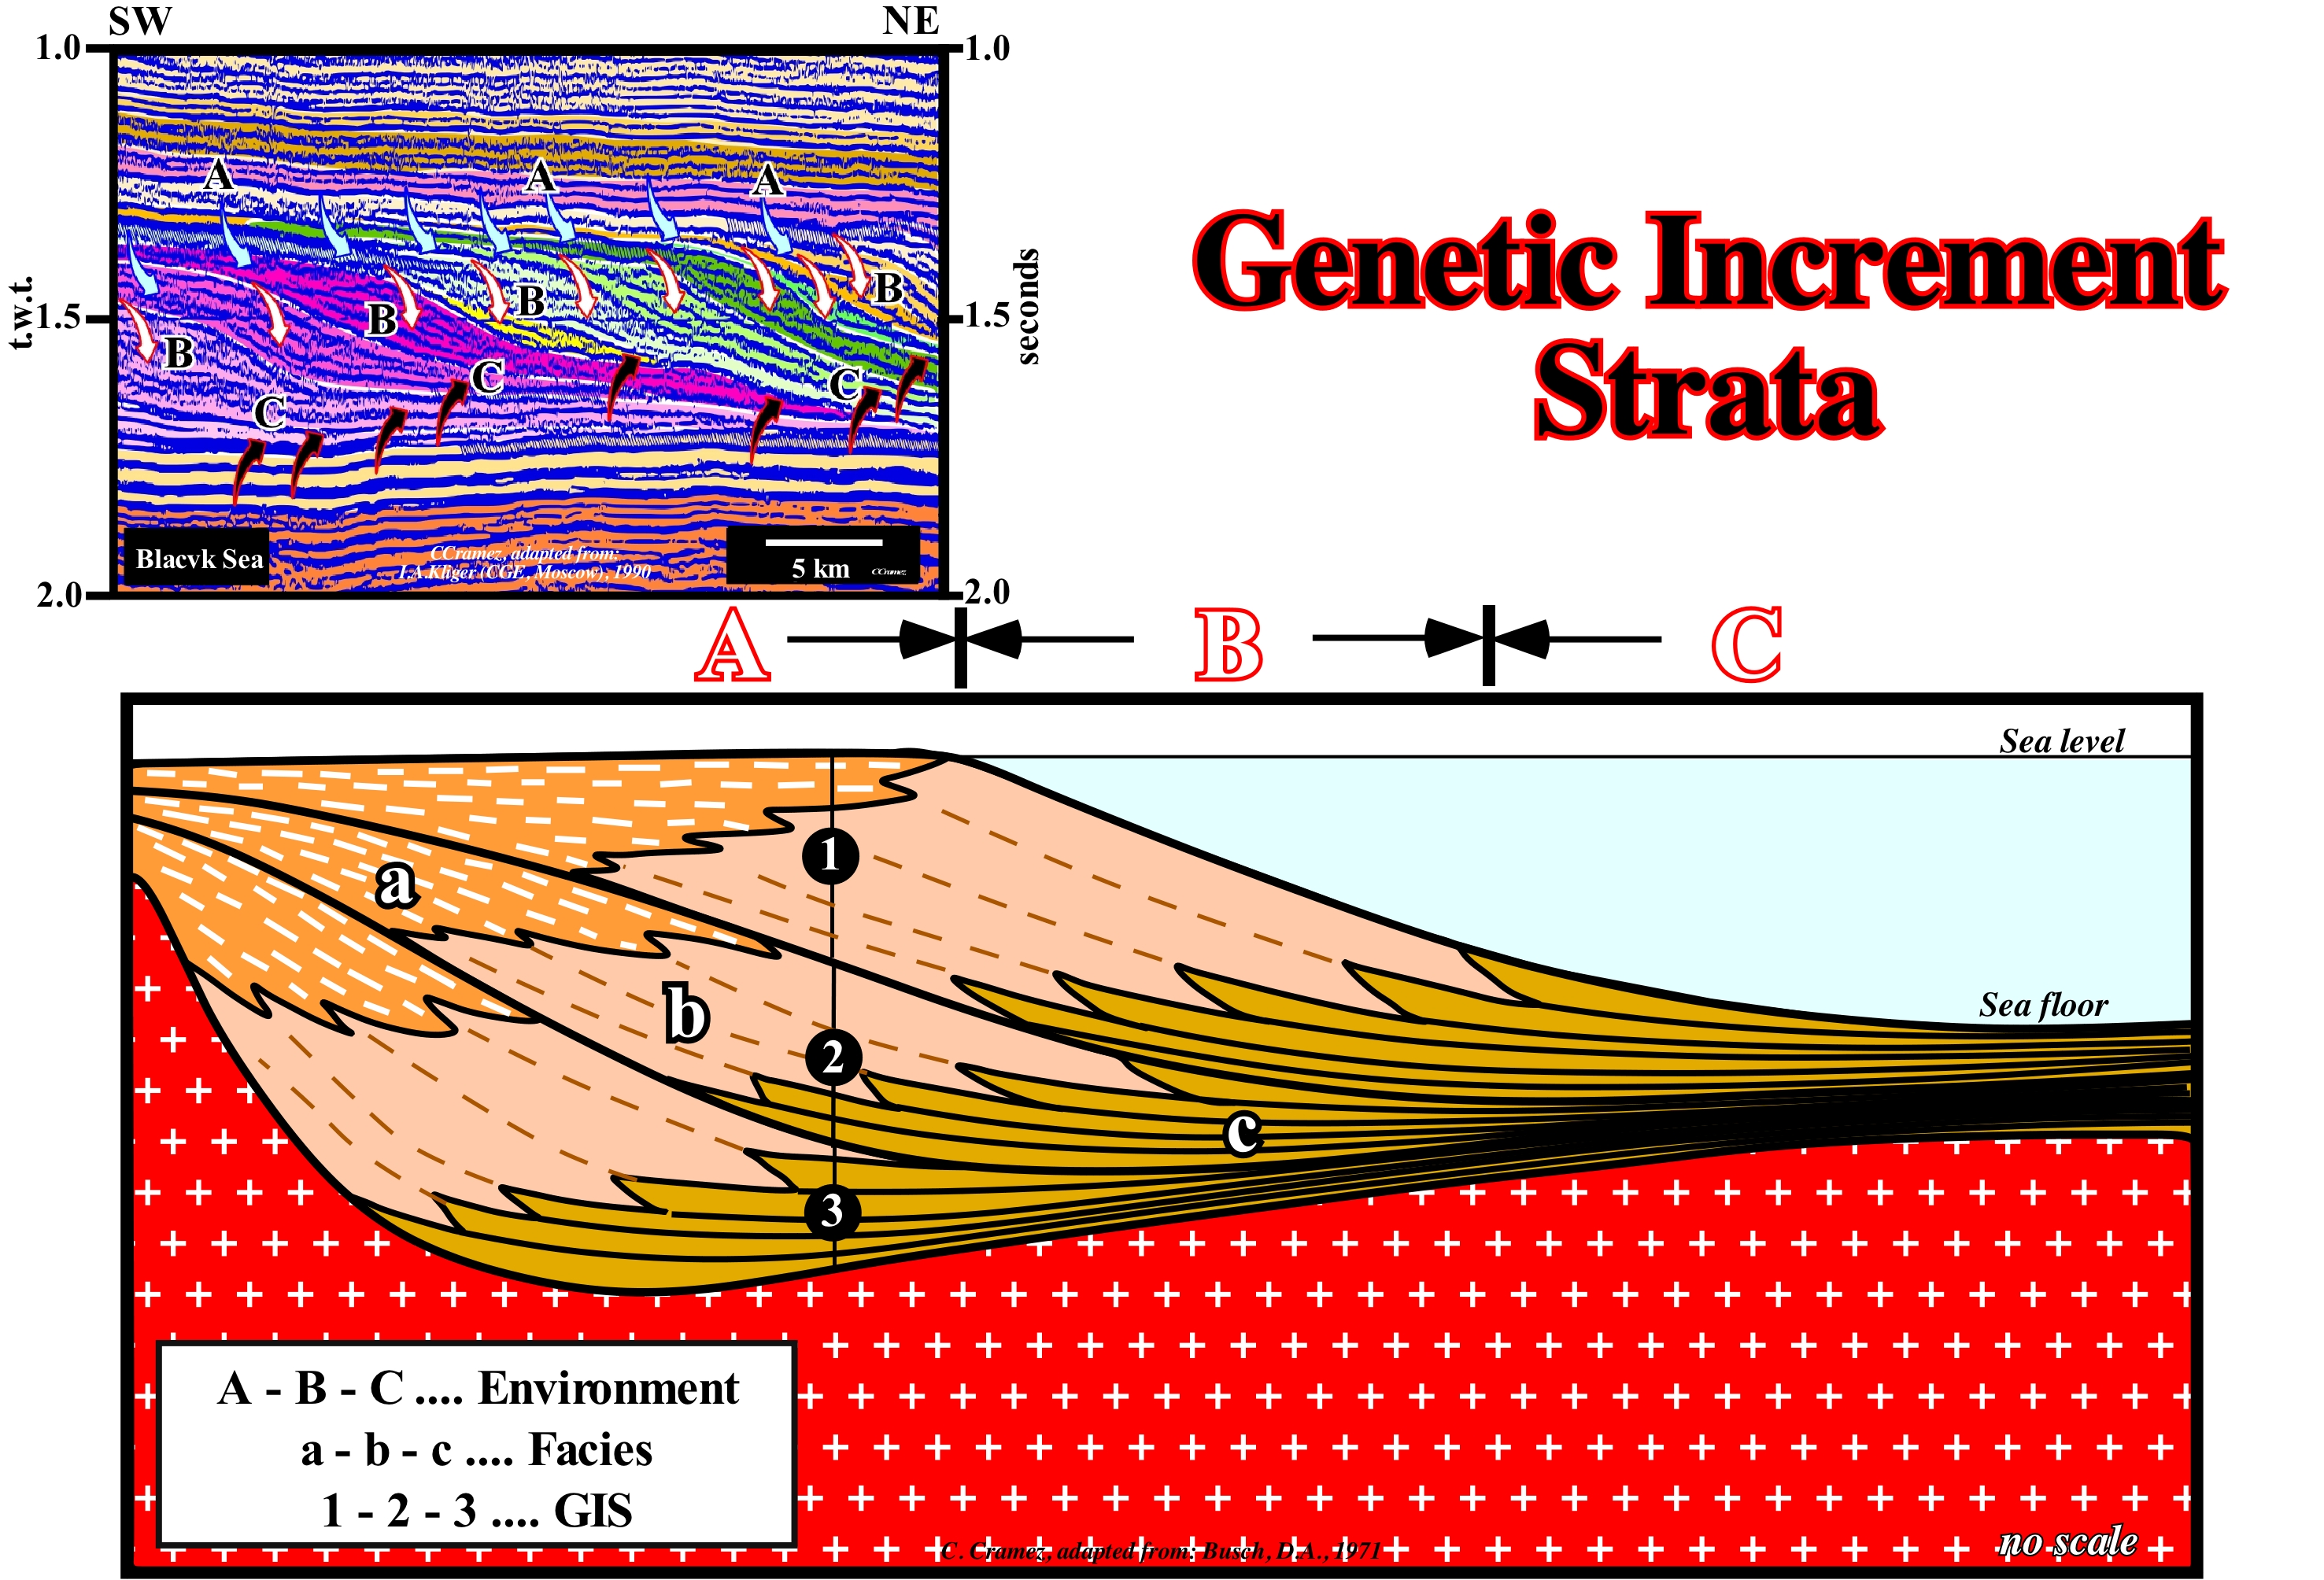
In 1838, the different lithologies with a typical fauna were called facies by Amanz Gressly: (i) The lithological aspect of the stratigraphic unit, which is linked to a paleontological group and (ii) The set of fossils that invariably excluded other facies. In 1898, J. Walther proposed the facies law saying: "The deposits of a region with the same facies, as well as, a set of rocks, of the same region, with different facies are formed, side by side, although in a cross-section they are seen on top of each other". In 1907, Haug standardized the meaning of facies as the sum of the lithological and paleontological characteristics of a given deposit, in a given place. In 1970, Selley emphasized that all proposed definitions of facies are merely descriptive. When American geoscientists consider that a vertical facies sequence (Walther's facies law) is the product of a series of depositional environments, laterally, adjacent to each other (there is no sedimentation interruption), they deviate too much from the original definition of Armanz Gressly and J. Walther. In 1971, Busch applied the concept of Walther's facies to a whole rocky body, not just to a vertical succession considering the "genetic increment of strata" (GIS) and the "genetic succession of strata" (GSS), i.e., a set of increments involving more than one increment of the same genetic type. A delta is a genetic increment of strata (GIS). On the contrary, a delta building is a genetic succession of strata (GSS). A genetic increment of strata (GIS) corresponds to a vertical succession of strata whose lateral lithological components (depositional systems or facies) are genetically related. That means that if a lithological component is not deposited the others, generally, also, do not deposit. In other words, the presence of one component implies, necessarily, the presence of others. In Sequential Stratigraphy, a genetic increment of strata corresponds, more or less, to a sedimentary systems tract, which is formed by one or more of the sequence-paracycle. Indeed, each sequence-paracycle is a lateral association of coeval depositional systems, genetically, related, and deposited after a relative sea level rise. Eustatic paracycles (relative sea level rise) create ravinment surfaces and the available space for sediments to deposit. As illustrated in this sketch, the typical example of a genetic increment strata (GIS), as well as of a sedimentary systems tract, is a delta and, in particular cases, a delta building. A delta corresponds to a sequence-paracycle induced by an eustatic paracycle (relative sea level rise* that, generally, precedes another relative sea level rise without any relative sea level fall between them). A delta building corresponds to a stack of deltas, that may or may not belong to the same sequence-cycle. A delta, generally, has a thickness lower than 100 meters. The thickness of a delta building can reach thousands of meters. The main depositional systems or facies of a delta are: (i) Silts of the delta plain ; (ii) Sand of the delta front ; (iii) Shales of the prodelta and, in some cases ; (iv) Turbidite sands and deep shales. All these facies are, genetically, related. Notwithstanding, some deltas do not have delta plain. A delta system corresponds to a genetic increment of strata (GIS). The schema illustrated in this figure corresponds to a delta building (succession of three GIS). In each GIS (1, 2 and 3), several deltas, characterized by a, b and c depositional systems, are distinguished and deposited in three different sedimentary environments A, B, C (delta plain and delta front, and prodelta). The three GIS are, in this particular case, separate by relative sea level falls which induced three erosional surfaces emphasizing three unconformities. The deltas forming the different delta buildings were deposited during the stability periods of relative sea level following each eustatic paracycle when the shoreline moves seaward. At the scale of the seismic lines, as illustrated on this tentative geological interpretation of a Canvas auto-trace of a Black Sea seismic line, it can be said a certain genetic increment of strata is recognized at sequence-cycle level, particularly in the progradational intervals.
(*) The relative sea level is the local sea level, referenced to the base of the sediments (top of the continental crust) or to the sea floor. It is the result of the combined action of the tectonics (subsidence or uplift of the sea floor) and the absolute (eustatic) sea level,that is global and referenced to the Earth's centre or to a satellite.
Genetic Stratigraphy.......................................................................................................................................Stratigraphie génétique
Estratigrafia genética / Estratigrafía genética / Genetische Stratigraphie / 遗传地层 / Генетическая стратиграфия / Stratigrafia genetica /
Stratigraphy based on the identification, over time, of: (i) Shifts of depositional coastal break (more or less the coastline) ; (ii) Position of the basin edge and (iii) Downlap Surfaces. In this type of stratigraphy, the boundaries between the different sedimentary packages are the dowmlap surfaces, which in sequential stratigraphy, within a sequence-cycle, separate the transgressive interval (TI) from the highstand prograding weddge (LPW). Genetic and sequential stratigraphy are complementary. Both are holistic and global. Complementarity is important, above all, in oil exploration, in which the predictions of potential source-rocks (genetic stratigraphy) and reservoir-rocks (sequential stratigraphy) are primordial.
See: « Stratigraphy »
&
« Sequential Stratigraphy »
&
« Unconformities (stratigraphic cycles) »
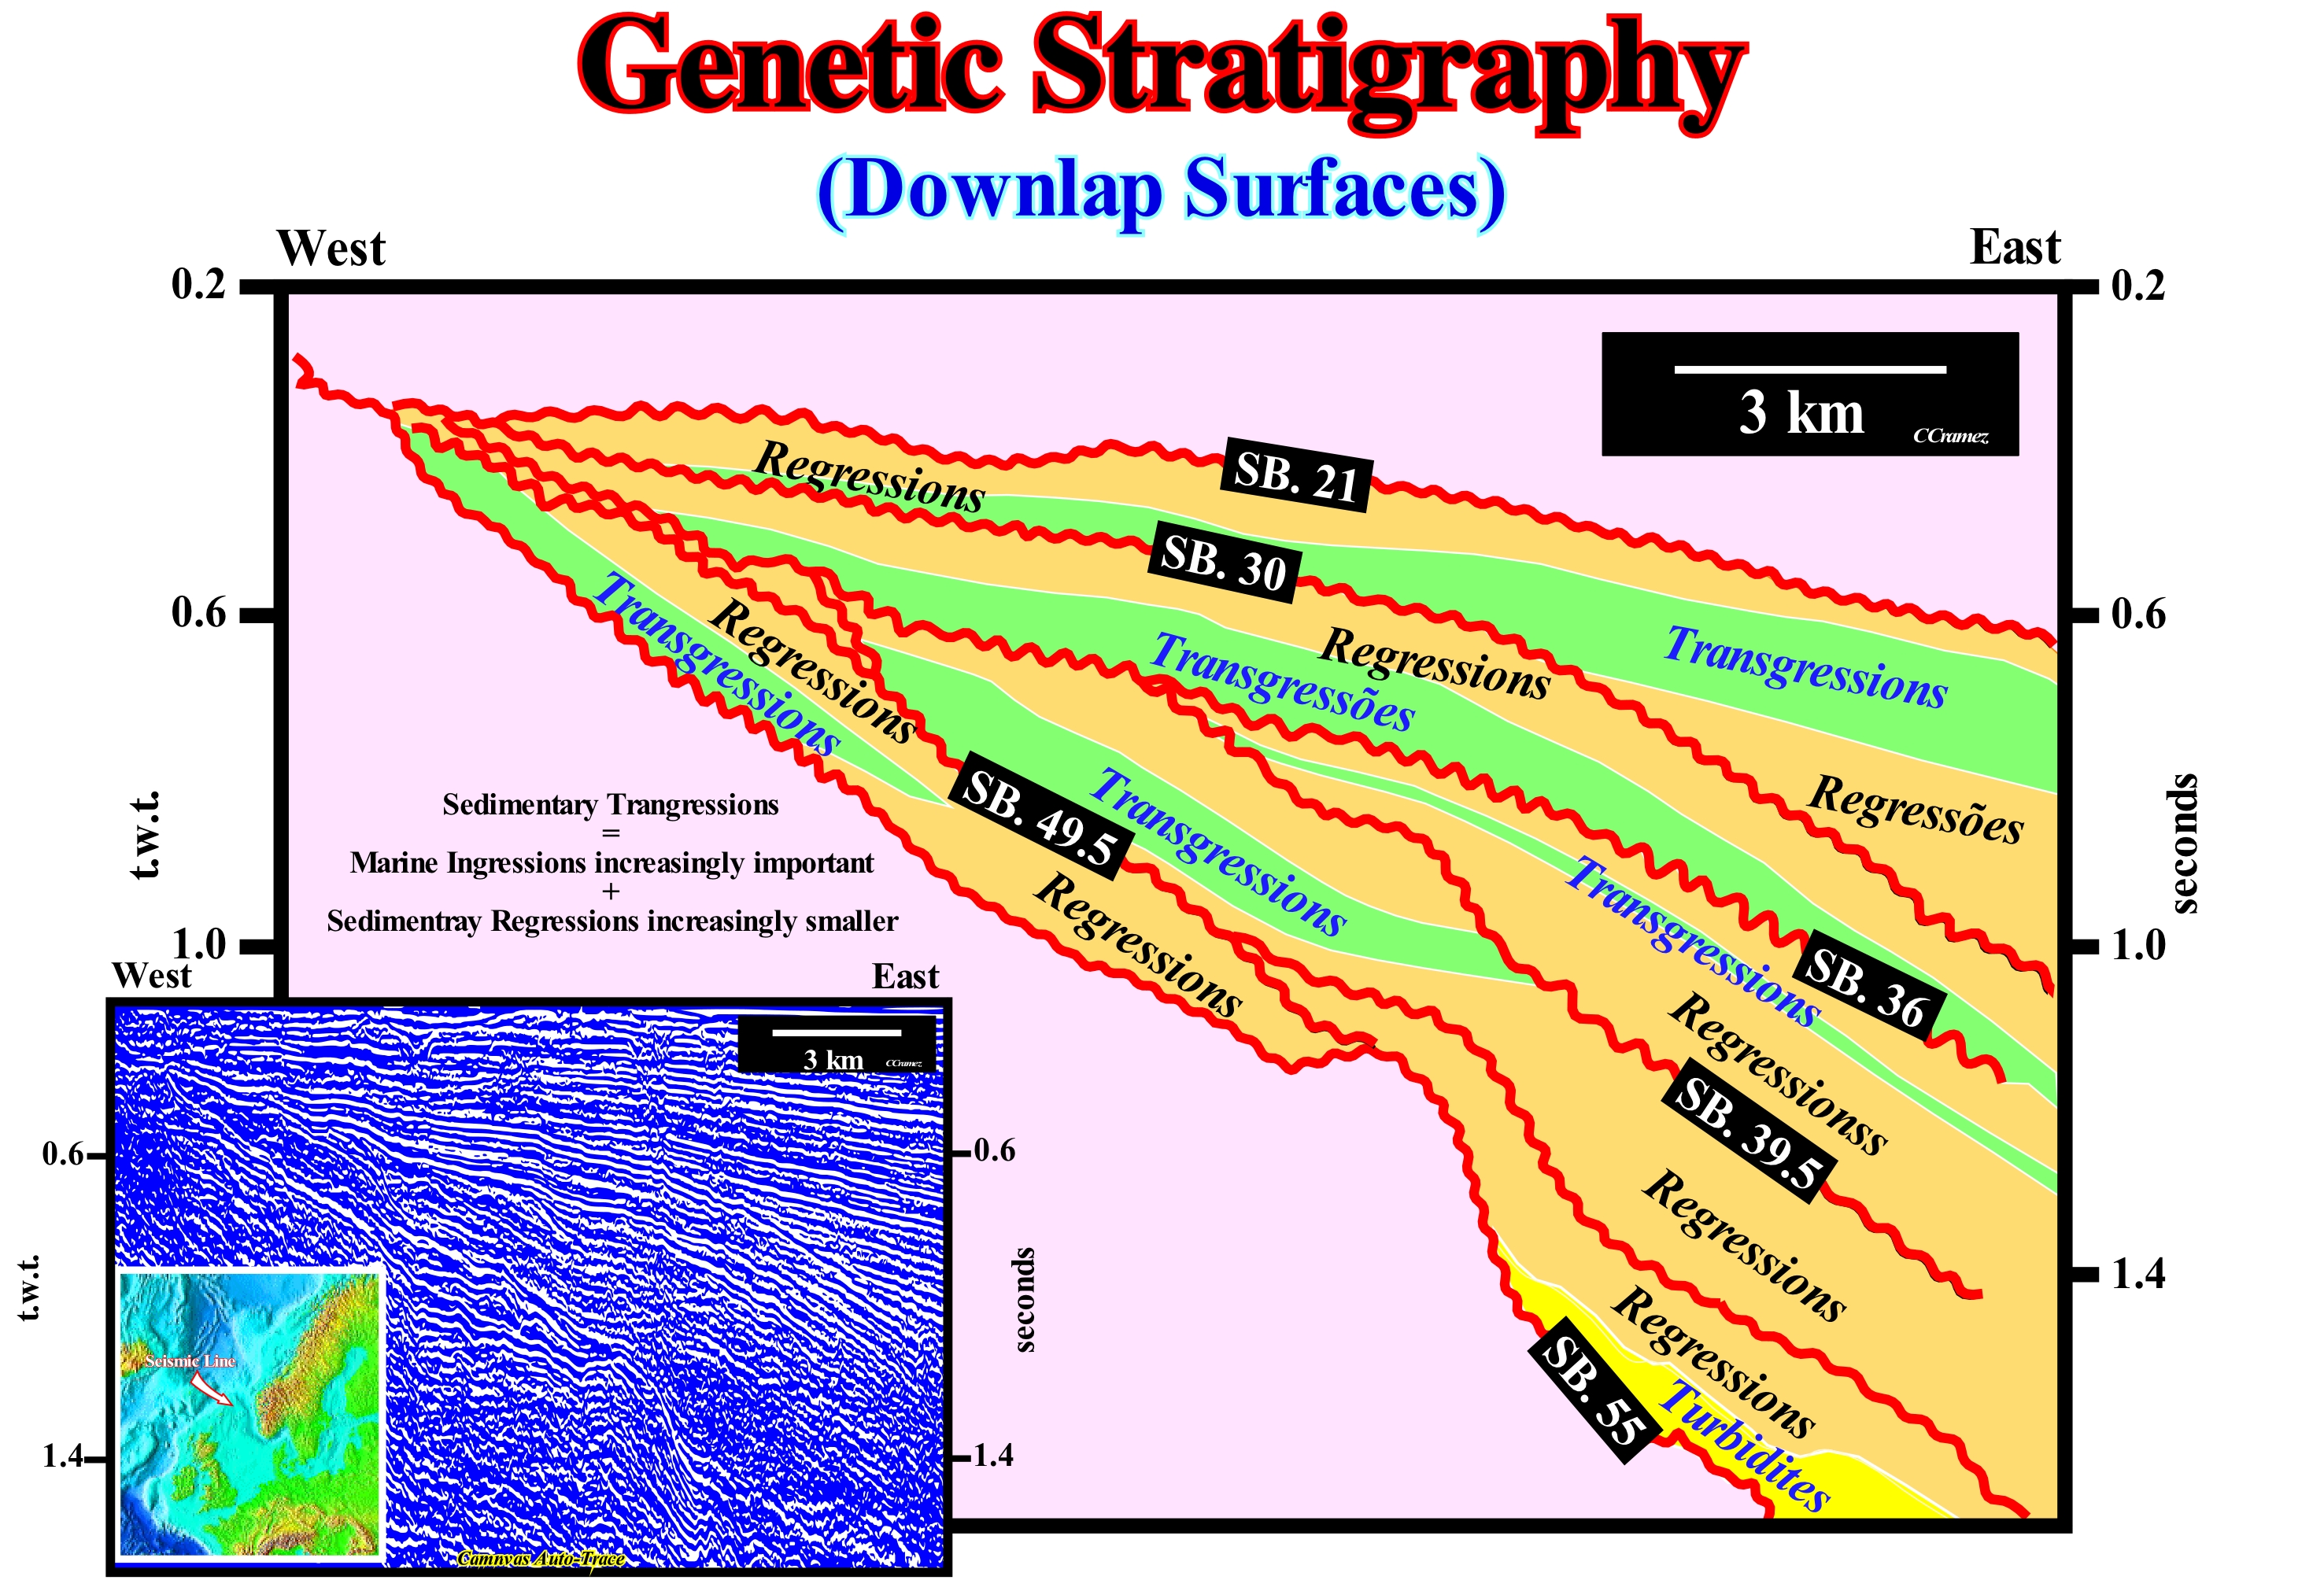
When the sedimentary column is divided into packages bounded by downlap surfaces, i.e. when the maximum flooding surfaces are taken as the boundaries between the sedimentary intervals, the stratigraphy is said to be genetic. This stratigraphy was proposed by W. Galloway (1989) for whom: (i) The margins of the sedimentary basins are characterized by repetitive episodes of progradation (displacement of the shoreline seaward), punctuated by periods of retrogradation (displacements of the shoreline continentward) ; (ii) The resulting stratigraphic units (sedimentary regressions and sedimentary transgressions) are, genetically, related and formed by depositional systems, non-depositional surfaces and thick intervals affected by gravity tectonics (turbidite deposits) ; (iii) These units are limited by hiatus surfaces which record the maximum marine flooding of the basin margins. In other words, in the genetic stratigraphy the maximum flooding surfaces (downlap surfaces) are used to subdivide the sedimentary column. Within a sequence-cycle of the sequential stratigraphy, the maximum flooding surface is located between the transgressive interval (TI) and the highstand prograding wedge (HPW). The importance of these surfaces (downlap surfaces) is, primarily, due to fact that they are easily recognized and mapped, particularly on seismic data. However, as emphasized by various geoscientists as opposed to unconformities, the downlap surfaces, which mark the maximum flooding surfaces, are diachronic. The intervals defined by the downlap surfaces can be cut by sub-aerial unconformities. In addition to the genetic and sequential stratigraphy, certain geoscientists use a stratigraphy in sedimentary transgressions and sedimentary regressions. Sedimentary transgressions correspond to a set of increasingly important marine ingressions and increasingly smaller sedimentary regressions. Sedimentary regressions correspond, in fact, to the set of marine ingressions increasingly smaller and sedimentary regressions increasingly larger. In this stratigraphy, the boundaries between the different sedimentary packages are complex surfaces that include unconformities and/or downlap surfaces and maximum flooding surfaces. It has even been suggested that stratigraphy in sedimentary transgressions/regressions is more useful than sequential or genetic stratigraphy. The correlative paraconformities in sequential stratigraphy (deep-water boundaries of sequence-cycles) are replaced by the marine parts of the surface of maximum regression, which have the advantage of being easily recognized in shallow marine environments. The problem with this stratigraphy is that the non-marine and marine portions of the boundaries of such sedimentary packets (unconformity and maximum regression surfaces respectively) are, potentially, diachronic and may also be mixed with ravinment surfaces. The tentative geological interpretation of a Canvas auto-trace of a southern Norway offshore seismic line illustrated in this figure was made with a sequential, genetic approach and in sedimentary transgressions/regressions cycles. The unconformities SB. 55 Ma, SB. 49.5 Ma, SB. 39.5 Ma, SB. 30 Ma and SB. 21 Ma that continental encroachment sub-cycles (induced by second-order eustatic cycles) were recognized. Within each of these sub-cycles, transgressive packages (colored in green) were identified. They are characterized by a geometry, globally, retrogradational. The regressive packages (in orange) have an internal progradational configuration. The transgressive packages* were deposited under highstand geological geological conditions. Contrariwise, the regressive packages considered, although correspond to progradational sedimentary wedges, they can be deposits in highstand or lowstand geological conditions. The boundaries between the transgressive and regressive packets correspond to downlap surfaces, whereas the boundaries between the regressive and the transgressive packets, in a continuous sedimentation, correspond, in general, to flooding surfaces.
(*) A transgressive package corresponds to a transgressive interval (IT) of a sequence-cycle. i.e., the lower sub-group of the highstand systems tracts group of a sequence-cycle.
Genetically Related (Depositional systems)........................................Génétiquement associé (Système de dépôt)
Geneticamente relacionado / Genéticamente relacionado (sistemas de depósito) / Genetisch verwandt / 与基因有关 / Генетически связанные / Geneticamente correlati /
When the presence of a depositional system (lithology and associated fauna in a given sedimentary environment) implies the presence of other depositional systems, which, by definition, are coeval (contemporaneous) of the former. The three depositional systems that form, generally, a delta (delta plain siltstones, delta front sands and prodeltat shales) are, genetically, related. The same happens with the depositional systems that form a reef complex (backreef, reef, forereef).
See: « Stratigraphic Cycle »
&
« Systems Tract »
&
« Facies »
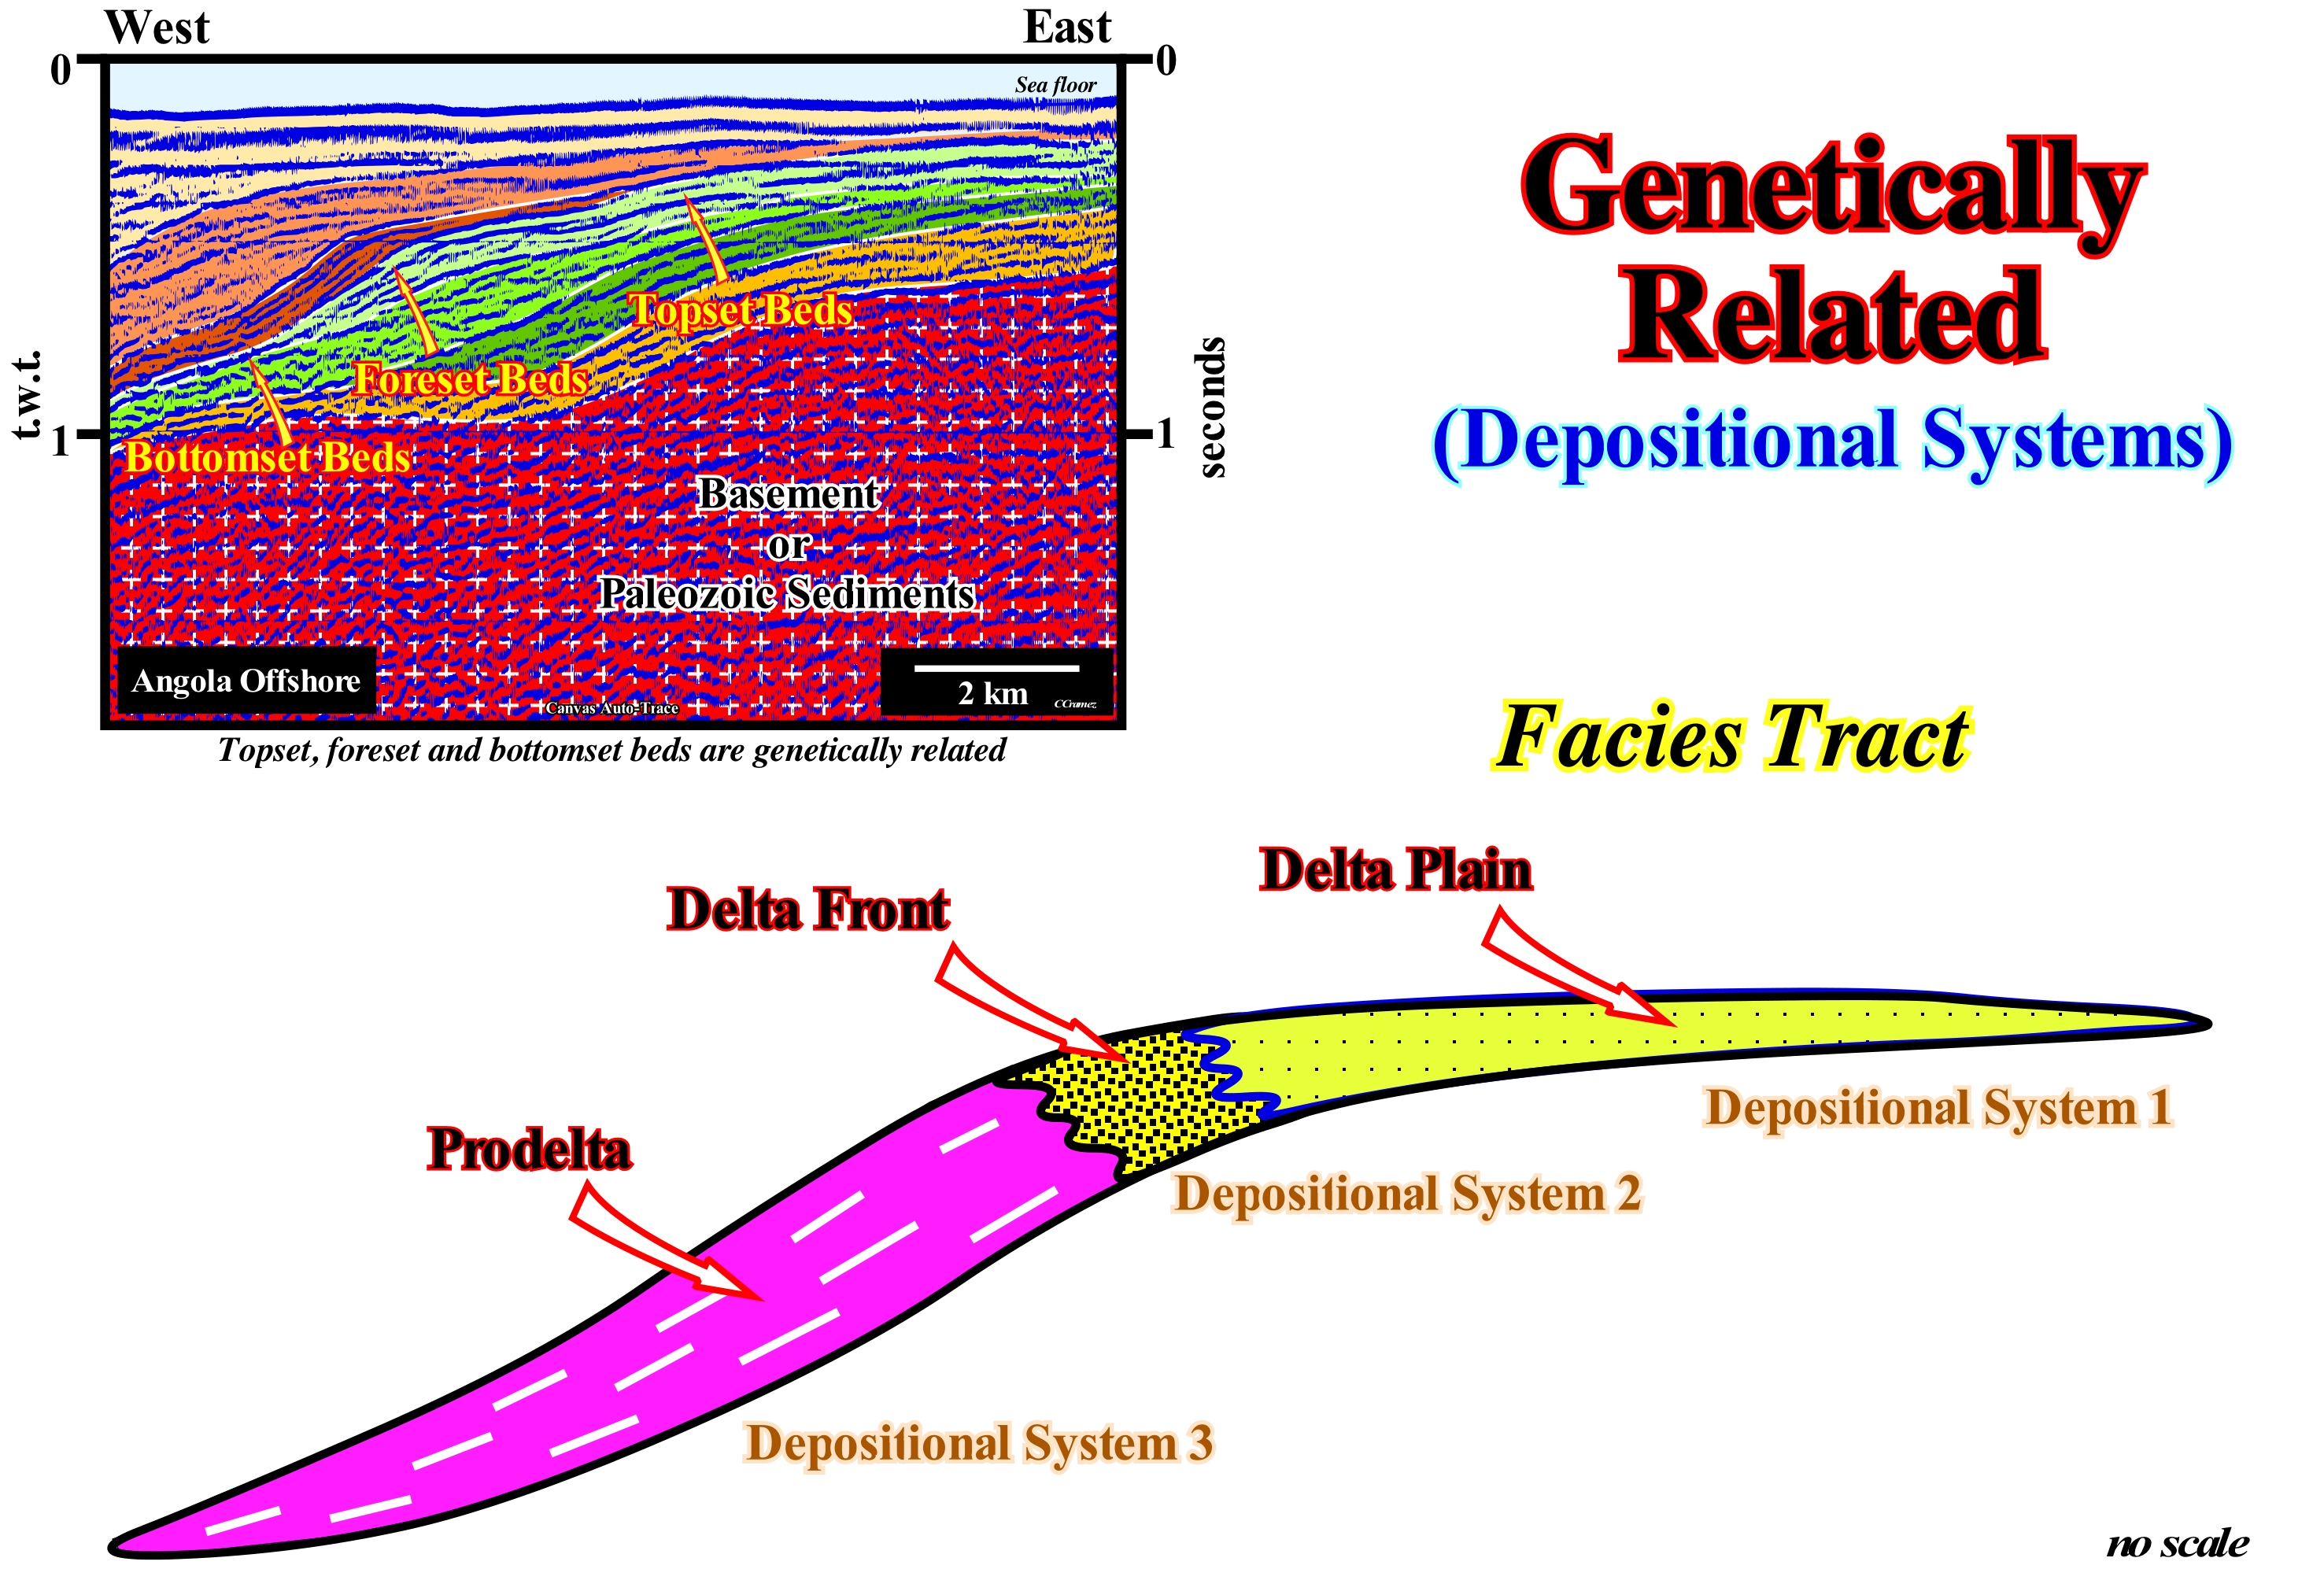
In 1838, different lithologies with a typical fauna were called facies (sedimentary) by Armanz Gressly: (i) The lithological aspect of the stratigraphic unit, which is linked to a paleontological group and (ii) The set of fossils that invariably excluded, other facies. In 1898, J. Walther proposed the correlation facies law by saying : "The deposits of a region with the same facies (" faciesbezirk "which in German literally means" facies of the region "), as well as a set of rocks of the same region with different facies are formed, side by side, although in a cross section are seen one on top of the other. In 1907, Haug standardized the meaning of facies as the sum of the lithological and paleontological characteristics of a given deposit in a given place. In 1970, Selley emphasized that all proposed facies definitions are, merely, descriptive and therefore expressions such as fluvial facies or turbiditic facies are not relevant. It is more correct to say: a sandy facies associated with a fluvial environment, than a sand of fluvial facies. When American geoscientists consider a vertical facies sequence (Walther's facies law) is the product of a series of depositional environments that are laterally adjacent to each other (there is no interruption of sedimentation), they deviate too much from the original definition of Armanz Gressly and J. Walther. In 1971, Busch applied facies tract concept the Walther"faciesbezirk" to a whole rocky body, not just a vertical succession considering the "genetic increment of strata" (GIS) and the "genetic sequence of strata" (GSS), i.e, a set of increments involves more than one increment of the same genetic type. A delta is a genetic increment of strata. A delta building is a genetic sequence of strata. In 1977, Brown and Fischer used the same concept ( Walther "faciesbezik") in facies analysis and renamed it as systems tract. As illustrated in this sketch a facies tract is a lateral association of genetically related depositional systems, i.e., they are coeval and if one systems is not deposited the others, in generally, are also not deposit. The typical example of a facies tract is a delta. Along the same chronostratigraphic line (depositional surface), in a delta, from upstream seaward, three mainly depositional systems* are recognized: (i) Shales and clayey sands of the deltaic plain ; (ii) Sands of the delta-front ; (iii) Shales of the prodelta. All these depositional systems are, genetically, related. If the prodelta shales are not deposited, it is evident that the other two systems are, also, not deposited, since they form a unit. In sequential stratigraphy, sequence-cycles are composed of stacking systems tracts (roughly facies tracts) as illustrated on the tentative interpretation of a Canvas auto-trace of an Angola offshore seismic line. Conventionally, in a complete sequence-cycle, from bottom to top, two systems tracts groups can be recognized: (i) Highstand systems tracts group, formed by two sub-groups: a) Highstand Prograding Wedge (HPW) and b) Transgressive Interval (TI) ; (ii) Lowstand systems tracts group, formed by three sub-groups: (c) Lowstand Prograding wedge (LPW) ; d) Submarine slope fans (SSF) and e) Submarine basin floor fans (SBFF). Each of these systems tracts sub-groups and, particularly, those deposited in association with relative sea level rises (all except the submarine fans) are formed by a stacking of sequence paracycles which correspond, more or less, to facies tracts. After each relative sea level rise, i.e., after each marine ingression (shoreline displaced seaward), during the stability period of relative sea level level, one or several progradation facies tracts are deposited, which displace the shoreline seaward. A facies tract (sequence-paracycle) consists of several depositional systems, each of which is characterized by a lithology and fauna emphasizing, almost always, a particular sedimentary environment. Submarine basin floor fans, for example, are characterized by deep fauna (in the pelagic layers) and a sandy lithology. Transgressive interval depositional systems are characterized by a shelf fauna and shallow water authigeneous minerals, such as glauconite and with condensed stratigraphic sections in the distal part of the continental platform (shelf).
(*) Sometimes, another depositional system at the base of the base prodelta shale is deposited, forming the so-called sub-horizontal bottom-set delta layers
Geochemical Fossil (Biomarker).......................................................................................................................Fossile géochimique
Fóssil geoquímico / Fósil geoquímico / Geochemische Fossilen / 地球化学化石 / Геохимическое ископаемое / Fossile geochimica /
Substance used as an indicator of a biological state. A geochemical fossil, also known as a biomarker, can be any type of molecule that indicates the current or past geological existence of living organisms. Geochemical fossils are widely used in understanding oil generation.
See : « Oxygen Isotopic Stratigraphy »
&
« Correlation »
&
« Fossil »
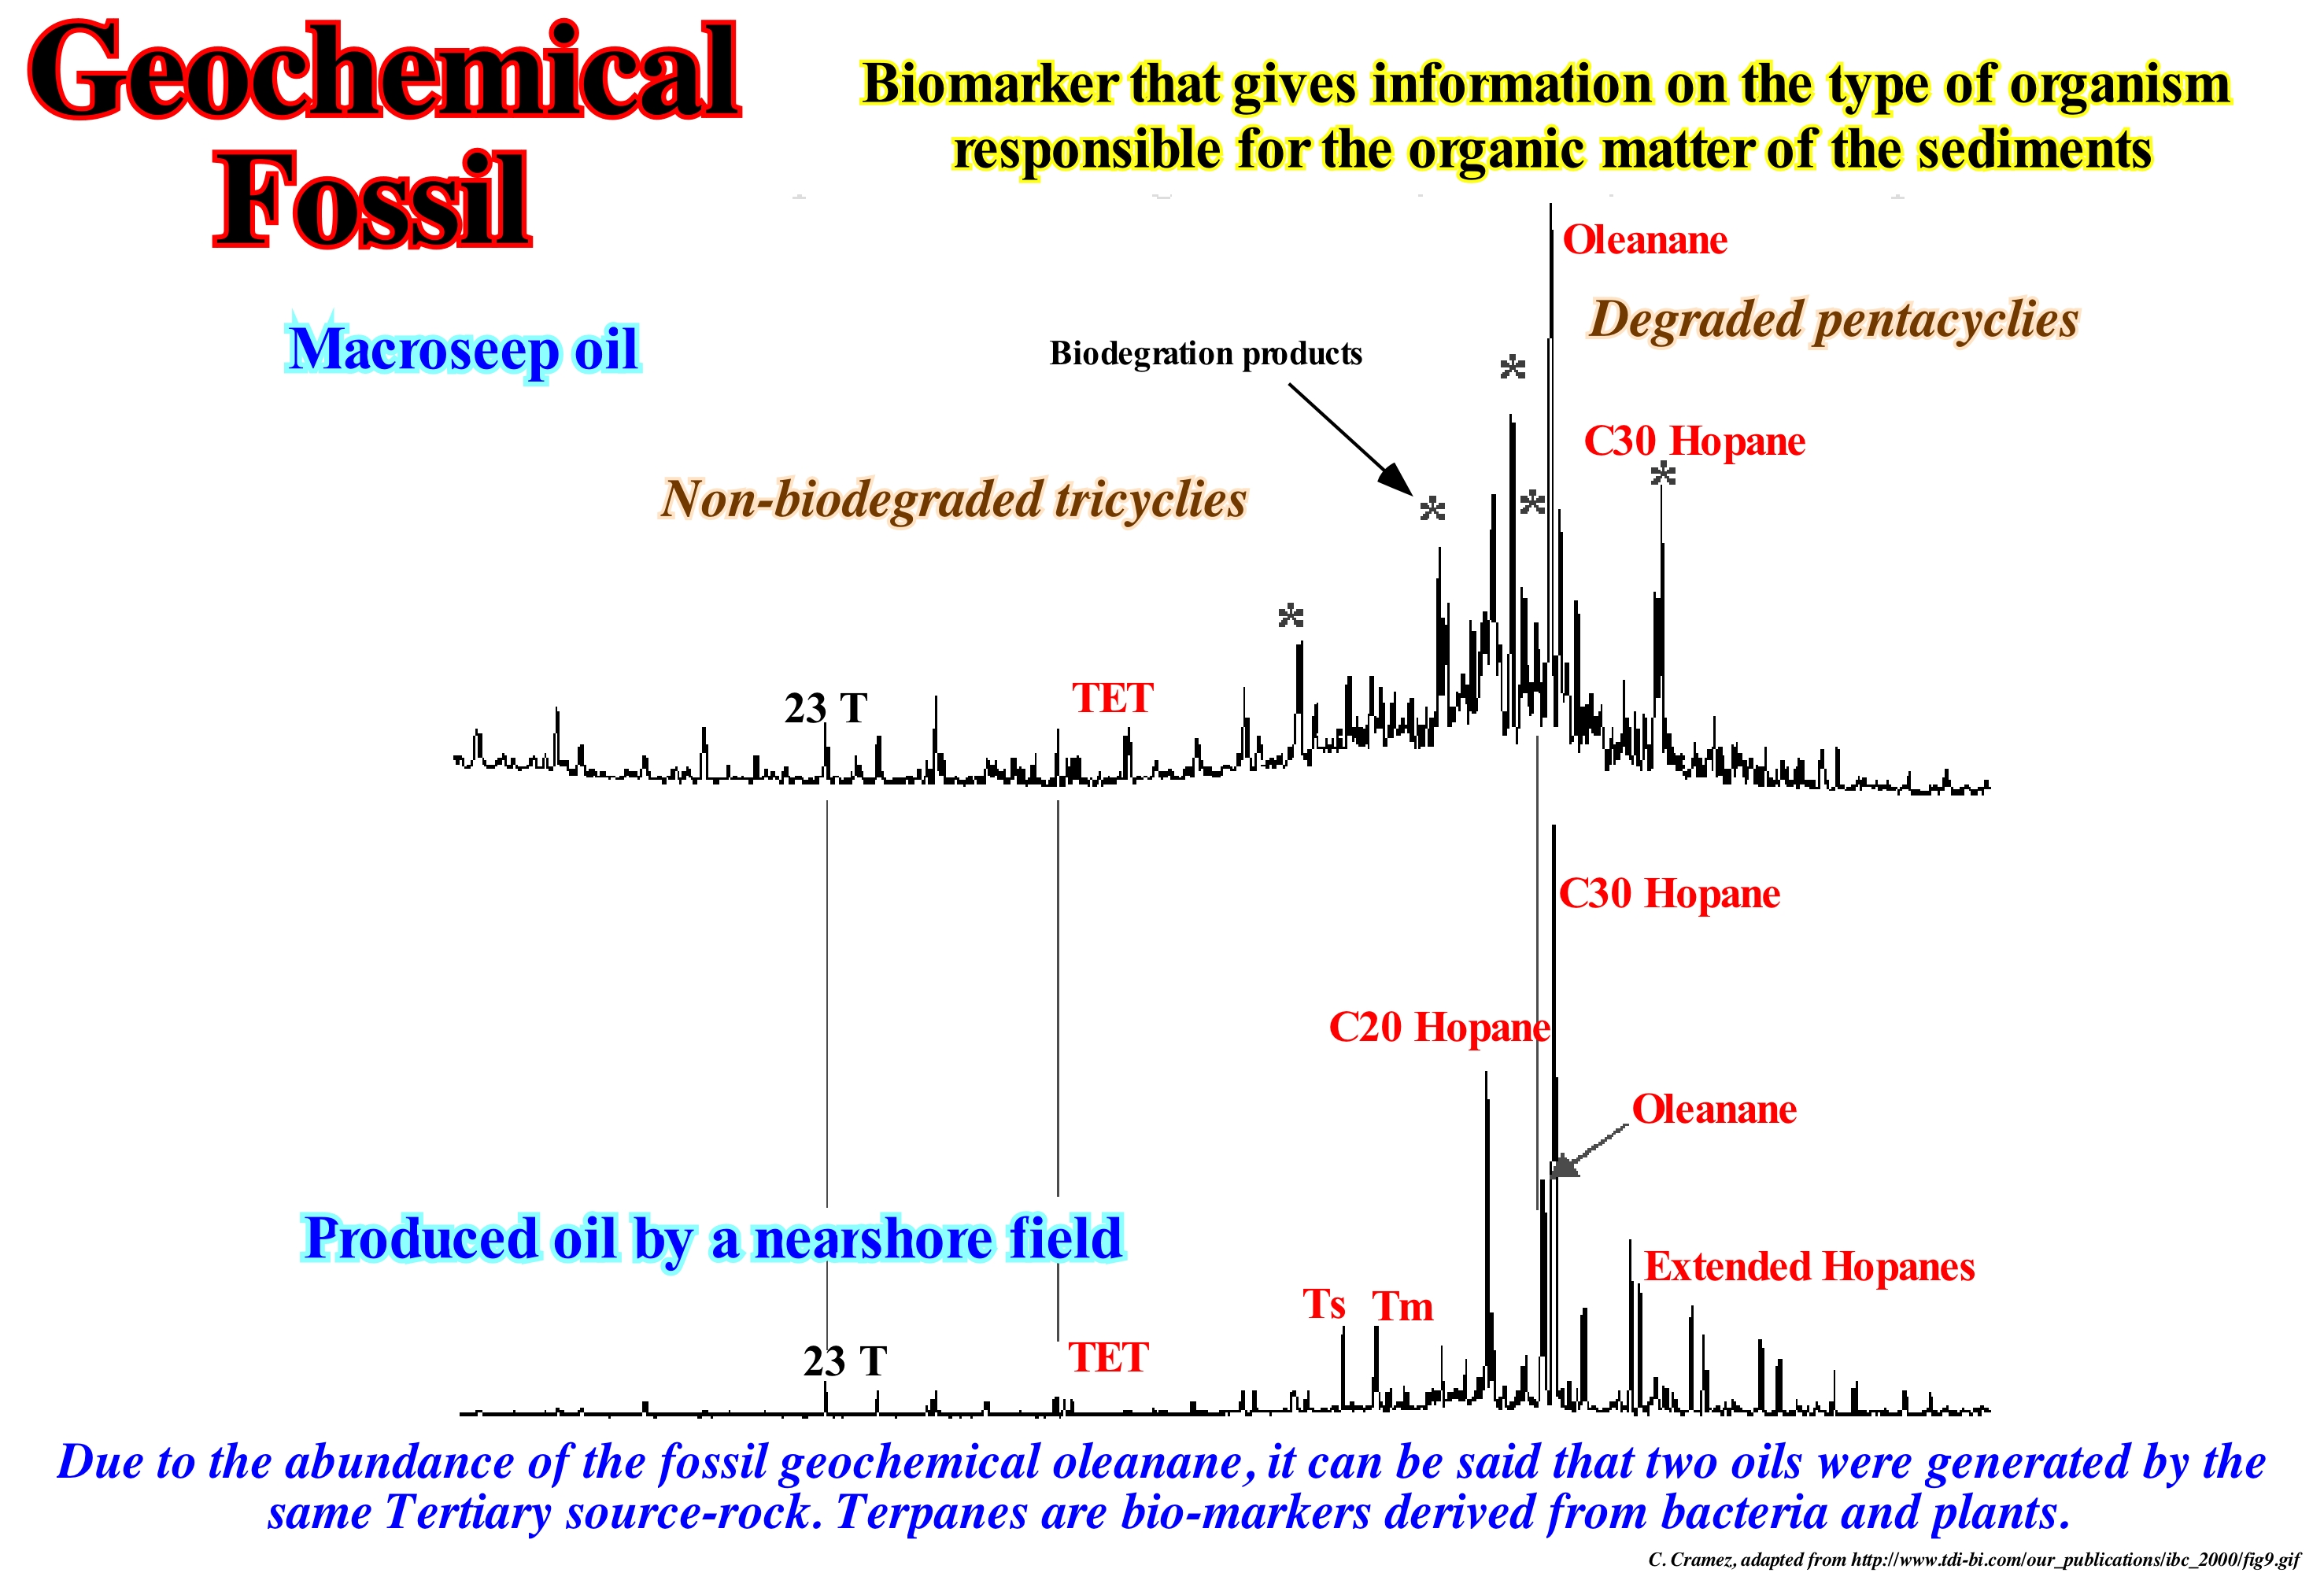
The term chemical fossil was first used by G. Eglinton (1976 - Chemical fossils: a combined organic geochemical and environmental approach, Pure Appl. Chem., 34: 611-631), to designate organic compounds that resist partial destruction of its original structures by biogeochemical processes. Due to the efficiency of re-mineralization of organic matter, few molecules retain their entire structure intact or even their original carbon skeleton. After the pioneering work of A.E. Treibs with the porphyrins (Treibs, AE, 1936 "Chlorophyll-und Hematology in Organischen Mineralstoffen", Angew Chem 49: 682-686, doi: 10.1002/ange.19360493803), identification of new markers was possible thanks to gas chromatography due to the separation of complex mixtures of organic compounds into natural matrices. Later, the coupling of gas chromatography and mass spectrometry facilitated the identification of numerous new molecular markers (https://static. danilorvieira.com/disciplinas /iof0254/aula7.ppt). Once the required conditions are reached, the oils are expelled from the generating rocks (source-rocks) and they move to the traps where they are going to be lodged. In their migration, during and after storage, the oils may undergo changes (secondary processes) that change their characteristics and affect their commercial quality. Biodegradation processes (process of decomposition of materials, mainly of organic origin, by the action of living beings) in subsurface, producing a strong degradation of the quality of the oils. Severe biodegradation also affects the main indicators of the origin and thermal evolution of petroleum, i.e., biomarkers (*). Biogenic hydrocarbons (natural hydrocarbons) have, predominantly, paraffins with an even number of carbon atoms in their skeleton. Petroleum hydrocarbons (anthropogenic origin),have an equitable distribution of even and odd carbon numbers of hydrocarbons. The study of non-biodegradable oils belonging to different oil fields of a given basin, with the aim of identifying: (i) The origin ; (ii) The thermal evolution and (iii) The correlations of the oils sampled, allowed to consider three families. Among these families, there is a family of petroleum originated from type II organic matter (organic matter deposited in an anoxic restricted marine environment with high salinity). This family encompasses most petroleum with low API values between 10 and 25° (hydrometric scale, measured in degrees, created by the American Petroleum Institute used to measure the relative density of oils and derivatives), as well as high sulphur content (between 1.68% and 7.44%). On the other hand, the ratio Pr/Ft (Pristane, C19H40/Phyran, C20H42) of less than 1,5 and a predominance of sterols (complex molecules from a polycyclic hydrocarbon) C27 on C28 and C29 suggest an organic matter of the algal type, deposited in a reducing environment. The carbon isotopic composition values of most oils are, generally, >-27%, presenting low content in tricyclic and diastereic terpanes, mean relative proportions of Hopanes at C29 (H29/H30, generally, between 0.5 and 1.0) and high proportions of C35 homopanes (H35/H34 in general between 0.9 and 1.4). The gamacerane index (ratio gamacerane/hopane C30), is almost always < 0.5, being considered median values, although they are the highest among the oils of this basin. Most of the oils in this family are in conditions of low thermal evolution. The Pristane/Phytanium (Pr/Ft) ratio is one of the most widely used geochemical parameters and has been used as an indicator of the deposition environment. Ten Haven et al., 1987 (Nature, 330, pp.641-643) noted that a high Pr/Ft (> 3.0) indicates a terrigeneous material under aerobic conditions (with oxygen) and a low Pr/0.8) indicates anoxic (without oxygen)/hypersaline environments or carbonated environments. Oil from the Ashrafi fields (Gulf of Suez, Egypt), for example, is characterized by Pr / Ft ratios of 0.16 and wax values of 0.68. The distribution of n-alkanes / isoprenoids and high Pr (Prision)/Ft (Phytanium) ratios suggest that the oils were derived from a parent rock with a significant terrestrial contribution deposited in aerobic paleoenvironment. Once the required conditions are reached, the oils are expelled from the generating rocks and move to the traps where they will be housed. In their migration, during and after storage, these oils can undergo changes (secondary processes) that change their characteristics and affect their commercial quality. In certain basins, there are severe biodegradation processes in subsurface, producing a strong degradation of the quality of the oils. Severe biodegradation affects, also, the main indicators of origin and thermal evolution of oils, i.e. biomarkers. The study of non-biodegradable oils belonging to different oil fields of a given basin to identify the origin, thermal evolution and correlations of the oils sampled allowed to consider three families, among which a family of oils originated from type organic matter II, deposited in an anoxic restricted marine environment of high salinity. This family encompasses most of the oils with low values of API density (between 10 and 25°), in addition to high sulphur contents, between 1.68 and 7.44%. In all oils, the Pr/Ft ratio is less than 1.5 and with predominance of C27sterols on C28 and C29. These results indicate the origin of organic matter of the algal type deposited in a reducing environment. The carbon isotopic composition values of most oils are generally> -27%, presenting low content in tricycle and disaster terranes, mean relative proportions of Ho-panes at C29 (H29/H30, generally, between 0.5 and 1.0) and high proportions of C35 homo-panes (H35/H34 in general between 0.9 and 1.4). The maceration index (ratio maceration / hopano C30), is almost always below 0.5, being considered median values, although they are the highest among the oils of this basin. Most of the oils in this family are in conditions of low thermal evolution.
(*) A biomarker can be any type of molecule indicating the existence, past or present, of living organisms. In geology and astrobiology, the biomarkers versus biomarkers relationships are known as assassinates. The term biomarker is also used to describe the biological involvement in oil generation.
Geodesic Sea Level (Ocean geoid)........................................................................................Niveau de la mer géodésique
Nível do mar geodésico / Nivel del mar geodésico / Meeresspiegel Nullpunkt / 大地测量海平面 / Геодезический уровень моря / Livello del mare datum /
Sea level of the geoid. Synonym with Oceanic Geoid.
See: « Relative Sea Level Change »
&
« Eustasy »
&
« Geoidal-Eustasy »
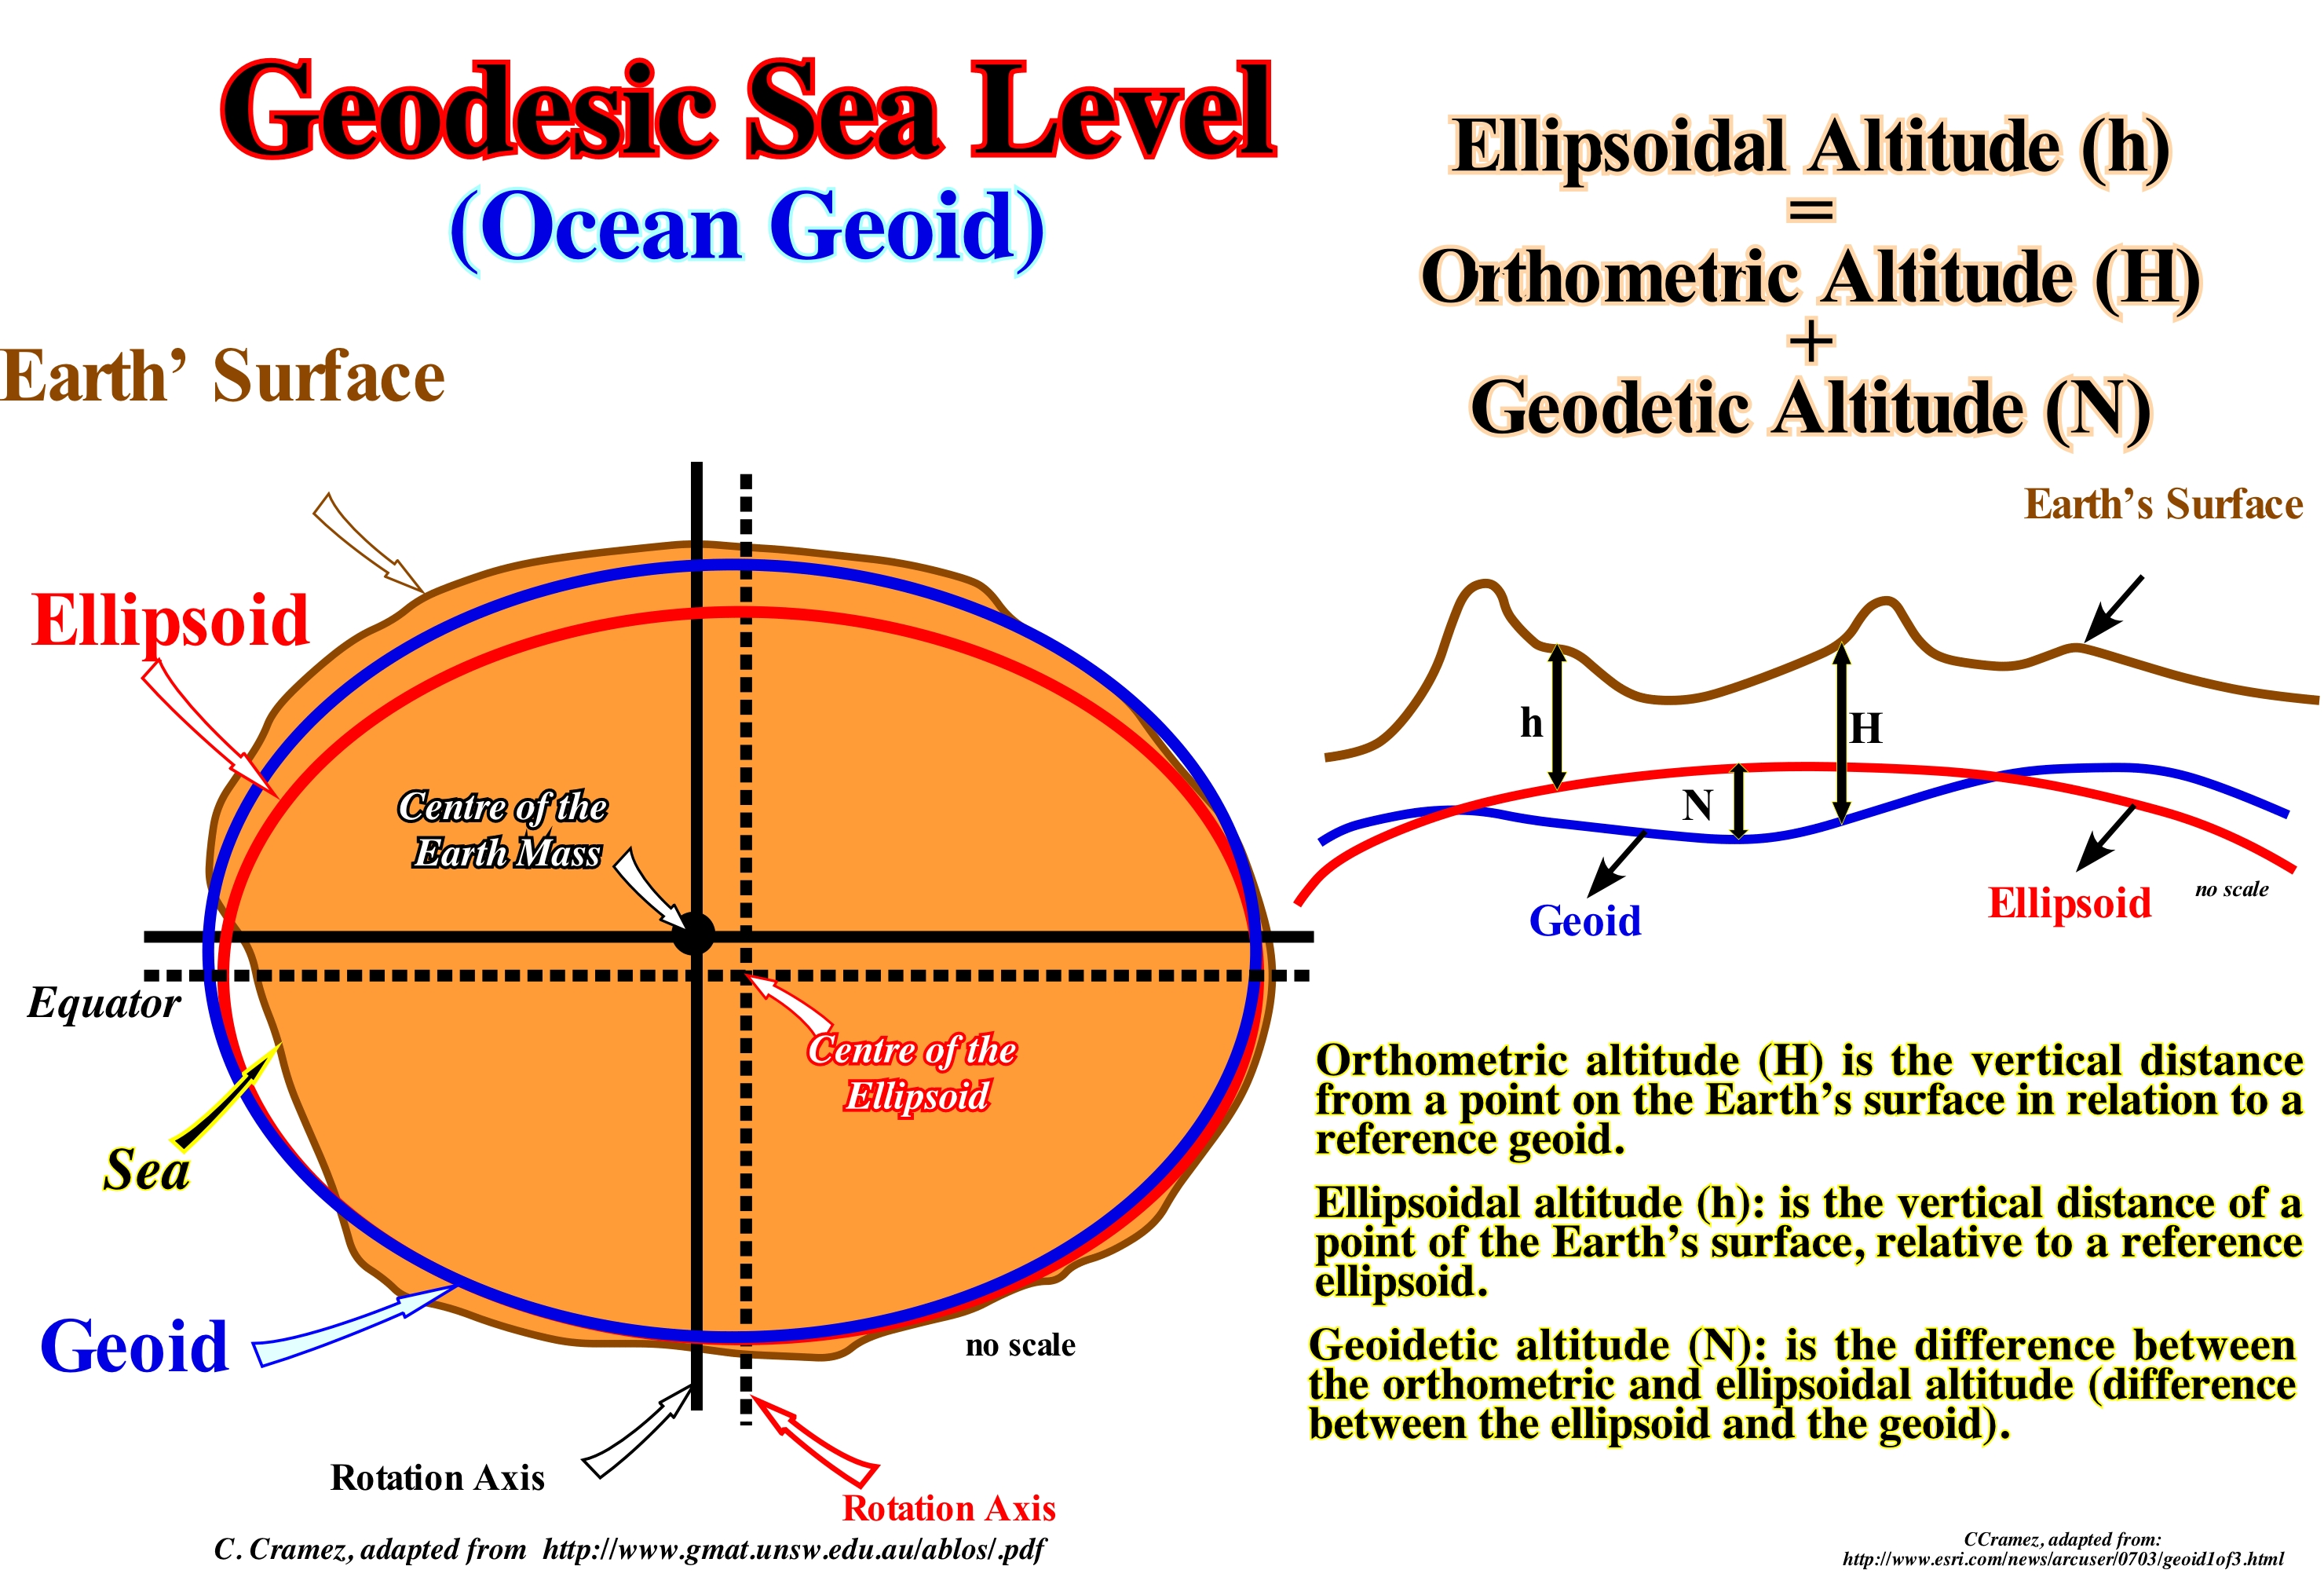
The geoid is the equipotential surface that would coincide, exactly, with the average surface of the Earth's oceans, if they were in equilibrium, at rest, and if they extended across the continents. The geoid is, essentially, the figure of the Earth abstracted from its topographical characteristics, i.e., an ideal surface of equilibrium of the sea water or the average level of the surface of the oceans, in the absence of currents, variations of the atmospheric pressure, etc., and continued under the continental masses. As illustrated in this sketch, the geoid, unlike the ellipsoid (a quadratic surface analogous to an ellipse, which can be represented by an algebraic equation of the second degree), is irregular and too complicated to serve as the computational surface to solve geometric problems such as position of a point. When the three rays of an ellipsoid are the same, it is a sphere. When two rays are equal, the ellipsoid is a spheroid. The geometric separation between the geoid and reference ellipsoid is called geoidal difference or geodetic altitude. It varies, globally, between about 110 meters. Conventionally, the mean sea level (MSL) is the mean sea height referenced to an appropriate reference surface. However, the definition of reference level involves many complex measures and determining the mean sea level can be very difficult. On the other hand, to use this definition far from the sea, one has to compare a height of the local mean surface of the sea with a "levelled" reference surface which, in general, is the geoid. In ideal conditions, that is, at rest and in the absence of external forces, the mean sea level would coincide with the surface of the geoid (the equipotential surface of the Earth's gravitational field). Due to currents, variations in air pressure, temperature, salinity, etc., this does not occur, not even as a long-term average. As a function of location, but persistent over time, the separation, between the mean sea level and the geoid, is referred to as the sea surface topography (stationary). It varies globally on a scale of plus or minus 2 m. It is this stationary sea surface that many geoscientists call geodesic sea level. To determine the "average sea level", the best thing to do is to determine a place and calculate the average sea level at that point and use it as a reference point. Generally, from hourly observations made over a period of about 20 years, the mean can be calculated for this measurement point. As a sea level rise is perhaps the most familiar and, probably, the most consequential effect, it is always important to know what sea level (absolute or eustatic, relative, mean, high-tide, etc.) is taken into account and how was calculated. In order to explain eustasy (absolute or eustatic sea level changes referenced to the Earth's centre), many geoscientists use the wine cup metaphor (glass is replaced by transparent rubber). For a given quantity of wine (amount of water in all its forms is considered constant since the Earth's formation), the size of the cup simulates the volume of the ocean basins. As the cup volume change by shortening or lengthening (simulating the oceanic expansion), wine level rises or falls. The rise and fall of the wine level simulates tectono-eustasy. The volume of wine in the cup can vary either by drinking a little bit of wine (glaciations, formation of ice caps, etc.) or by pouring more wine in the glass (deglaciations, melting ice caps), which causes a fall or rise of wine level (glacio-eustasy). The dilation of wine as a function of the temperature is sometimes considered, but it does not play an important role (thermal expansion of the oceans or steric rise of the sea level). In the cup, the wine surface is not horizontal but undulating (geodetic sea level, i.e., any change in gravity induces a redistribution of the irregularities of the water surface). That means the geoidal-eustasy can be taken into account (changes in the distribution of ocean water caused by variations in the terrestrial gravity field). Thus, at the hierarchical level of the sequence-cycles, a marine ingression is induced by a relative sea level rise which is the result of the combined action of absolute (eustatic) sea level and tectonics (subsidence or uplift of the sea floor). The relative sea level, is a local sea level referenced to any point on the Earth's surface whether the base of the sediments (top of the continental crust) or the sea floor.
Geodetic Sea level.......................................................................................................................................................................Géoïde océanique
Geóide oceânico / Geóide oceánico / Geodätische Meeresspiegel / 大地海平 / Средний уровень моря / Geodetic livello del mare /
Sea level of the geoid, also called the geodetic sea level, corresponds to a set of digital values of the highest geoid points in relation to a reference ellipsoid. The geoid is defined as the equipotential surface of the Earth's gravity field that best represents the average global sea level. The sea level is wavy and mimics, more or less, the topography of the sea floor. However these undulations are very small and can only be measured by altimetric radars from satellites.
See: « Relative Sea Level »
&
« Eustasy »
&
« Geoidal-Eustasy »
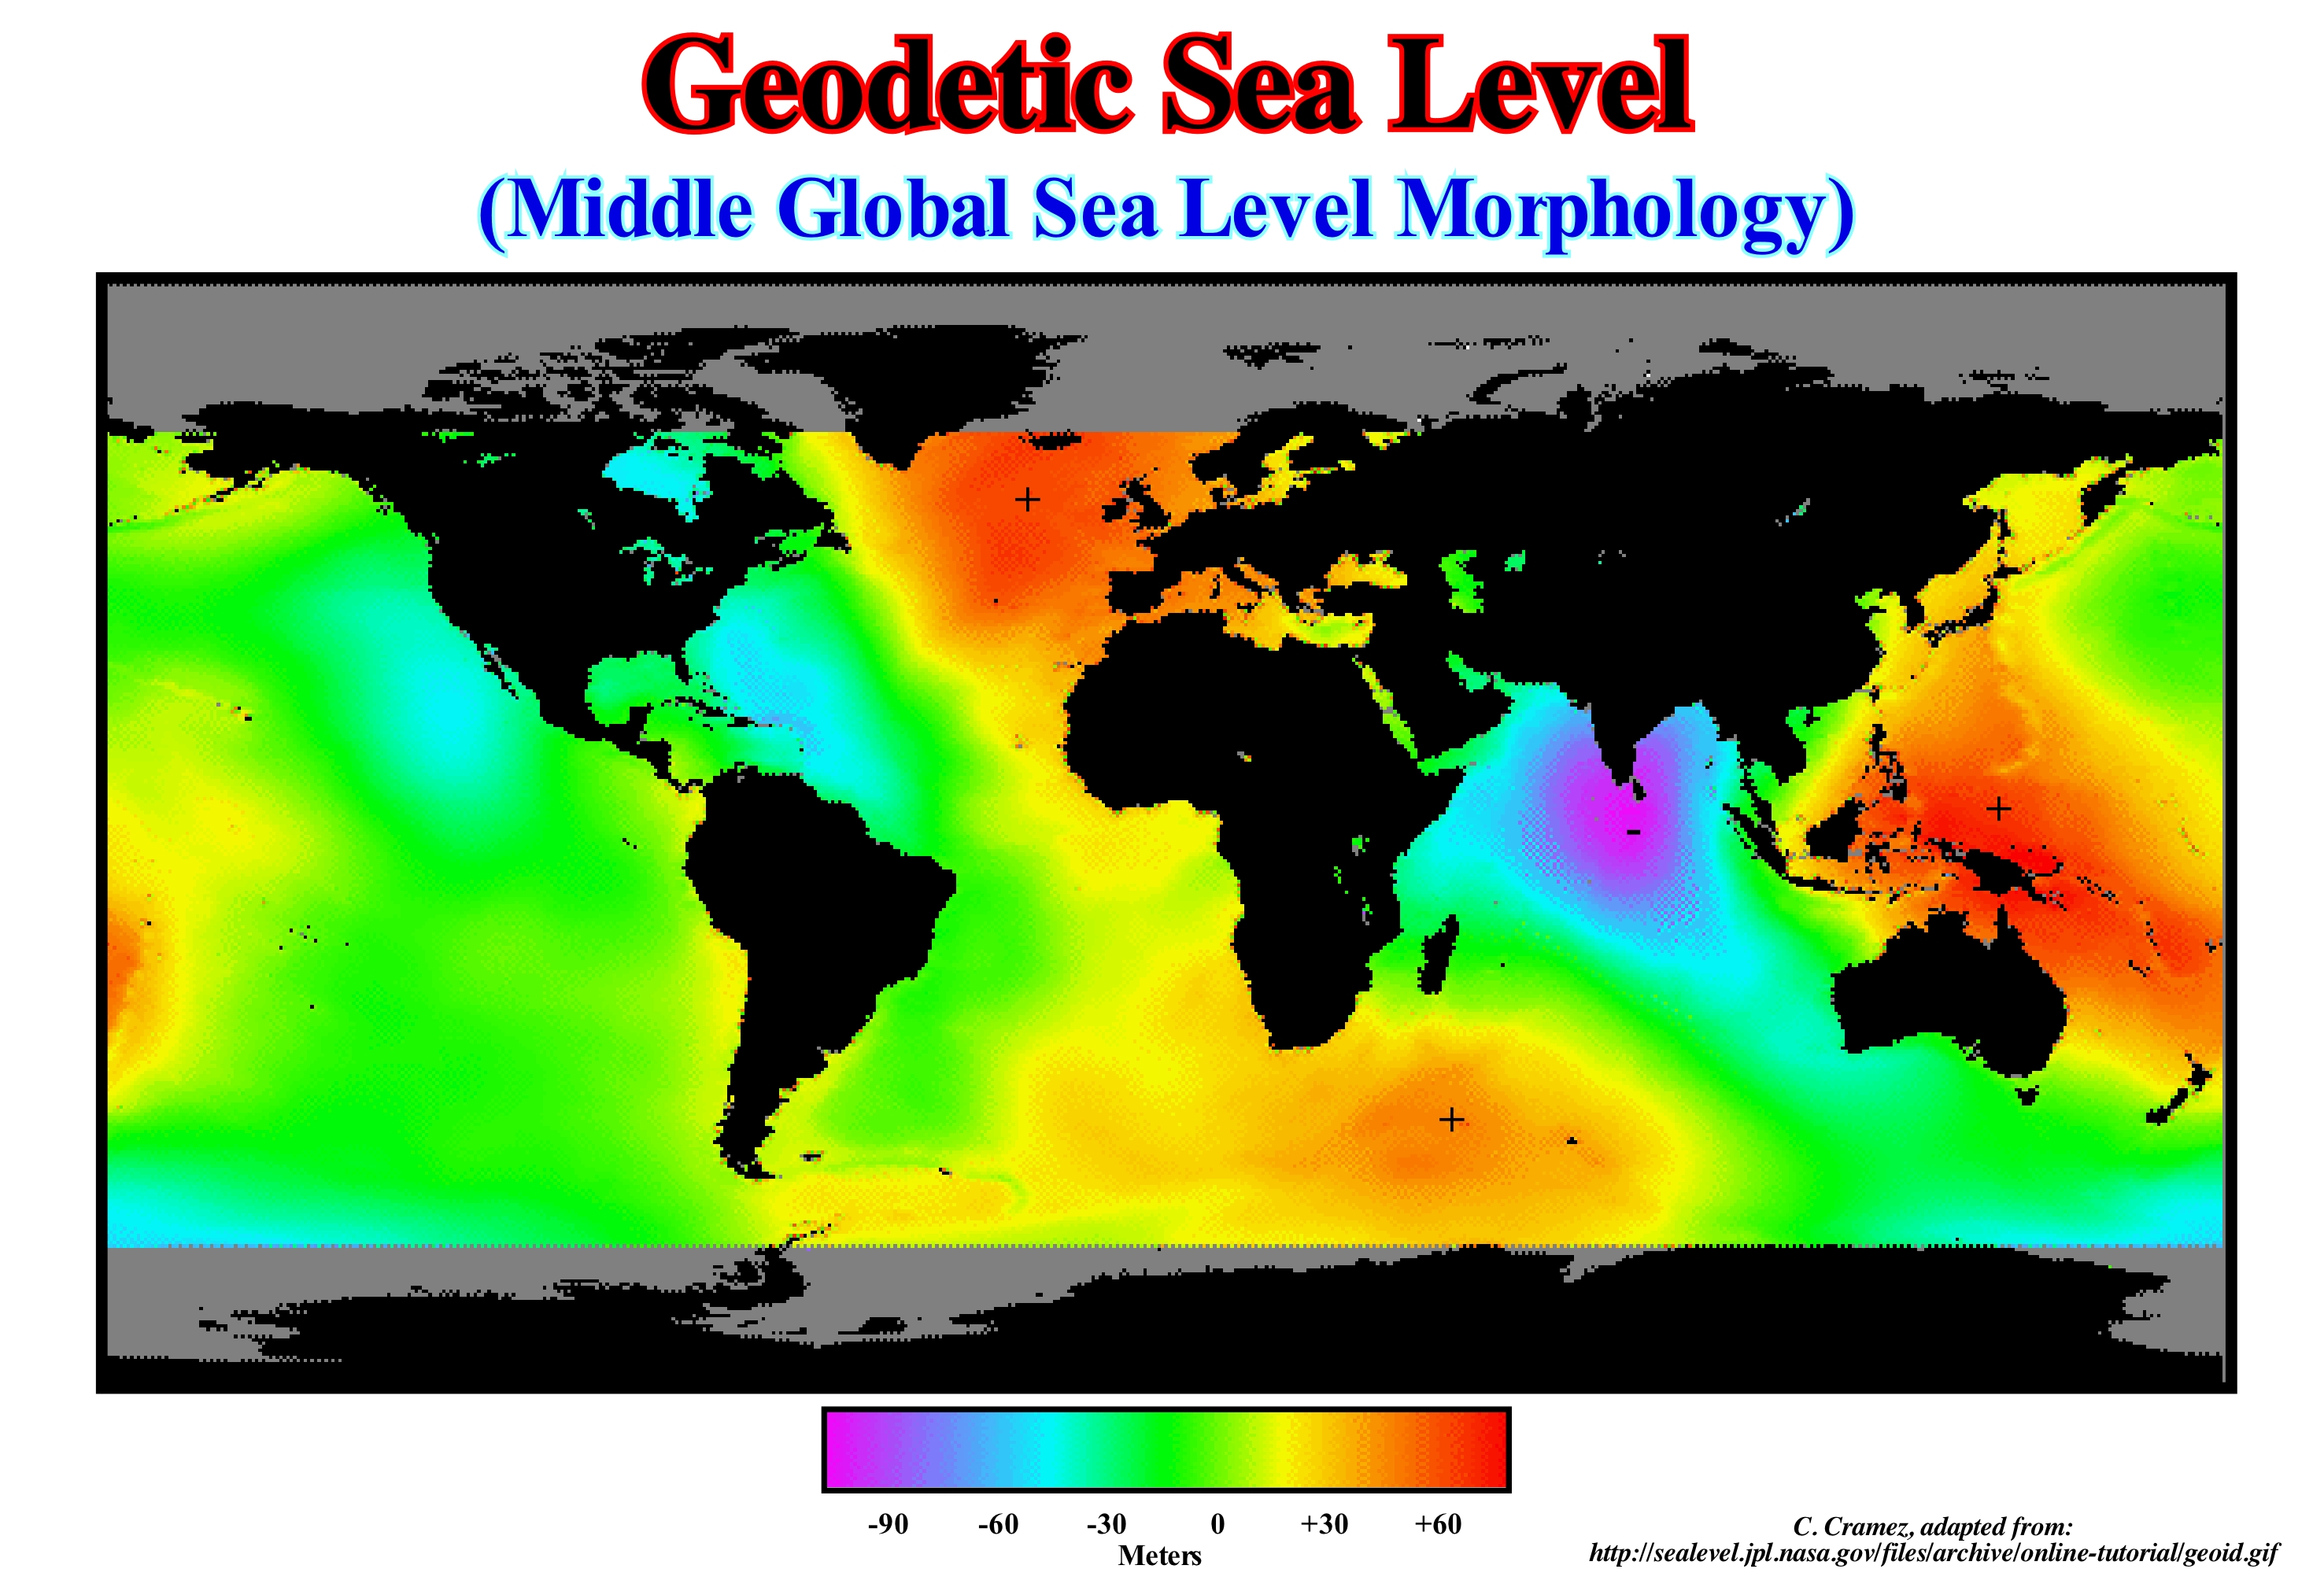
In this oceanic geoid it is easy to distinguish the undulations of the average global sea level. These must necessarily be taken into account in sequential stratigraphy, especially to determine the validity of certain geological events considered as global. The GOCE (Gravity field and steady-state Ocean Circulation Explorer) mission, accurately, measured the gradients (rate of change of an amount in the range of another quantity on which the first depends) of gravity and proposed a global model of the Earth's gravity field and the geoid, which serves as a reference for all topographical elements. Everything depends on the knowledge of the field of terrestrial gravity, which defines the horizontal. It is a function of several factors, such as the presence of mountain ranges and oceanic trenches, which make the Earth's surface very uneven. In addition, due to the fact that the Earth's materials have different densities and are not uniformly distributed, the force of gravity varies from one place to the other at the Earth's surface. The accuracy of gravitational force values is fundamental not only for geodesy, but also to better understand the geological processes that occur within the Earth, circulation of the oceans, movement of the glaciers, and, of course, absolute (eustatic) sea level changes which is, particularly, relevant to sequential stratigraphy. The absolute sea is referenced to a fixed point, which may be the Earth's centre). Given the oceanic geoid, an absolute (eustatic) sea level rise observed at a certain point on the Earth's surface, probably, does not have the same sedimentological consequences on all parts of the Earth's surface. Suess (1888) thought the shoreline displacements were caused by sea level changes. He used Eustasy to name those changes that he considered global. Such an eustasy concept was falsified when geoscientists showed: (i) The sedimentary transgressions/regressions cycles of do not correlate globally and (ii) They are, mainly, induced by local uplifts and subsidence. Eustasy or Eustatism is most often defined as "simultaneous and global sea level changes", i.e., changes in absolute (eustatic) sea level to well differentiate them from the local relative sea level changes. That is to say, that many of the unconformities induced by significant relative sea level falls (measured in reference to any point on the Earth's surface as the sea floor or the base of the sediments) do not have, probably, a global value, as is, often, thought. In some places, tectonics (subsidence of the sea floor, when the predominant tectonic regime is extensional or uplift, when it is in compressional) may be more important than eustasy. A significant relative sea level riser may occur due to: (i) An anthropogenic subsidence of the sea floor, as it is the case for many coasts with large agglomerations (Jakarta city, in Indonesia, for instance) and (ii) A natural subsidence (weight of sediments) as is the case in the Ganges delta and, particularly, in Bangladesh. The Earth is wider around the equator than between the North Pole and South Pole. It is similar to an ellipsoid or spheroid. The Earth's ellipsoid is a rough mathematical figure of Earth's shape, used as a frame of reference for geodetic, astronomical, and geoscience computations. The geoid is a surface that is complex to describe mathematically but can be, easily, identified by measuring gravity. If all points of the Earth with the same gravity are united and if this gravity is the one that has the surface of the sea, a geometric figure is formed. However, it is not regular and perfect, but with deformations rising or falling depending on composition and density of ground below each point. It can be said the ellipsoid is a mathematical figure and the geoid is a physical figure. In the oceans, the geoid is roughly equal to the mean sea level. In continental areas, the geoid and the mean sea level may be very different. The "average sea level" can be determined in a certain place and used as reference point. Generally, it is determined from hourly observations, made over a period of about 30 years*, the mean can be calculated for that measurement point. In this oceanic geoid, it is easy to distinguish the undulations of the average global sea level. These must necessarily be taken into account in sequential stratigraphy, especially to determine the validity of certain geological events considered as global. The GOCE (Gravity field and steady-state Ocean Circulation Express) mission measured, accurately, the gradients (rate of change of a quantity in the range of another quantity on which the first depends) of gravity and gives a global model of the Earth's gravity field and the geoid, which serves as a reference for all topographical elements. Everything depends on the knowledge of the field of terrestrial gravity, which defines the horizontal. Function of several factors (presence of mountain ranges and oceanic trenches makes the Earth's surface very uneven. In additions, the fact that Earth's material have different densities and are not uniformly distributed, the force of gravity varies from one place to the other on the Earth's surface. The accuracy of gravitational force values is fundamental not only for geodesy, but also to better understand the geological processes occurring within the Earth, circulation of the oceans, movement of ice caps and, of course, sea level changes, which is particularly relevant in sequential stratigraphy. Given the oceanic geoid, a sea level rise, at a certain point on the Earth's surfaces (melting of a ice cap, for instance) probably does not have the same sedimentological consequences on all parts of the Earth's surface. Many of the unconformities, probably, have no global value, as is often thought.
(*) An average (sea level or temperature) to have meaning it must cover a rather long period. The World Meteorological Organization (WMO) recommends that it covers 30 years: from there one can speak of « normal ».
Geohistory Analysis (Example)..................................................................................................................Analyse géohistorique
Análise geistória / Análisis geohistórico / Geohistorie Analyse / 地史分析 / Геоисторический анализ (кривая оседания) / Analisi geostorico /
Quantitative summary of subsidence rates, deposition and uplift of a sedimentary basin, as well as, the study of the cooling rates and subsidence of the ocean ridges, calculated in the sedimentary basins and, particularly, the divergent and convergent margins.
See: « Subsidence »
&
« Tectonic Subsidence »
&
« Total Subsidence »
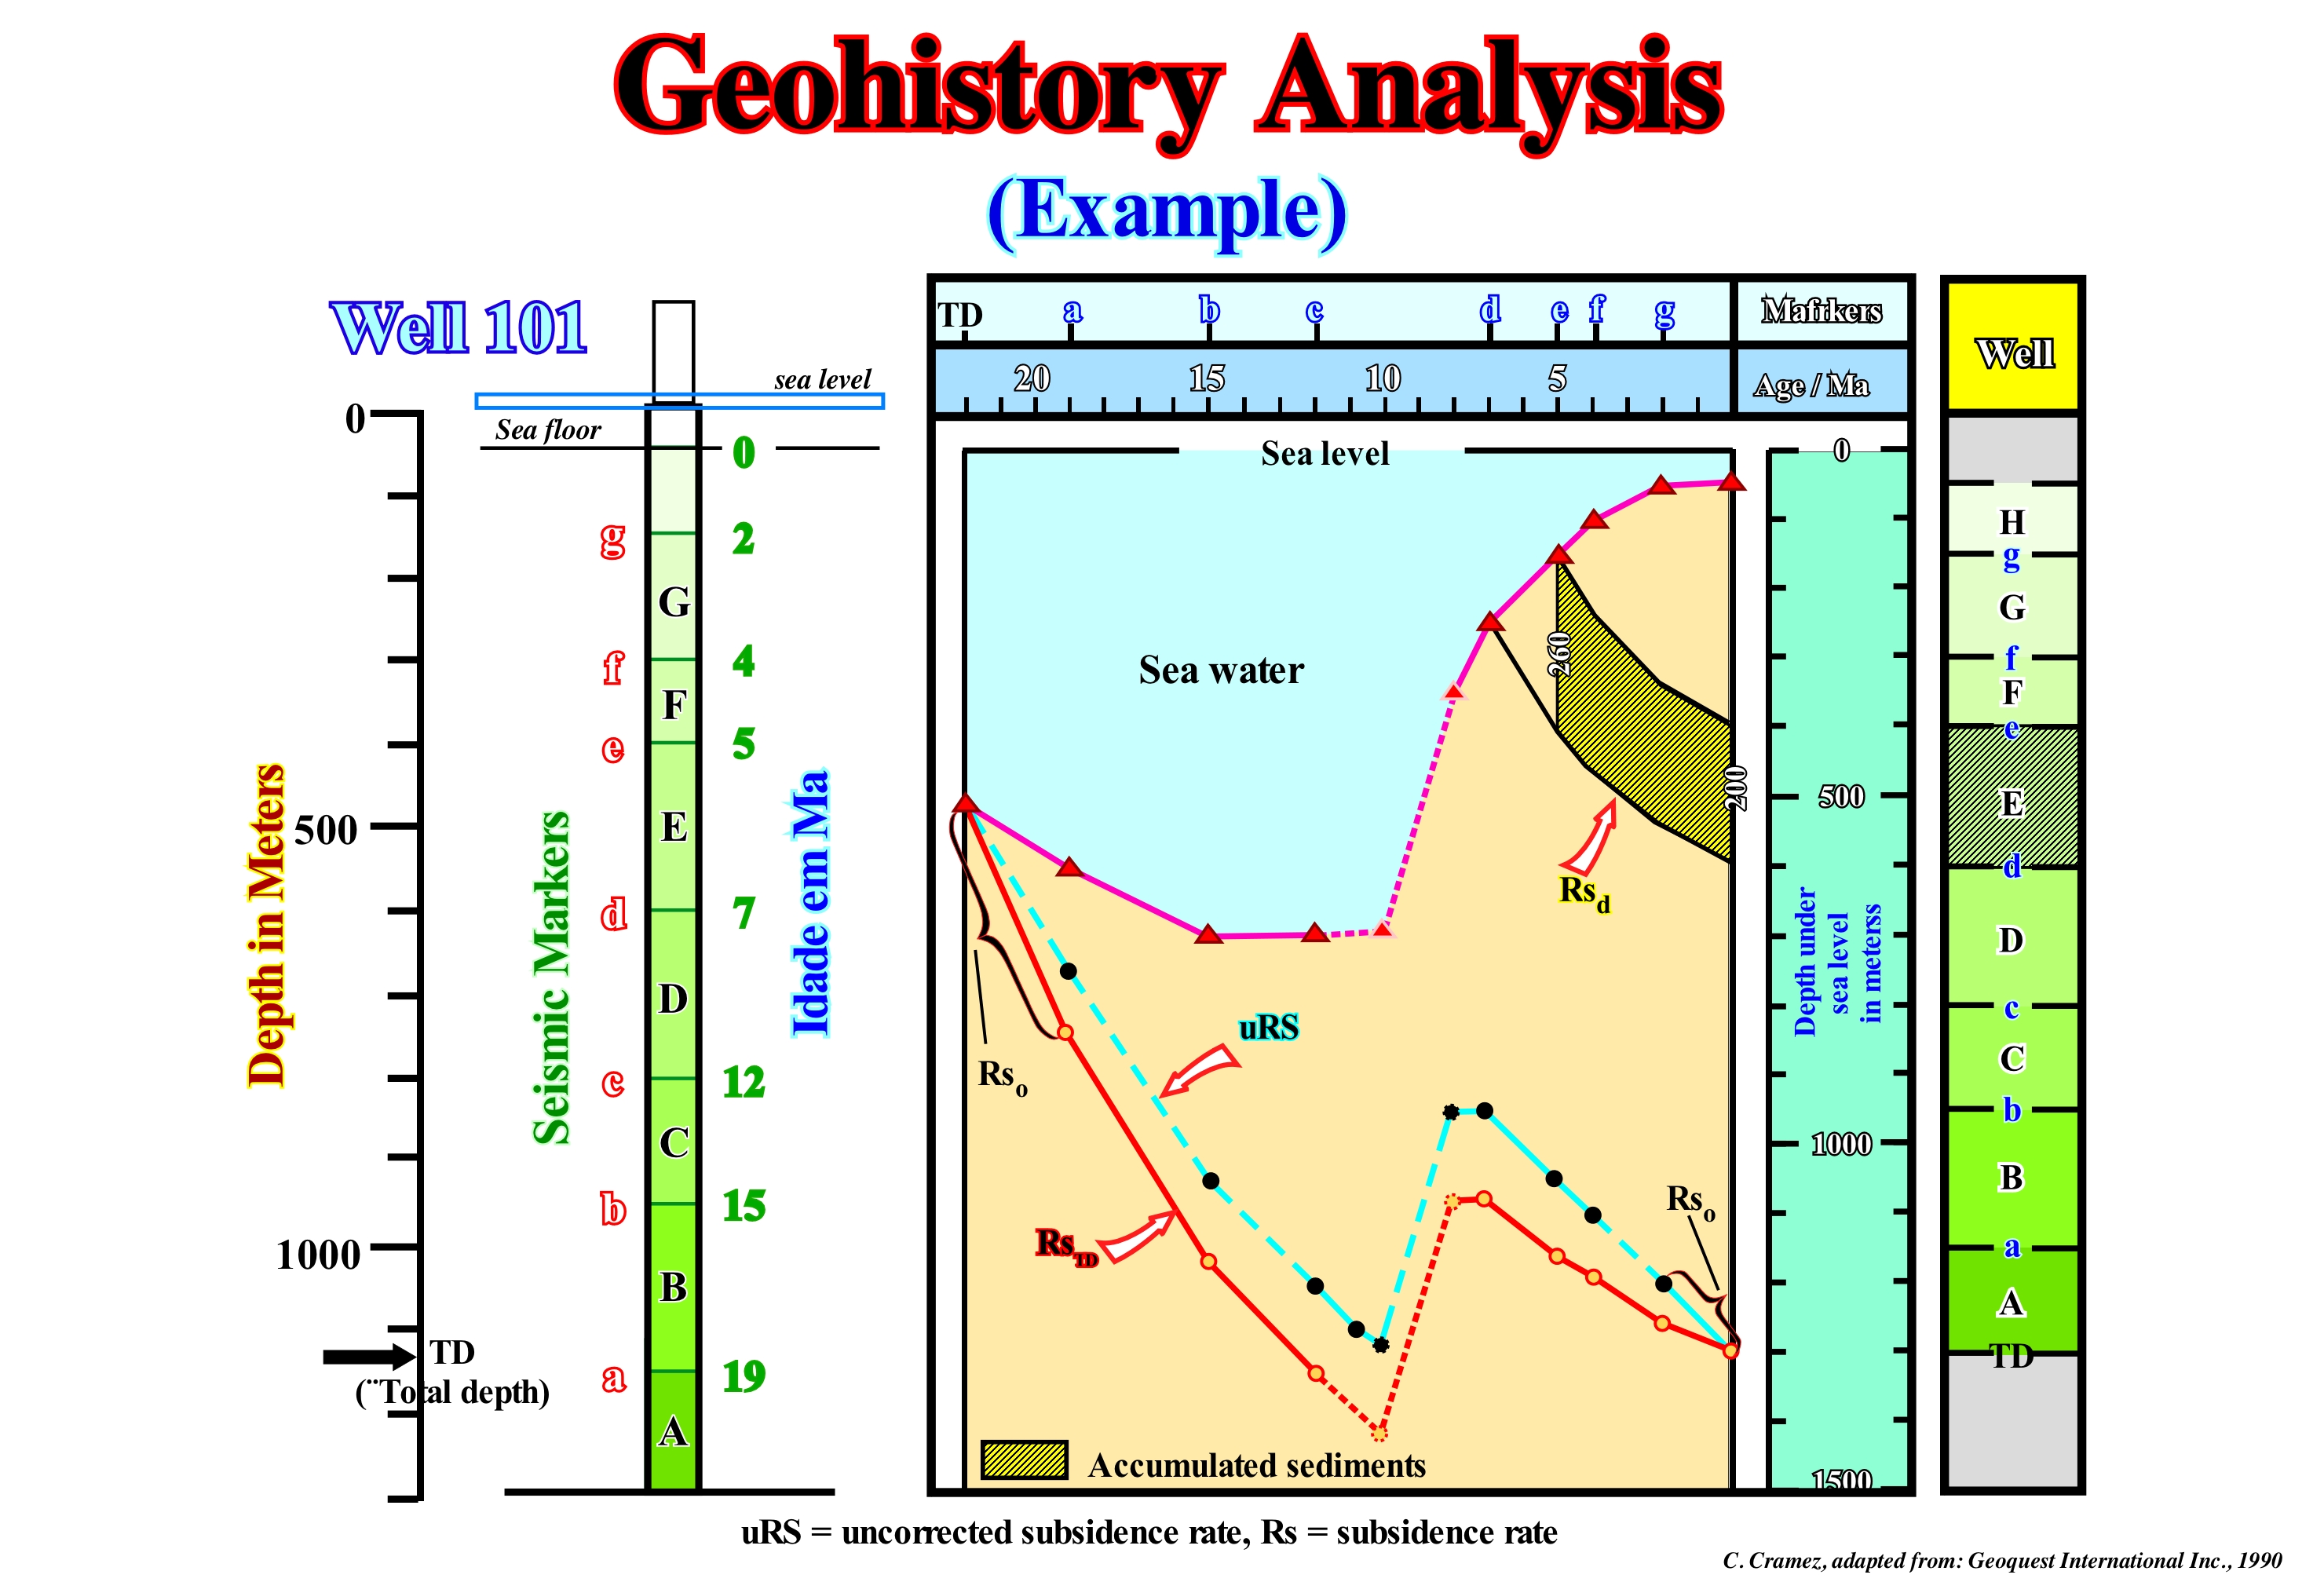
In this hypothetical petroleum exploration well, the reference markers are the fossils found in drilling debris and in the cores, as well as electrical log peaks or any other sedimentary horizon with a chronostratigraphic value. The sediment accumulation thickness and velocity were calculated for each sedimentary unit taking into account the completeness* of the sedimentary deposits. The triangles (red) are estimation of the water depth of deposition. The age of the bottom sediments and the unconformities** were determined by extrapolation of sedimentation velocities. The paleobathymetry (depositional water-depth) is represented by the triangles. The cumulative thickness, for each level, is illustrated by the black and orange circles. The dashed lines connected wit the circles, represent the current thickness and the solid lines represent the restored thicknesses. The slope of the lines gives the uncorrected subsidence velocity (uRs) and the corrected subsidence velocity (Rs). The subsidence history of a unit (with compaction correction) can be presented as indicated by the crossed out area, such as the interval E. The vertical reduction is due to compaction. As sea level fluctuations (variations in sea level relative to sea level resulting from the combination of absolute (eustatic) sea level*** and tectonics) affect paleobathymetry, the global curve of the apparent onlap changes is the horizontal part of the axis at the top of the diagram. In a geohistory analysis of a basin, when depositional and subsidence rates are calculated, it is possible to predict at what time the organic matter of the potential mature source-rocks matures, i.e., when they generated hydrocarbons (oil or gas). Erosion or nondepositional intervals determine when the diagenesis produced a secondary porosity within a given interval or when it disappeared by erosion from a part of the sedimentary records. A geological uplift (shortening) reactivates not only the evolution of the subsidence curve, but also the maturation of organic matter, formation of traps (structural) and migration of hydrocarbons.
(*) The completeness of a sedimentary deposit is the relationship between the actual deposition time and total geological time. If the time between two consecutive unconformities, for example, is 3 My and the actual deposition time is 1 My, the sedimentary completeness or simply the completeness is 0.3. The sedimentary completeness of a sedimentary layer is very small, but the preservation is great. The deposition time of a deep turbidite fan (submarine basin or slope fans) is, practically, instantaneous (in geological terms).The time between two consecutive fans, during which, practically, nothing happened (at the depositional point of view), can be thousands of years or more. The knowledge of the sedimentary completeness is essential to, correctly, determine the sedimentation rate of an interval.
(**) Erosional surfaces induced by significant relative sea level fall, i.e., that put the relative sea level lower than the basin edge.
(***) The absolute (eustatic) sea level is the global sea level referenced to the Earth's centre. It is the result of the combined action tectono-eustasy (controlled by the volume variation of the ocean basins), glacio-eustasy (controlled by the volume variation of ocean water), geoidal-eustasy (controlled by the distribution of ocean water caused by variations in the Earth gravity field) and thermal expansion of the oceans or steric sea level rise (if the temperature of the oceans increases, the density of the water decreases and , for a constant mass, the volume increases).
Geohistory Analysis (Subsidence curve).........................................................................................Analyse géohistorique
Análise geistórica / Análisis geohistórico / Geohistorie Analyse / 地史分析 / Геоисторический анализ (кривая оседания) / Analisi geostorico /
Quantitative summary of subsidence rates, deposition and upolift of a sedimentary basin, as well as, the study of cooling rates and subsidence of the ocean ridges.
See: « Subsidence »
&
« Tectonic Subsidence »
&
« Total Subsidence »
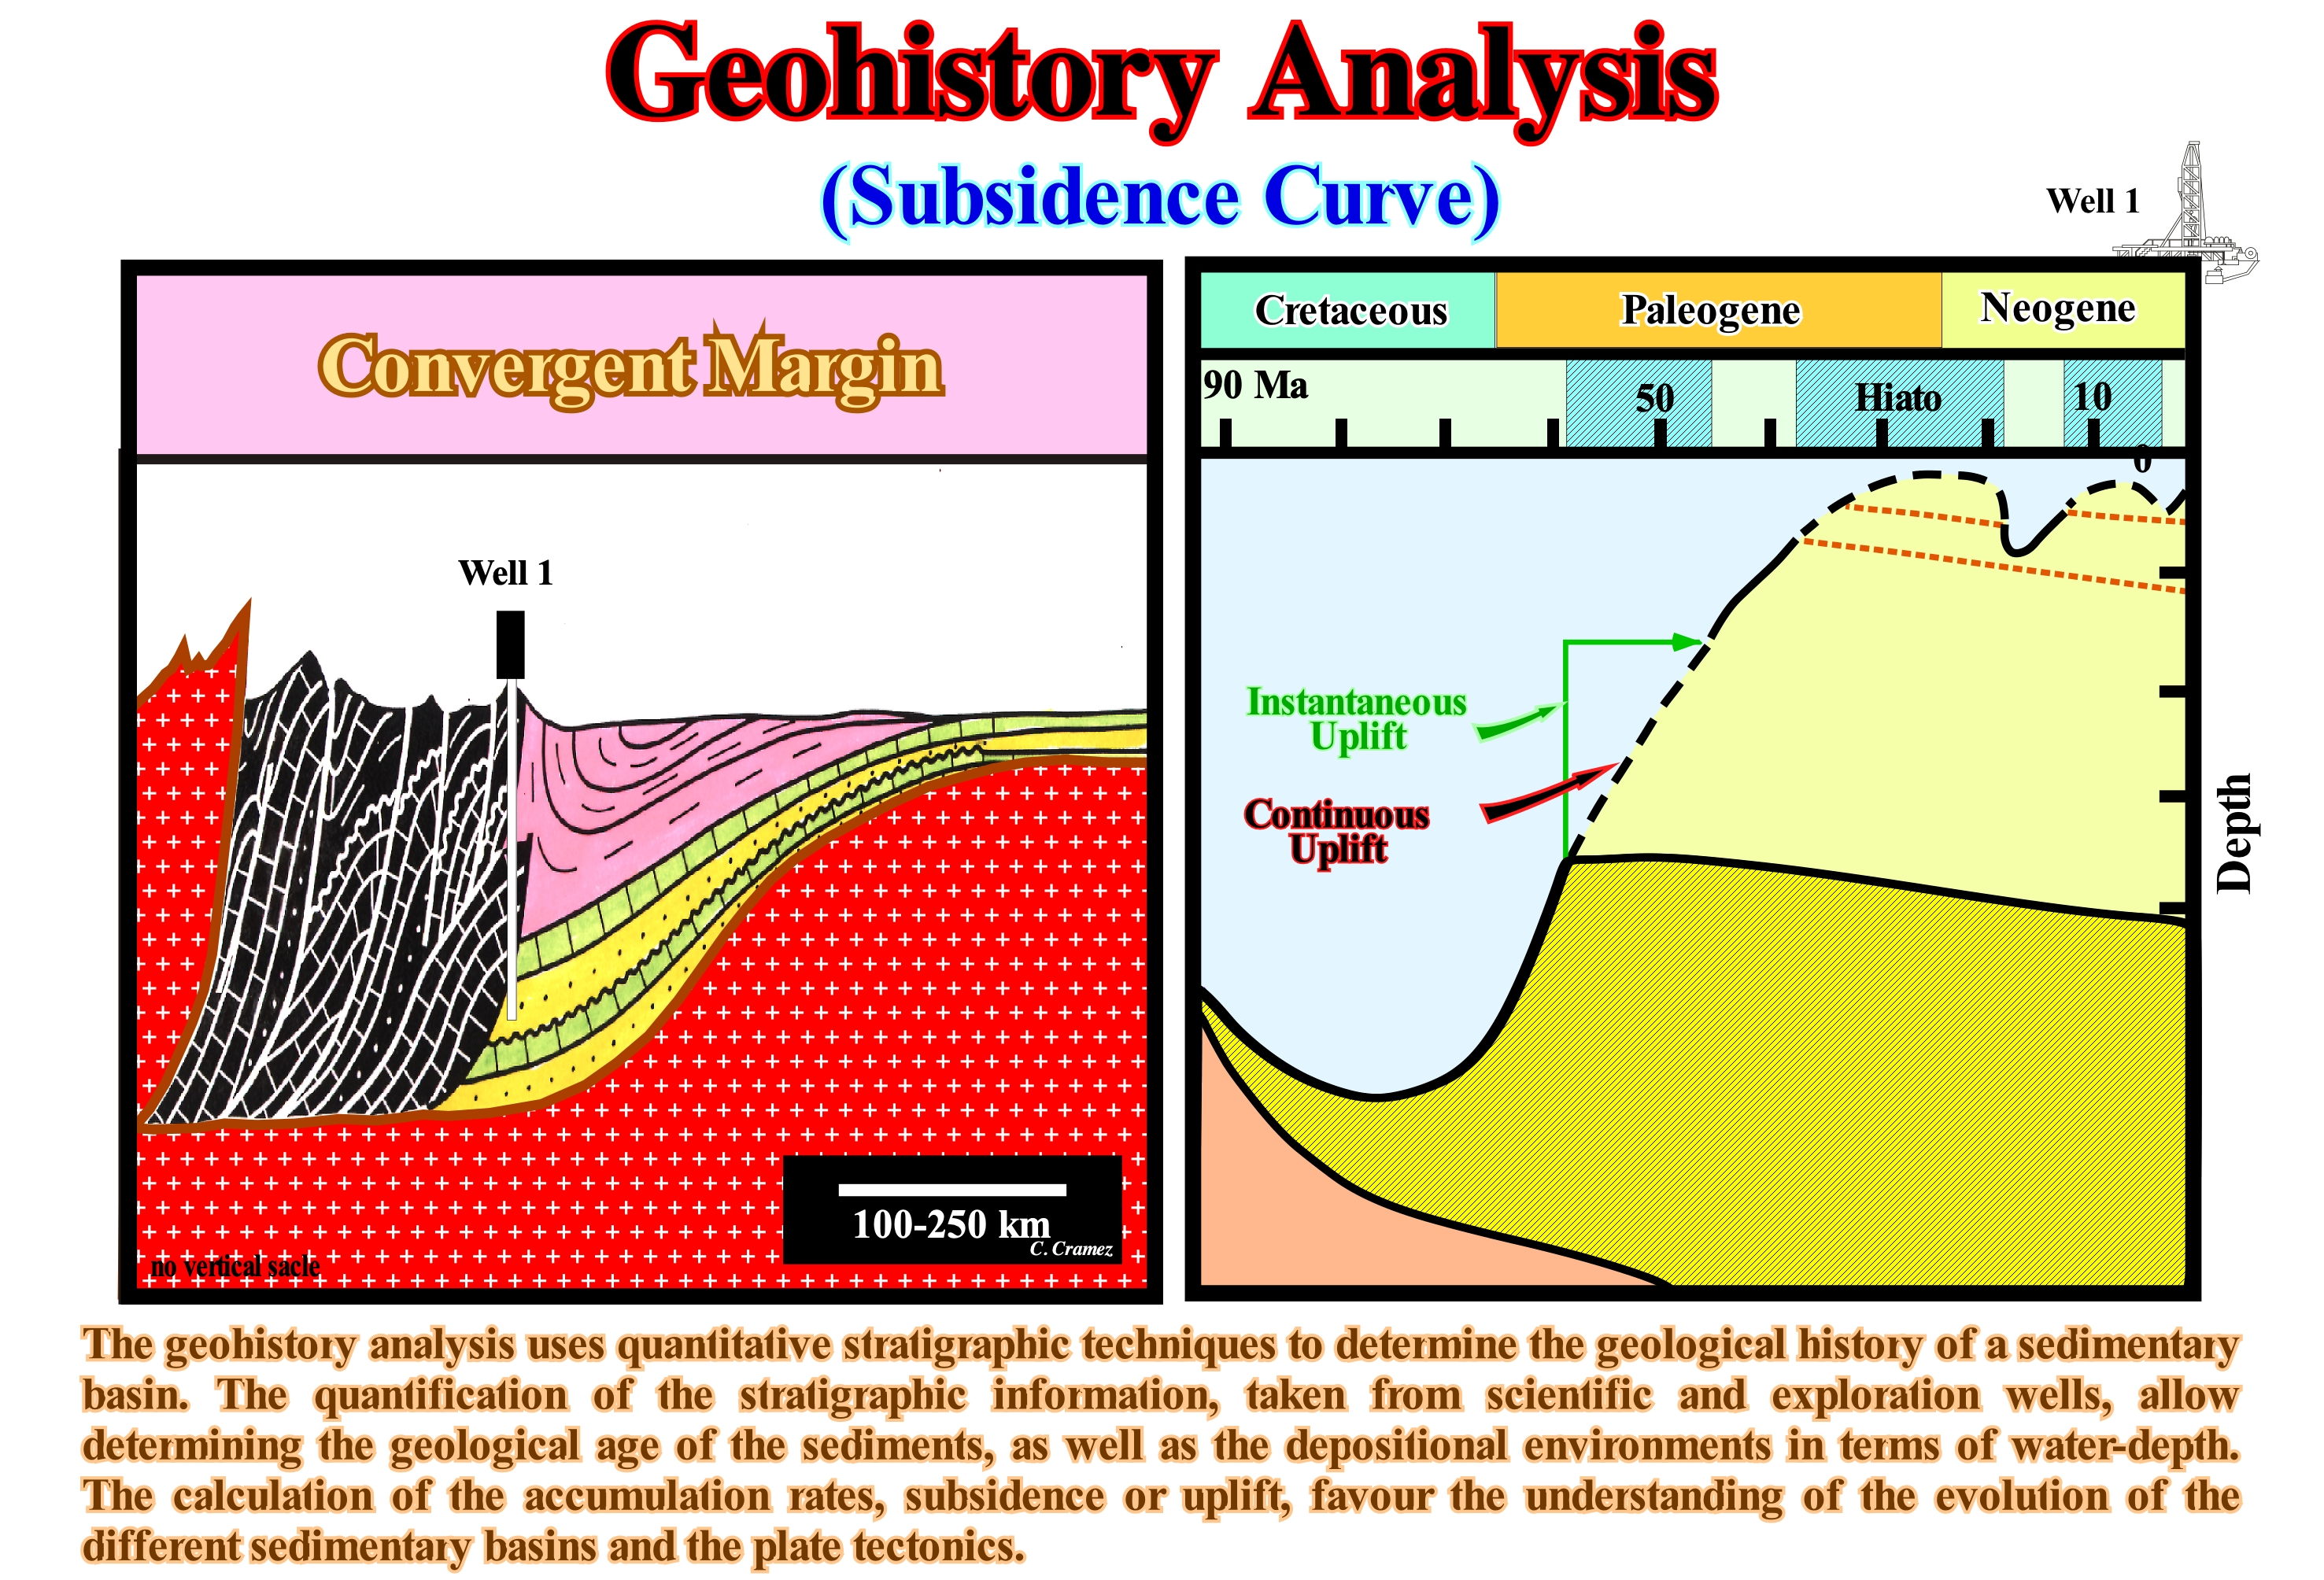
According to Van Hinte (1978), the purpose of the geohistory analysis is to construct a graphical representation of the vertical movement of a horizon of the sedimentary basin considered as an indicator of the subsidence and uplift history of the basin since the horizon has been deposited. Several types of stratigraphic data are required for geohistory analysis: (A) The stratigraphic column ; (B) The current thickness of the stratigraphic units ; (C) The lithology of the different stratigraphic units ; (D) Age of different horizons ; (E) Estimation of the depositional paleodepths, etc. There are a number of assumptions and uncertainties in this type of analysis, such as: 1) Time scale ; 2) Paleobathymetric scale ; 3) Compaction corrections* ; 4) Relative sea level effects (local sea level, referenced to any point of the Earth's surface, such as the top of the continental crust, i.e., the base of sediments or the sea floor), etc. The relative sea level changes may influence the calculation of basin subsidence. The relative sea level, that is the reference from which subsidence is determined, corresponds to the combined action of the tectonics (subsidence or uplift of the sea floor) and the absolute (eustatic) sea level that is referenced to the Earth's centre. In the geohistory analysis of a sedimentary basin, when the deposition and subsidence rates are calculated, it is possible to predict when the organic of source-rocks (if they exist in the basin) reaches maturation (oil window) or that it generates hydrocarbons (oil or gas). Erosion and nondepositional intervals suggest diagenesis (set of sedimentary chemical if physical changes from deposition to consolidation and transformation into rocks) produces a secondary porosity** or even their disappearance. An geological uplift (shortening), generally, induced by a compressional tectonic regime (σ1 horizontal), reactivate the evolution of the subsidence curve, the maturation of organic matter and facilitates the formation of traps, as well as the migration of the saturants (water, gas or oil) which fill the porosity of the rocks. In this figure, the geohistory analysis of a foreland basin (perisutural basin, in the Bally and Snelson classification, i.e., usually, associated with an Ampferer or type A subduction zone) in which an oil exploration well was drilled. In the geological section (at the left), it is easy to recognize : (i) The infrastructure (basement or flattened mountain folded belt) ; (ii) An old divergent margin (here, locally, without rift-type basins) ; (iii) The foreland basin or foredeep (in violet) and (iv) A folded belt (in black and white). The unconformity*** marks the change of a regional subsidence (during the divergent margin) to a flexural subsidence created by the overloading of the thrust faults of the folded belt. The geohistory analysis of the divergent margin and the foreland basin which, progressively, is transformed in a folded belt suggests not only de beginning of the foredeep, but a tectonic uplift as well. Such uplift was induced by a compressional tectonic regime characterized by an ellipsoid of the effective stresses (geostatic pressure σg + hydrostatic or pore pressure σp + tectonic vector σt) with the horizontal major axis, i.e., σ1 horizontal and σ2 vertical. There are several depositional hiatus (colored in blue), mainly, between: (i) 59 Ma and 46 Ma ; (ii) 38 Ma and 18 Ma, and (iii) between 13 Ma and 2 Ma. With regard to the uplift during the first hiatus, two alternative interpretations are possible: (A) Instantaneous uplift (green) or (B) Continuous uplift (red). The bathymetric lines (dashed and at the right of the geohistory analysis) indicate a possibility of what may have happened during time periods not represented due to late hiatus.
(*) The strata are compacted by stacking of overlying sedimentary layers. The thickness of each layer in a sedimentary series was greater at the deposition-time than when measured in the field or on seismic lines. In order to consider the influence of sediment compaction on the thickness and density of the stratigraphic column, the porosity should be known.
(**) Porosity generated during and after diagenesis, which may result the chemical interaction of grains and matrix with interstitial water.
(***) Erosional surface induced by a significant relative sea level fall induced by the combined action of eustasy (absolute sea level) and tectonic (uplift or subsidence of the sea floor).
Geohistory Diagram.....................................................................................................................Courbe de subsidence (D'un bassin)
Curva de Subsidência / Curva de subsidencia (de una cuenca) / Erdgeschichte Diagramm / 地史图 / Схема геологической истории (бассейна) / Geostoria (schema) /
Subsidence curve constructed, in depth, for a given geological horizon, such as for the basement or the base of a sedimentary interval, as a function of geological time. When the paleo-water depth is taken into account, in each projection "Geological Age/Depth", we obtain the curve of total subsidence. When the total subsidence curve is corrected for isostatic (local) compensation and compaction, we obtain the tectonic subsidence curve. This curve suggests the water-depth that tectonics would develop if no sediment had deposited.
See: " Accommodation ”
&
« Subsidence »
&
« Tectonic Subsidence »
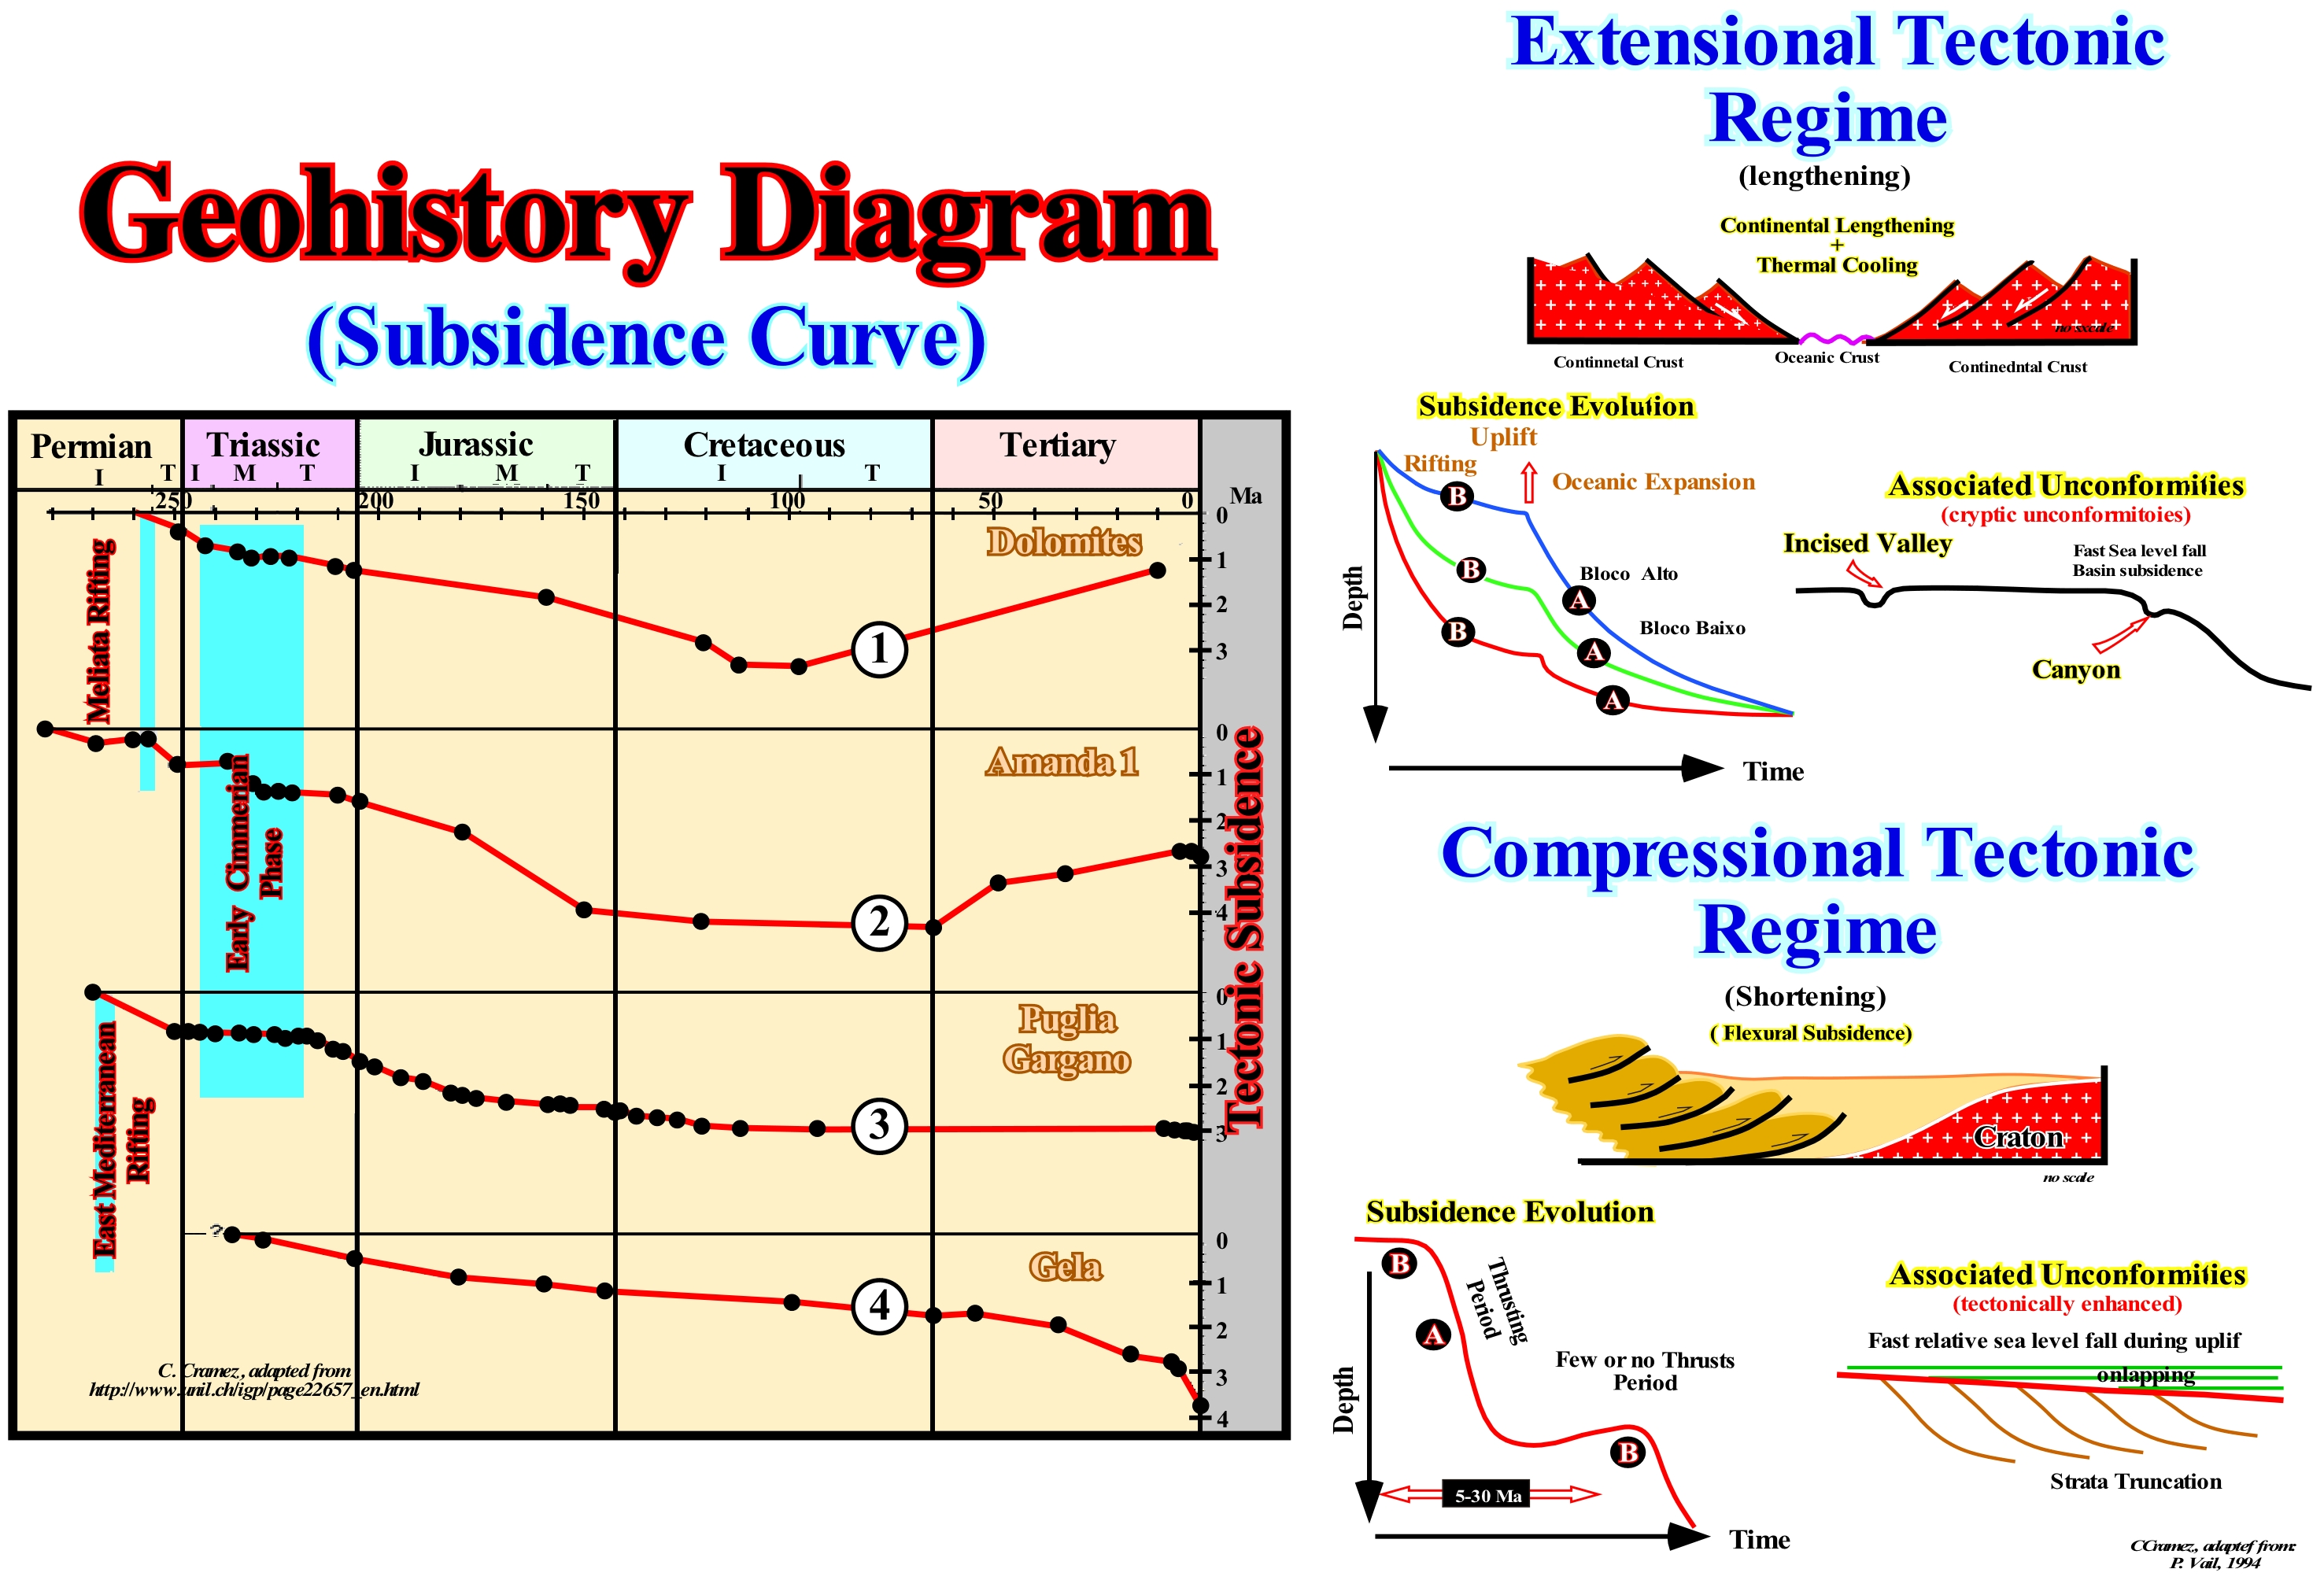
The subsidence is the sinking of the Earth's surface, relatively, to the average sea level*, that in the absence of external forces coincides, more or less, with the geoid**. Subsidence can be mainly due to: (i) Collapsing, frequent in karst land, such as during the formation of sinkholes (depressions characteristic of karst terrains formed by the chemical dissolution of underlying limestone rocks, with a shape, more or less, circular and wider than deep) ; (ii) Lengthening, in association with extensional tectonic regimes (σ1 vertical) ; (iii) Thermal contraction of the lithosphere (if the temperature of the lithosphere decreases, it shrinks causing a lowering of the surface) ; (iv) Sinking by overloading, in response to the weight of sediments or ice caps to maintain the isostatic equilibrium***. On the other hand, the subsidence can be: a) Compensatory, when created by a lateral or vertical flow of a mobile stratigraphic horizon whether it is formed by evaporites (halokinese) or by shaly rocks (shalokinese) ; b) Crustal, when subsidence is created by sinking of the Earth crust with little or no horizontal movement, caused by natural geological processes ; c) Flexural, when created by the stacking of thrust faults associated with the formation of mountain ranges and basins ; d) Tectonics, which can be calculated by the thickness of the sediments plus the water-depth , reduced by the effect of isostatic compensation and increased by the effect of compaction ; (e) Total, which corresponds to the total sinking amount of the initial depositional surface. The tectonic subsidence curves are used to calculate the rate and amplitude of subsidence, assuming isostatic compensation and compaction are instantaneous and do not affect the subsidence of the depositional surface. The curves depicted on the left side of this figure suggest different geological evolutions. In the first curve (Dolomites), after the rapid lengthening associated with a rifting phase, of Permian age, a first phase of uplift (compressional tectonic regime) occurred during the Triassic (Early Cimmerian Phase). Later, in the Late Cretaceous, a new uplift phase seems to have taken place. In the second curve (Amanda 1), the rifting phase and the shortening phase associated with the Early Cimmerian phase are well marked, as well as, the late uplift phase that started here at the beginning of the Tertiary (in the previous area the uplift began later). In the third curve (Puglia/Gargano) the Permian lengthening phase (Eastern Mediterranean rifting) is well marked, as well as, the uplift of the Early Cimmerian phase. Contrary to what the previous curves suggest, in this region, there was no uplift during the Tertiary. The last curve (Gela area), which begins in the Triassic, suggests that no compressional tectonic regime has affected the region. In contrast, it suggests an acceleration of the subsidence from the Middle Tertiary, probably associated with an important new extensional tectonic regime. In the right part of the figure, schematic subsidence curves are shown in an extensional tectonic setting (sedimentary lengthening) and in a compressional tectonic setting (sedimentary shortening). The relationships and subsidence evolutions with the tectonic regimes, as well as the characterization of associated unconformities are summarized in the geological sketches.
(*) Sea level varies greatly in time and space (distance). It is affected by tides, wind, atmospheric pressure, local gravity differences, temperature, salinity, subsidence, etc. To determine mean sea level, the best thing to do is to determine a place and calculate the average level at that point and use it as a reference point. Generally, from hourly observations made over a period of more than 20 years, it can be calculated to be average for that measurement point. As a relative sea level rise is perhaps the most familiar effect of climate changes, and probably the one with the most consequences, it is important to always specify which sea level (absolute or eustatic, relative, middle, high-tide, etc.) is taken into account and how it was calculated.
(**) The Earth is wider around the equator than between the North Pole and the South Pole. It is similar to an ellipsoid or spheroid. The Earth's ellipsoid is a rough mathematical figure of Earth's shape. The geoid is a complex surface to be described mathematically, but can easily be determined by measuring gravity. The geoid is considered to be, roughly, equal to the mean sea level. In the oceans, the geoid and mean sea level are, approximately, coincident but in the continental areas they may be very different.
(***) A process of compensation of the weight of a less dense body and a denser body occurring at the level of the interface between the lithosphere and asthenosphere according to the principle of Archimedes.
Geoid..................................................................................................................................................................................................................................................................Géoïde
Geóide / Geóide / Géoïde / 大地 / Гео́ид / Geoide /
Equipotential surface of the Earth's gravity field determined by the attractiveness and rotation potentials. Theoretical continuous and perpendicular surface at each point in the direction of gravity. It is, more or less, the form that the Earth would have if the surface of the average sea level extended over the continents.
See: « Relative Sea Level Change »
&
« Eustasy »
&
« Geoidal-Eustasy »
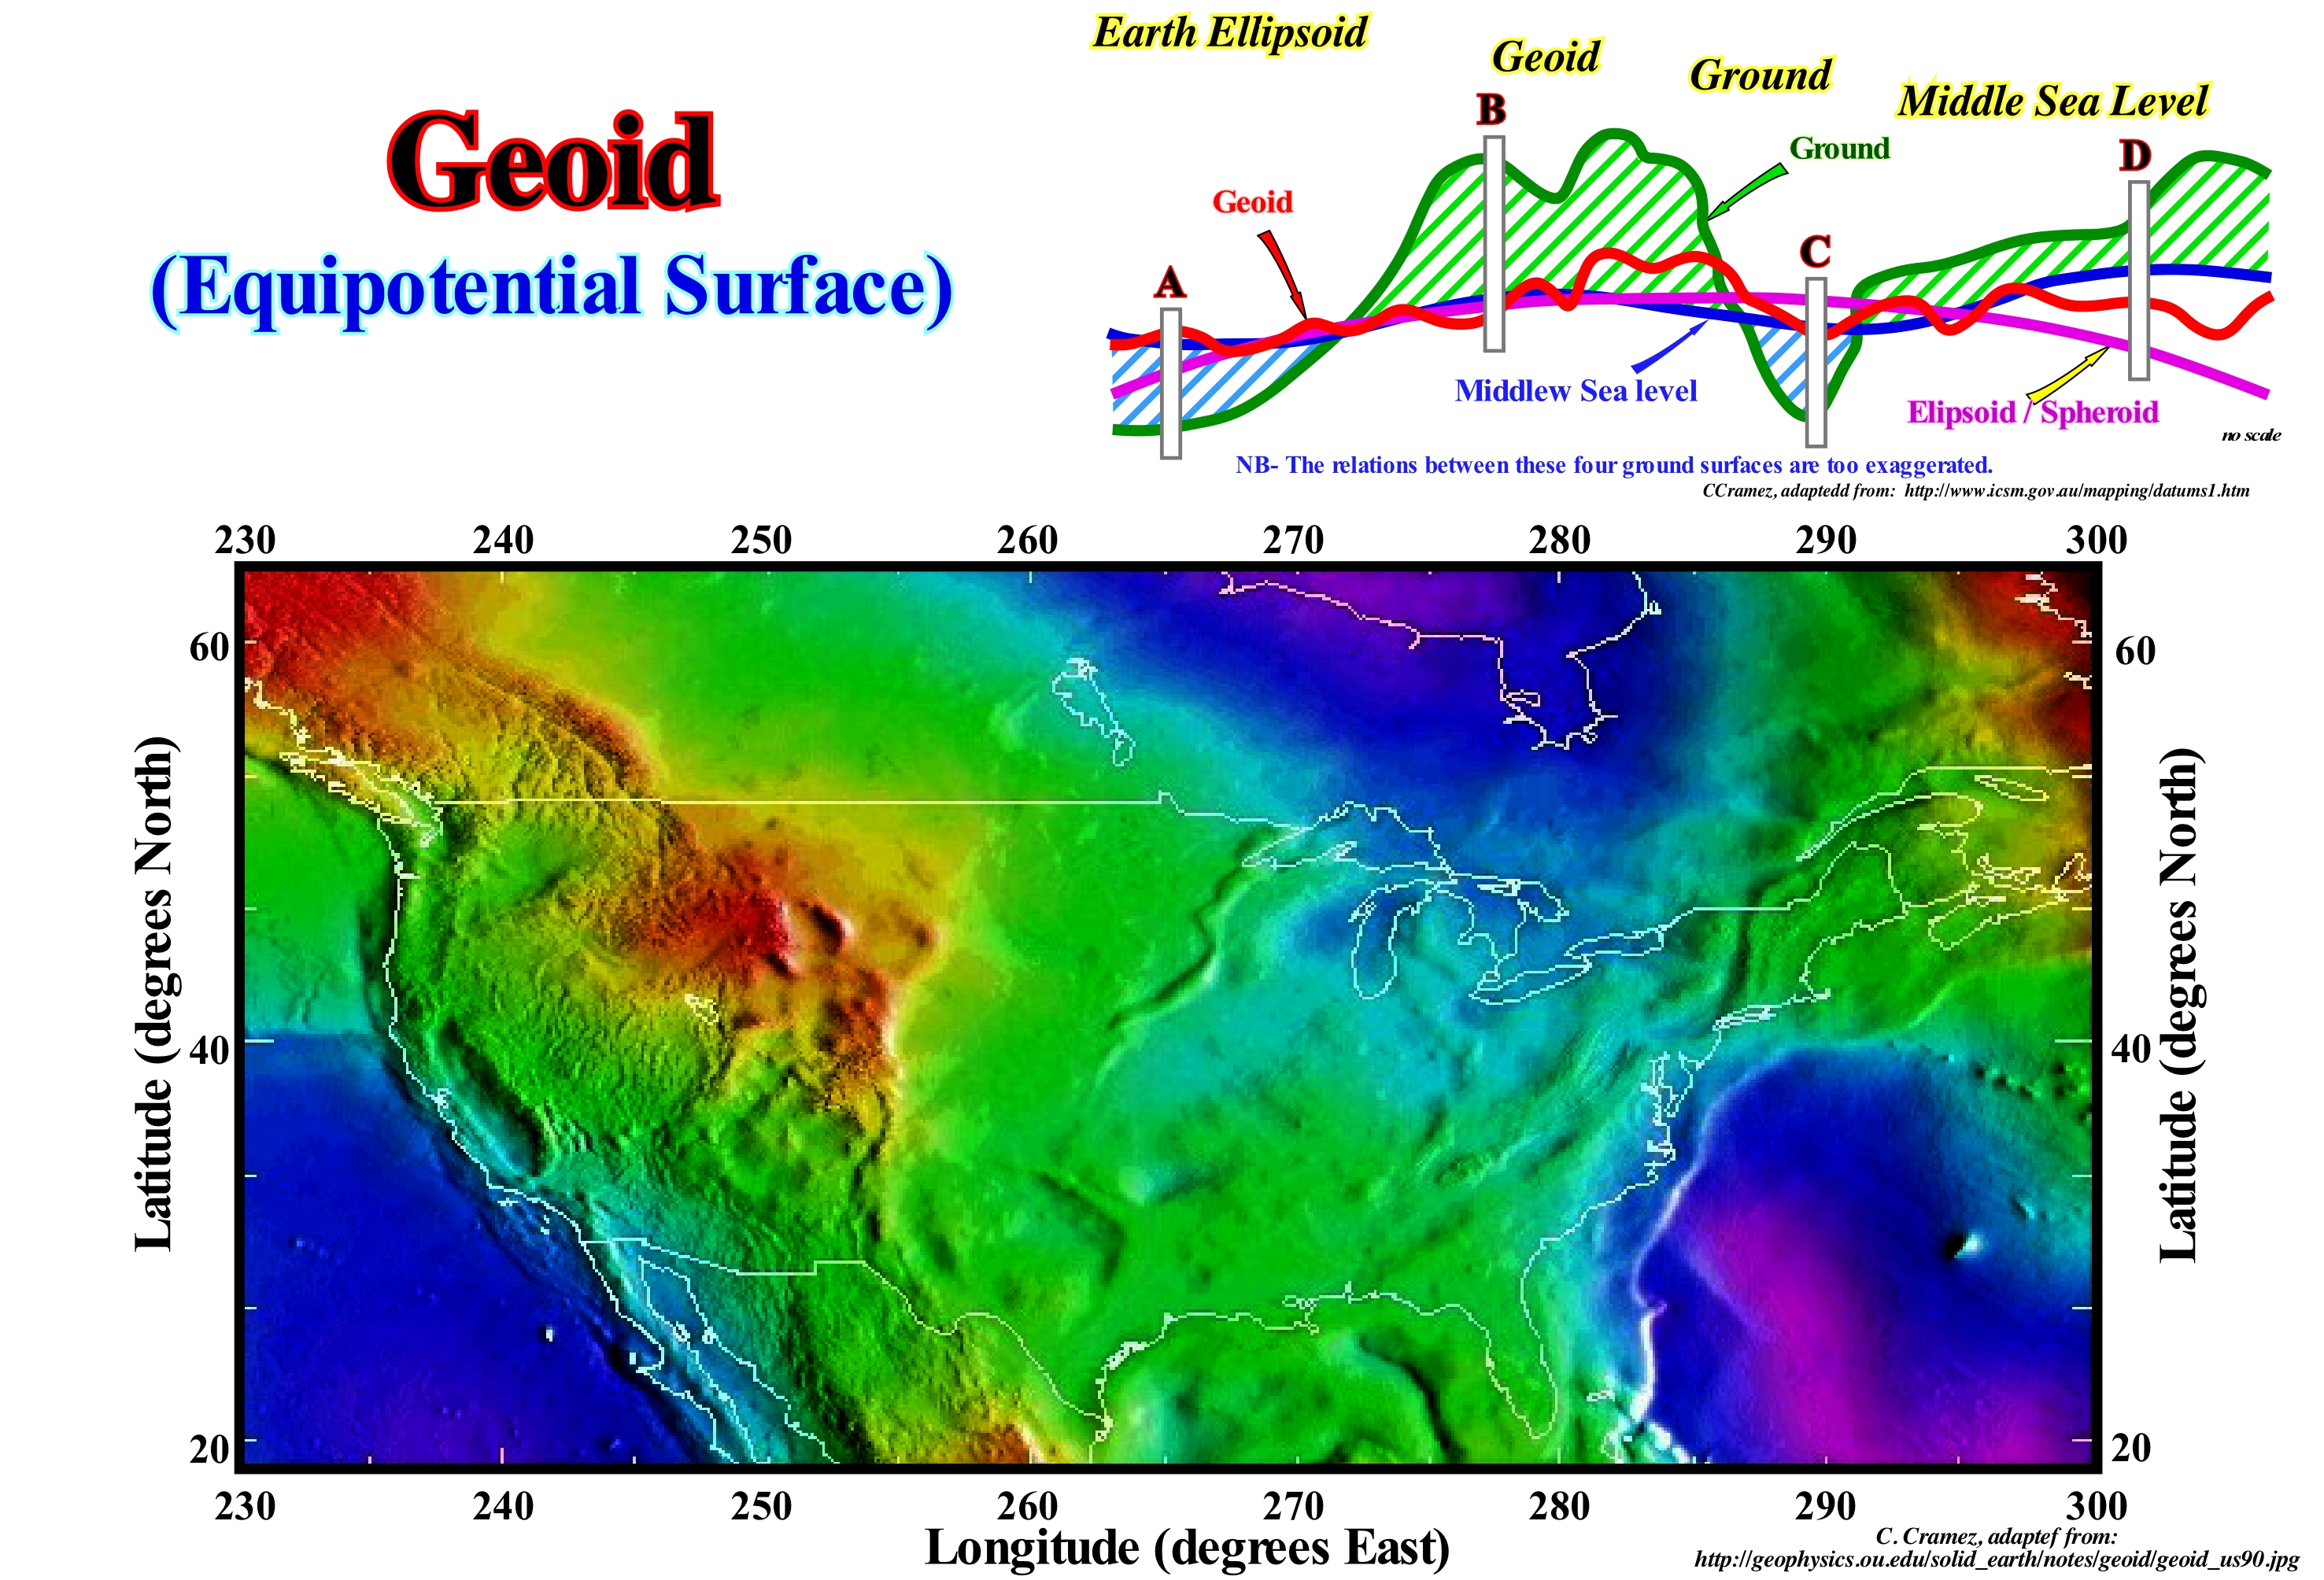
The Earth is wider around the equator than between the North Pole and the South Pole. It is similar to an ellipsoid or spheroid. The terrestrial (violet) ellipsoid is a rough mathematical figure of Earth's shape, used as a reference frame for geodesic, astronomical, and geoscience computations. The geoid (in red) is the surface that is complex to describe mathematically, but it can be, easily, identified by measuring gravity. The geoid is considered to be roughly equal to the middle sea level. In Sequential stratigraphy, geoscientist use the absolute (eustatic) sea level and the relative sea level. The absolute sea level is supposed to be the global and referenced to the Earth's centre. The relative sea level, is a local the sea level, referenced to the base of the sediments (top of the continental crust) or to the sea floor. Obviously, the relative sea level is the result of the combined action of absolute (eustatic) sea level and tectonics (subsidence or uplift of the sea floor). As a sea level rise is, perhaps, the most familiar effect of climate changes and, probably, the one with the most consequences, it is important to specify what sea level we are speaking about (eustatic, relative, middle sea level, high-tide level, etc) and how it was calculated. In the oceans, the geoid and the middle sea level are, approximately, the same but in the continental areas they may be very different. The ground (true form of the Earth) is given by topography and bathymetry. As shown in this figure, the relationships between these four surfaces (Earth ellipsoid, Geoid, Ground and Middle sea level) are very variable. The sea level varies, greatly, in time and space. It is affected by tides, wind, atmospheric pressure, local gravity differences, temperature, salinity, subsidence, etc. To determine the middle sea level, the best thing you can do is to take a place and calculate the middle sea level at that point and use it as a reference point. Generally, from hourly observations made over a period of about 30 years, the average can be calculated for this measurement point (an average of the sea level or temperature, to have meaning it must cover a rather long period: The World Meteorological Organization (WMO) recommends that it covers 30 years, from there one can speak of « normal »). The geoid is the equipotential surface of gravity closest to the middle sea level. It is the reference surface for all gravimetric measurements. Its surface differs from the theoretical three-dimensional ellipsoid of about + 67 m in the North Atlantic and -100 m in South India, due to the lateral density differences in the mantle. A boat sailing from India to the North Atlantic, has to climb 167 m. However, if it sails along an equipotential surface it does not consume energy. The Earth's gravity field is neither perfect nor uniform (Earth's material is not, uniformly, distributed in concentric layers). A flattened ellipsoid is, generally, used to idealize our planet. Even, if its was, perfectly, spherical, the force of gravity is not the same everywhere. The density varies from one point to another (mountain ranges , distribution of magma, etc.). If Earth were covered by water, it would not be at the same height everywhere, it would be higher or lower function of the force of gravity. In real conditions, sea level is not the same everywhere, what has important consequences in sequential stratigraphy. The impact of the GPS system on geodetic control programs is immense. Although GPS is a three-dimensional system, the altitudes obtained by GPS are in a different system from the altitudes obtained by geodetic levelling. GPS data can be easily processed to obtain the ellipsoidal altitude, which is the altitude above or below the simple model of the Earth's ellipsoid. The geodesic levelling gives the orthometric height, which is often known as the altitude above middle sea level. These altitudes are those found in topographic maps, geodesic landmarks, and digital data. To move from one altitude system to another it is necessary to know the altitude of the geoid. In the United States (Geoid 03), as shown in this figure, geoid altitudes scales range from -51.6 meters in the Atlantic (dark blue on this map) to -7.2 meters in the Rocky Mountains (green, red).
Geoid Change....................................................................................................................................................................................Variation du géoïde
Variação do geóide / Variación del geóide / Geoid - Änderung / 大地水准面的变化 / Изменение геоида / Variazione del geoide /
One of the changes in the geoid, which should be included in the general term eustasy: (i) They have a direct effect on changes in the level of the oceans (most sea level records pose the problem of how to separate the eustatic factor from the crustal factor) ; (ii) They affect the ocean level globally (though with different signals) and are easily distinguishable from local effects ; (iii) It is difficult, if not impossible, to distinguish them from glacial and tectonic variations.
See: « Eustasy »
&
« Relative Sea Level Change »
&
« Gravity Anomaly »
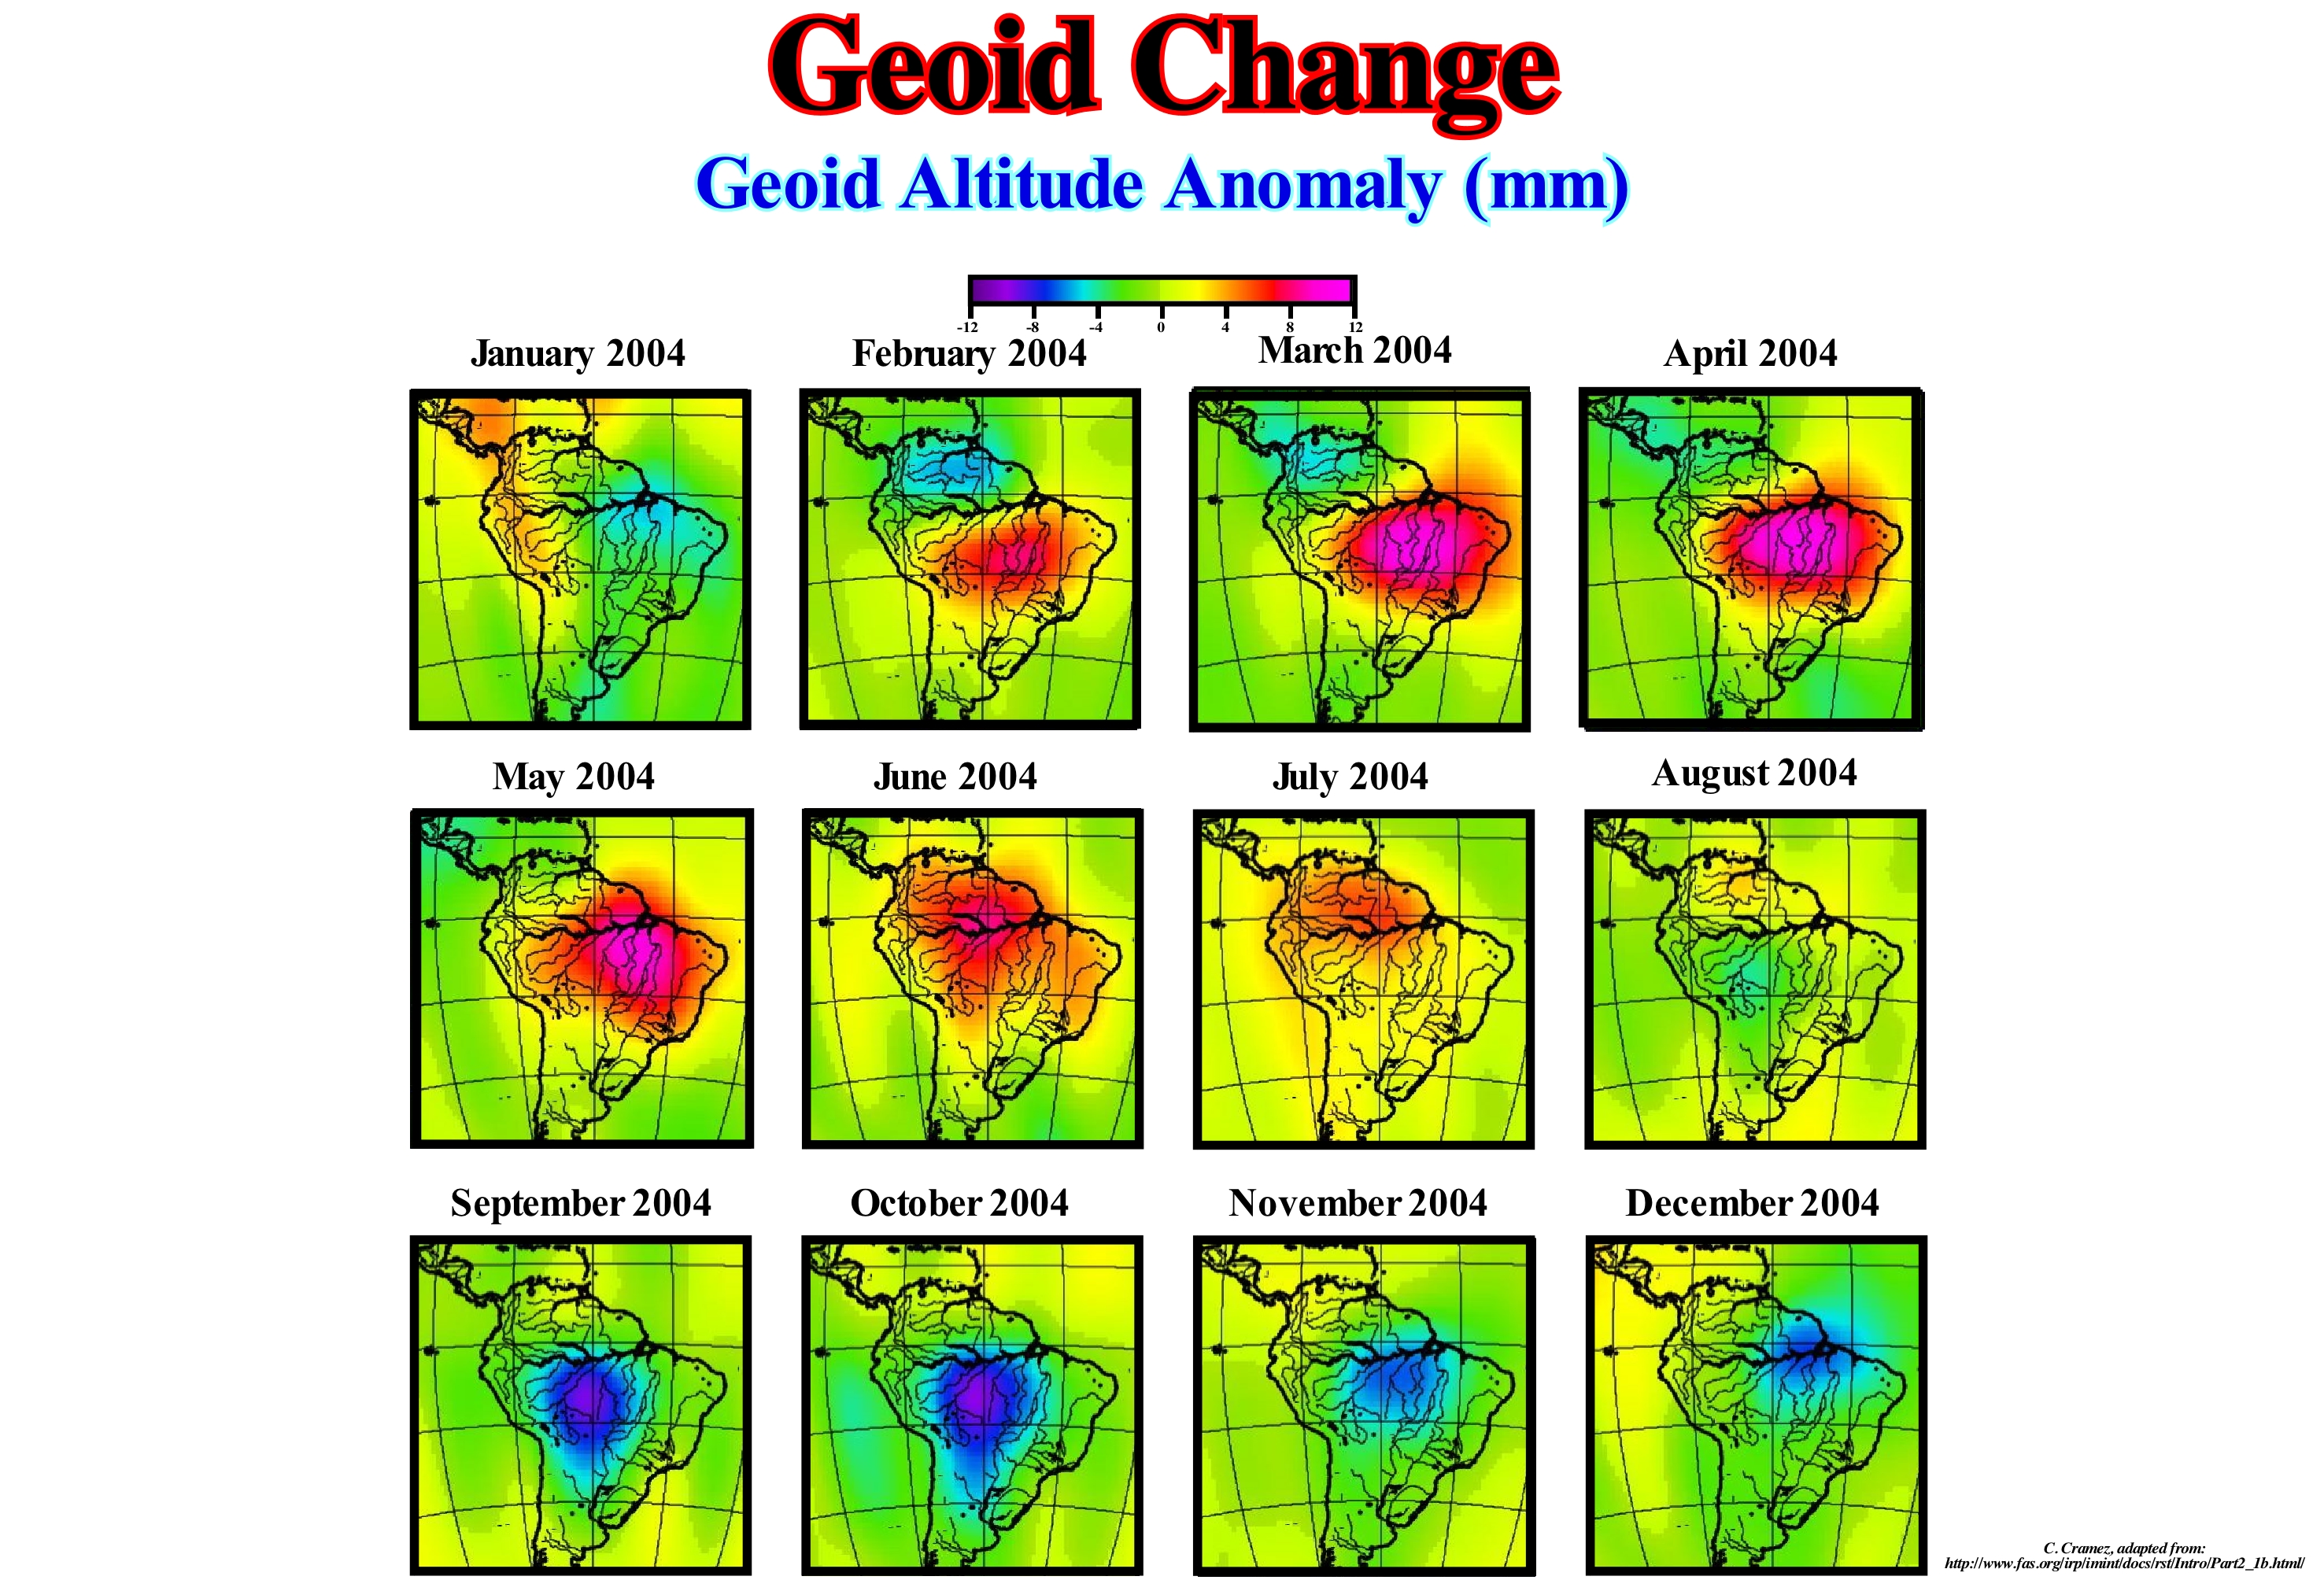
The Earth is wider around the equator than between the North Pole and the South Pole. It is similar to an ellipsoid or spheroid. The Earth's ellipsoid is a rough mathematical figure of Earth's shape, used as a reference frame for geodetic, astronomical, and geoscience computations. The geoid is a surface that is complex to describe mathematically but can be, easily, identified by measuring gravity. The geoid is considered to be roughly equal to the middle sea level*. In the oceans, the geoid and middle sea level are roughly the same. In continental areas they may be very different. The ground (true shape of the Earth) is given by topography and bathymetry. Ideally, the Earth should be a perfect sphere, composed of a single substance, homogeneously distributed and with a uniform density. In such conditions, gravity, when calculated from Newton's law, would be the same value at any point on the Earth's surface. In reality, Earth consists of three large concentric zones around the Earth’s centre (where all its mass is considered concentrated to calculate gravity): (i) Core, in which the inner part is solid and external liquid ; (ii) Mantle, which is where the density and distribution of the mass vary; and (iii) Lithosphere, which encompasses the upper mantle and the crust. The crust may be: (a) Oceanic, which has a composition, more or less, uniform and (b) Continental, which is very variable in thickness and has a heterogeneous composition. For these reasons, gravity on the Earth topographic surface varies from one place to another due to the differences in density within the Earth's mantle. The equipotential surface of gravity, closest to the middle sea level is the geoid. It is the reference surface for all measures of gravity. The surface of the geoid differs from the theoretical triaxial ellipsoid about +67 m (North Atlantic) and about -100 m (south of India). A boat sailing along an equipotential surface of gravity, between India and the North Atlantic rises about 167 meters, without spending energy. The images shown in this figure show the variations of GRACE gravity anomalies (Gravity Recovery and Climate Experiment) in the Amazon geographic basin of each month of 2004. Changes in the amount of water stored in the basin vary from month to month and can be monitored from space by the way the mass of water changes the Earth's gravity field. The red tones emphasize areas where the water mass is below average and blues where the mass is higher. The rainy season and the dry season are very noticeable in this images. In the Amazon region, between March and July, the geoid is higher than between September and December. The absolute (eustatic) sea level, which is the global sea level, referred to the Earth's centre depends on: (i) Geoidal-eustasy, which is controlled by the distribution of ocean water caused by the variations of the terrestrial gravity field ; (ii) Steric sea level rise or thermal expansion of the oceans, which is controlled by the increase in the temperature of the oceans (if the temperature increases, the density of the water decreases and, for a constant mass, the volume increases) ; (iii) Glacio-eustasy, which is controlled by the volume variation of ocean water), (iv) Tectono-eustasy, which is controlled by the volume variation of the ocean basins). However, for many geoscientists, absolute sea level can not be neither global nor uniform. Any cause of sea level affects, also, the terrestrial geoid. If this is true, no eustatic curve is valid globally. During the melting of the ice caps, in response to the load of water added to the ocean basins, the absolute (eustatic) sea level will be depressed, and in response to the removed charge (where the ice caps melted), the continent will be lifted. The redistribution of the material inside the Earth is affected by the overload and it will enhance the variations of the surface of the ocean (induced by gravity anomalies) and thus further redistributions of water will be required to attempt to equalize gravitational potential. This continuous retroactive gravitational process between the ice caps, oceans and the mainland is the process that, at the end, determines the signature of relative sea level, which is observed everywhere the continent and the ocean meet. Only glacial changes are both important (> 10 m) and fast (<1 m).
(*) Sea level varies greatly in time and space (distance). It is affected by tides, wind, atmospheric pressure, local gravity differences, temperature, salinity, subsidence, etc. To determine the "middle sea level", the best thing to do is to choose place and calculate the middle sea level at that place and use it as a reference point. Generally, from hourly observations, made over a long period of time (about 30) years, it can be calculated to be mean for that measurement point. As a rise in sea level (relative or absolute) is perhaps the most familiar effect of climate changes and, probably, the one with the most consequences, it is important to specify what sea level is taken into account (eustatic, relative, middle sea level, high-tide sea level, etc.) and how it was calculated.
Geoid Heigh..............................................................................................................................................................................................Hauteur du géoïde
Altitude geodésica (diferença geoidal) / Altura del geoide / Geoid Höhe/ 大地水准面高度 / геоида высота / Altezza del geoide /
Difference between the orthometric altitude (vertical distance of a point on the Earth's surface relative to a reference geoid) and the ellipsoidal altitude (vertical distance of a point on the earth's surface relative to a reference ellipsoid), i.e., the difference between the geoid and ellipsoid.
See: « Geodetic Sea Level »
Geoidal-Eustasy........................................................................................................................................................................Eustasie géodésique
Eustasia geodésica / Eustasia geodésica / Geodätische eustasy / 大地eustasy / Геодезическая эвстазия / Geodetic eustatismo /
Geodesic variations of the sea level, i.e., variations of the distribution of the water of the oceans, caused by the variations of the field of terrestrial gravity. The sea level is not the same at all points of the Earth. It is, more or less wavy, due to variations in the force of gravity. The sea level corresponds to an equipotential surface similar to the geoid, which emphasizes the level of the geodetic sea. Changes in sea level can be caused either by changes in the eustatic level or by geodesic changes in sea level (geodesic-eustasy or geoidal-eustasy). A large accumulation of ice on the Earth's surface, for instance, causes variations in the Earth's gravitational field, which affect the shape of the geoid and thus sea level. A large mass, such as the Antarctic ice cap, produces a gravitational pull of sea level, which causes a rise in local sea level near it.
See « Relative Sea Level Change »
&
« Eustasy »
&
« Geoid »
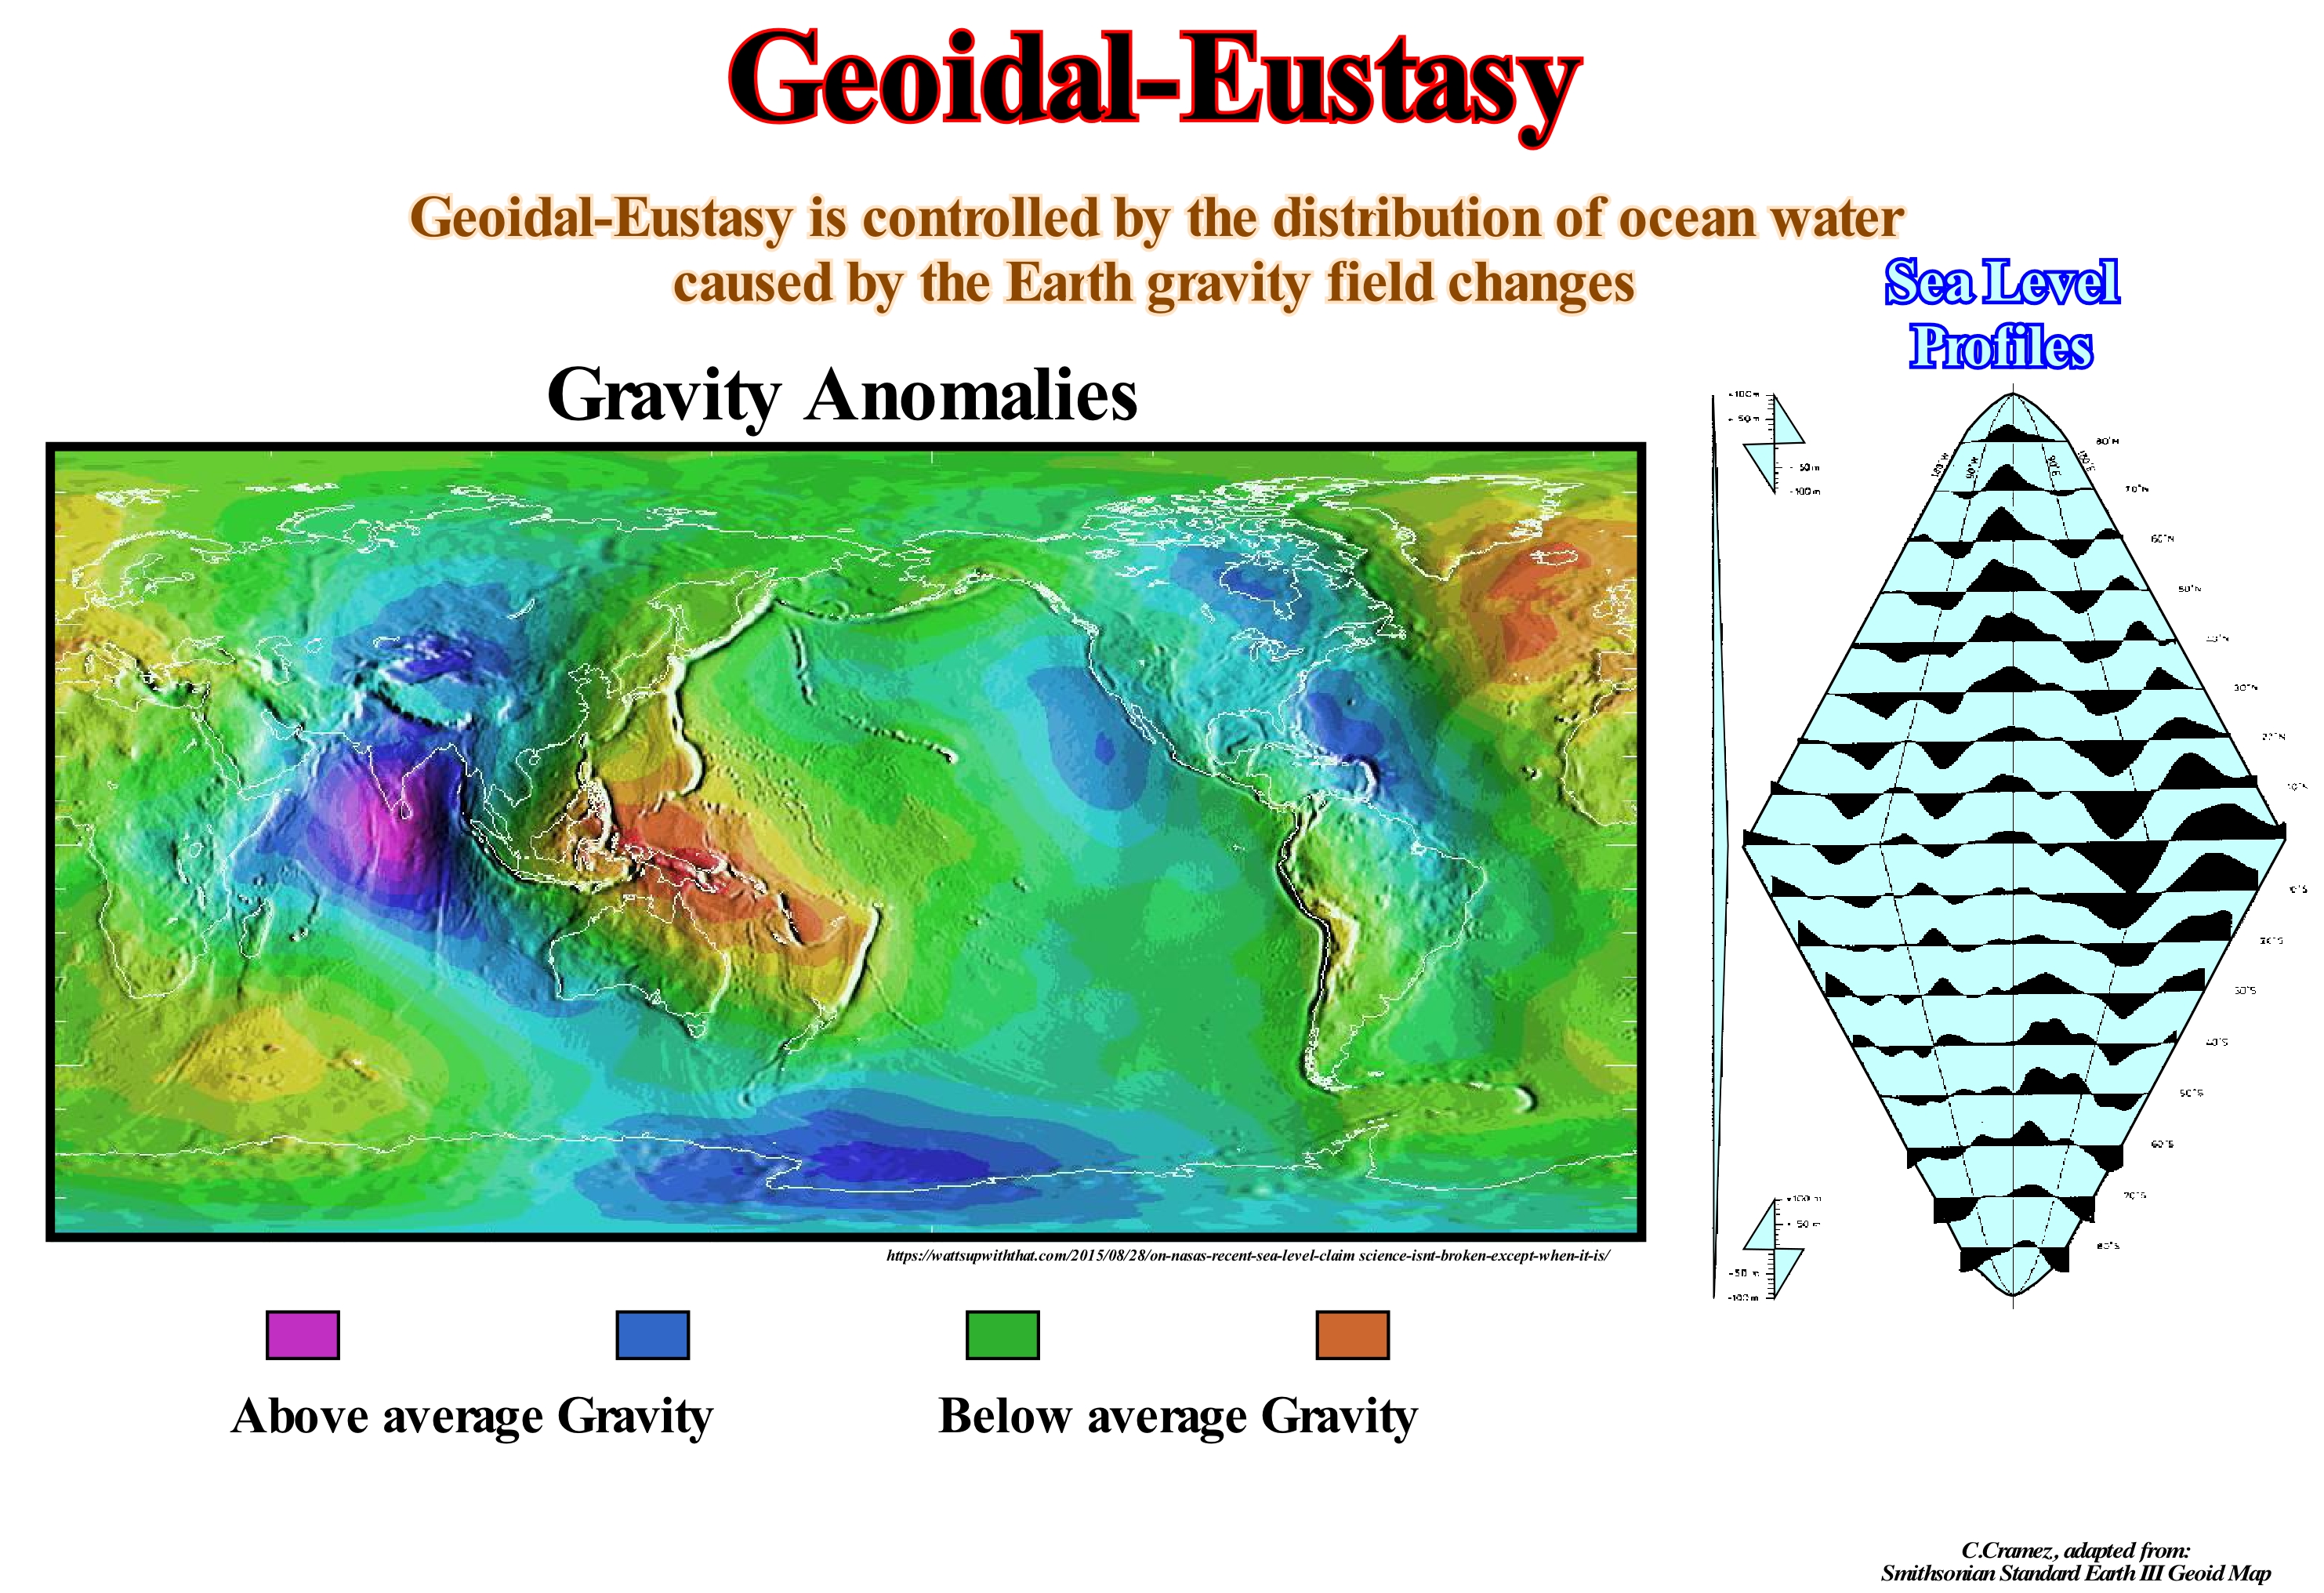
As illustrated on these profiles (Smithsonian Standard Earth Geoid Map III) and on the map of gravity anomalies, sea level shows important irregularities with very high and low values. That means that sea level, contrary to a very accepted idea, is not flat. On these profiles, the amplitude of the undulations is exaggerated by a factor of 100,000 with respect to the radius of the Earth. The high values (where sea level is higher) correspond to areas of the Earth where the force of gravity is below normal. In the same way, when the values of the force of attraction are high, the sea level is low. This results from the fact that the Earth's material is not distributed, neither uniformly nor in layers, perfectly, concentric. If this were so, the geoid (the equipotential surface that would give the average surface of the oceans, if they were in equilibrium, without movement and continue under the continents) it would coincide with the Earth's surface. Between the areas where sea level is high, such as near New Guinea and the areas where it is lower than normal, such as in the Seychelles, there is a difference of about 180 meters. A boat sailing between these two areas, along an equipotential surface of gravity, would not consume energy. Not only is the present configuration of the geoid is not stable, but it changes with the variations of gravity and factors controlling it through geological time (lateral variations of gravity anomalies are related to the anomalies of the density distribution within the Earth). However, do not forget that: (i) Earth is wider at the equator than between the North Pole and the South Pole ; (ii) Earth resembles to an ellipsoid or a spheroid and (iii) Geoscientists work, generally, with four surfaces: (a) The Earth ellipsoid, which is an approximate mathematical figure of the shape of the Earth used as a reference frame for geodesic, astronomical and geosciences computations ; (b) The geoid, which is difficult to describe mathematically, but which can be easily identified by measuring gravity ; (iii) The middle sea level, which is, roughly, coincident with geoid in the oceans, but not in continental areas ; (iv) The ground, which is the true shape of the Earth and is given by topography and bathymetry. In sequential stratigraphy, eustatic changes have to take account of local variations induced by gravity anomalies. An absolute (eustatic) sea level fall of 50 m, for example, may in some place create lowstand geological conditions while, in another area, the sea level will be above the basin edge. As stated above, the sea level is not levelled, large elevations and depressions exist in association with gravity anomalies and other factors. The main causes of absolute (eustatic) sea level changes, (referenced to the Earth's centre), are: (i) Glacio-eustasy, which is controlled by changes in the volume of water of the oceans, due to glaciations and deglaciations* ; (ii) Tectono-eustasy, which is controlled by changes in the volume of the oceanic basins, which are induced by the Wilson cycles (rupture and aggregation of supercontinents) ; (iii) Geoidal-eustasy, which is controlled by the distribution of ocean water caused by variations in the Earth gravity field, and (iv) Thermal expansion of the oceans or steric sea level rise (if the ocean temperature increases, density of the water decreases and, for a constant mass, the volume increases). Glacio-eustasy and tectono-eustasy are eustatic variations, which are sometimes considered, globally, uniform. However, for many geoscientists, they can not be neither global nor uniform. Any cause of sea level also affects the Earth geoid. If this is true, no eustatic curve is valid globally. During the melting ice caps, in response to the load of water added to the ocean basins, the sea level will be depressed and in response to the removed loading (where the ice caps have melted), the continent will be uplift. Redistribution of material within the Earth is affected by overloading, which will further enhanced ocean surface variations (induced by gravity anomalies), and more water redistributions will be required to attempt to equalize gravitational potential. This continuous retroactive gravitational process between the ice caps, oceans and the continent is the process that, at the end, determines the signature of the absolute sea level, which is observed everywhere the continent and the ocean meet. Note that only glacial changes are both important (> 10 m amplitude) and fast (<1 m).
(*) Just as a glaciation is, more or less, an ice age (glacial period ), during which glaciers form, it may be called deglaciation at the melting age, during which the glaciers are melted. The melting water, which ends up in the sea, contributes to the absolute (eustatic) sea level changes.
Geoindicator (Environment)..............................................................................................................................................................Géoindicateur
Geoindicador / Geoindicador (ambiente) / Geoindicator, Geologische Indikator / 地质指标 / Геоиндикатор / Indicatore geologico /
Measurement of the magnitude, frequency, rat, and trend of geological processes and phenomena occurring on or close to the Earth, subject to changes that are significant for understanding environmental changes over periods of 100 years or less. Geoindicators help to focus attention on the causes of climate change, whether they are anthropogenic or not. Among other areas, where geoindicators can be used, effectively, are national park management, coastline management, assessment of the environmental impacts of the extractive industry, identification of public health problems, etc.
See: « Geological Change »
Geological Change...................................................................................................................................................................Changement géologique
Mudança geológica / Cambio geológico / Geologische Veränderungen / 地质变化 / Геологические изменения / Cambiamento geologico /
Modification of the subsurface and terrestrial surface by geological processes, such as tectonics, erosion, deposition, extraterrestrial collision, etc.
See : « Erosion »
&
« Plate Tectonics Theory »
&
« Depositional Model (sand-shale) »
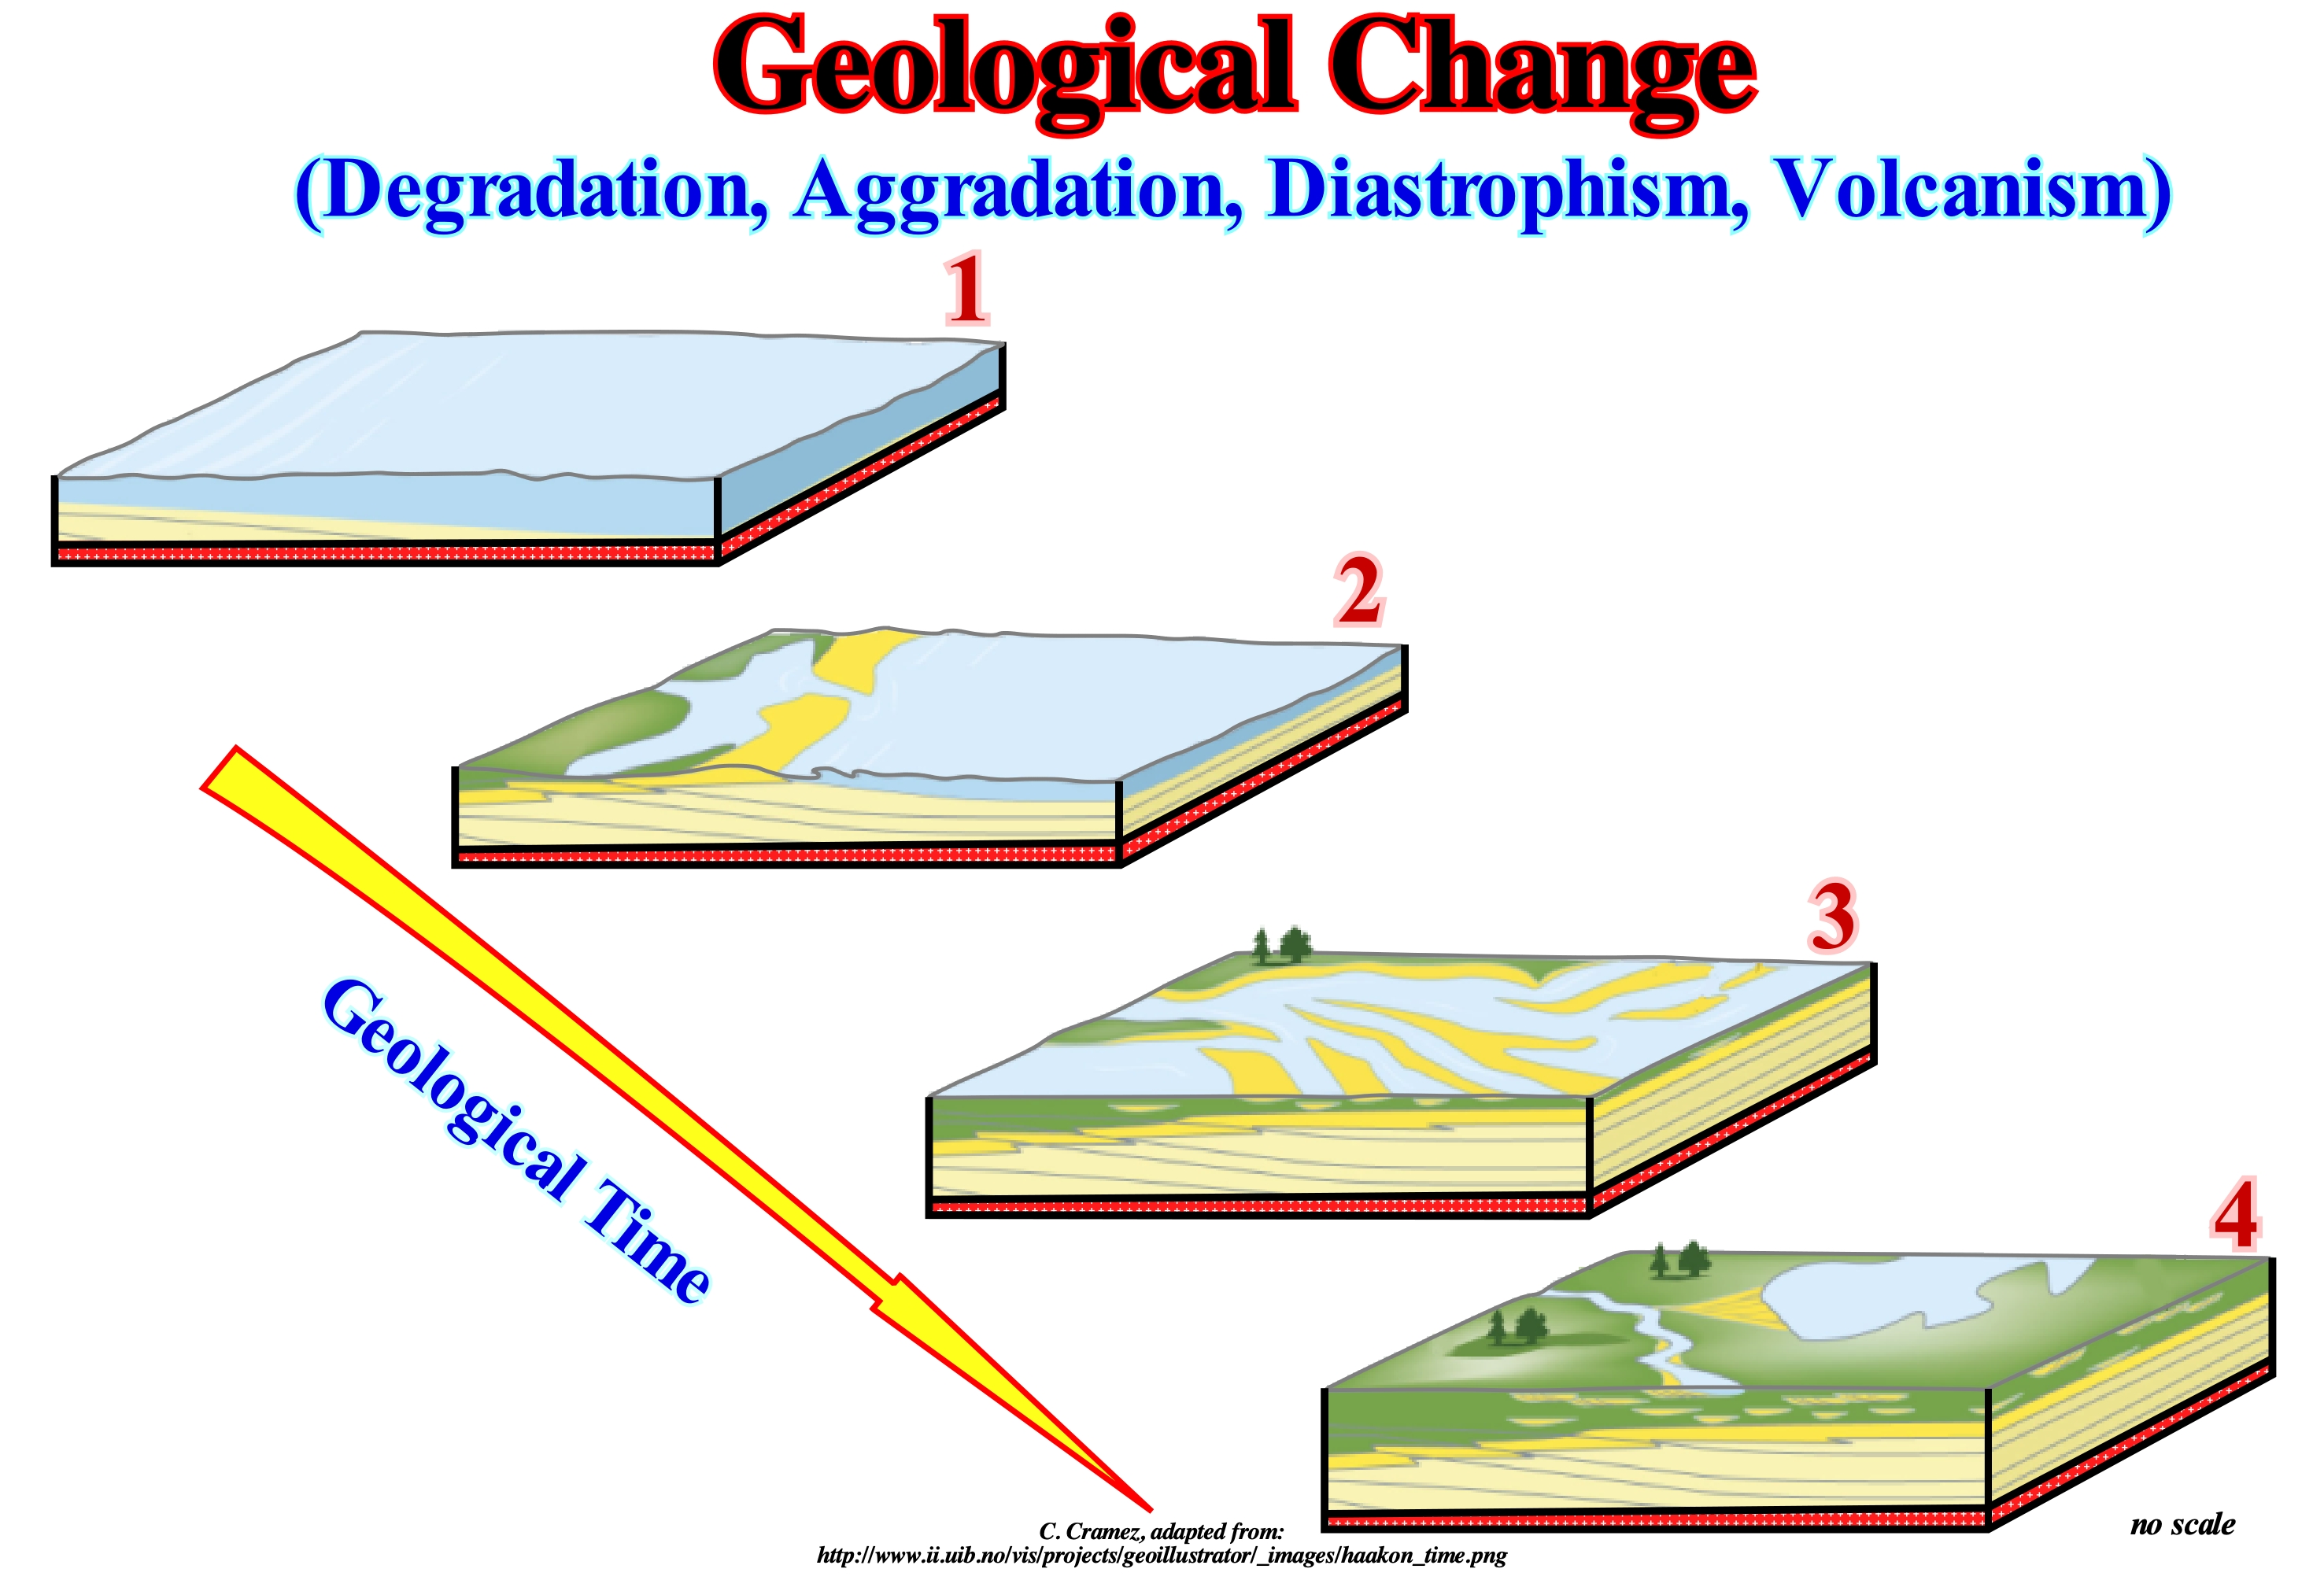
Since its origin, about 4.5 billion years ago, Earth has undergone numerous geological changes. Despite the apparent stability, the continents are constantly moving, causing certain mountain belts to appear and others disappear. The Earth, is constantly changing. The continents and the oceanic crust, i.e., the lithosphere is drifting, over a sea of rocks, more or less liquid (asthenosphere). The amount of water, in all its forms, has been constant since the formation of the Earth. However, the volume of the oceanic basins changes, which creates significant variations in absolute (eustatic) sea level*, producing important displacements of the shoreline and associated coastal sediments. Sedimentary transgressions** collectively move the shoreline and coastal deposits continentward. Sedimentary regressions, on the other hand, displace the shoreline and coastal deposits seaward. All these geological phenomena are very slow and usually go unnoticed. The average velocity of ocean expansion, for example, is, on average, equivalent to the growth rate of a humans nails, that is, about 1 to 5 centimeters per year. In other words, sea floor spreading it is imperceptible. However, in a million years, oceanic expansion reaches around 50 kilometers which, geologically, is important. Although many geological processes can be seen to work within the period of a normal human life, rapid abiotic changes in landscapes are often neglected in the assessment of ecosystems. Natural disasters such as earthquakes, floods and volcanic eruptions attract much attention. There are other geological processes that can change in a decade or less and strongly influence the physical and chemical environment. These include changes in coastlines, erosion of sediments and soils, karstification, frozen soil activity, as well as variations in groundwater quality. A practical summary and description of these and other parameters of the physical and chemical landscape is presented in the concept of geoindicator, which has been advanced mainly to explain the importance of rapid geological changes to those responsible for environmental planning and management when they are not geoscientists. A geoindicator measures of magnitude, frequency, rates and trends of geological processes and phenomena occurring on or near the Earth's surface subject to changes that are significant for the understanding of environmental changes over periods of 100 years or less. Geoindicators help to focus attention on the causes of change whether they are anthropogenic or not. Among other areas where geoindicators can be applied, we can mention the management of national parks, the management of the coastlines, the evaluation of the environmental impacts of the extractive industry, the identification of public health problems, etc. The geological changes are directly associated with the concept of geological events proposed by Gretener, who classified them according to their frequency. A geological event that occurs, more or less, every 100 years is considered a regular event, while an event that occurs every thousand years is considered a common event. Thus, earthquakes occurring in a given region around 200-300 years, such as earthquakes in the region of Lisbon and Agadir (Morocco), should be considered as regular geological events. The Lisbon earthquake of 1755 (force 8.7 and 9 degrees on the Richter scale), whose epicentre was southwest of the Algarve region, some 300 kilometers from Lisbon, was preceded by the Lisbon earthquakes in, 1531, 1344 and 1009. Similarly, the 5.9-magnitude earthquake that occurred in 1960 in the Agadir region was preceded by a strong earthquake in the same region that occurred in 1731. In the same way, in sequential stratigraphy it can be said eustatic cycles of the 3rd order, whose time-duration varies between 0.5 My and 3-5 My, are, according to the Gretener classification, considered common geological events. On the contrary, orogenies should be considered as occasional to rare geological events. Their duration varies between tens and hundreds of millions of years (Caledonian orogeny between 660 Ma to 540 Ma, Hercynian orogeny between 385 Ma and 280 Ma, Alpine orogeny between about 40 Ma and 10 Ma).
(*) Global sea level referenced to the Earth's centre.
(**) Transgressions is the name given to the set of increasingly important marine ingressions and associated sedimentary regressions, which are increasingly smaller and smaller. Transgressions or to avoid misunderstandings, sedimentary transgressions are the result of a vertical stacking of smaller and smaller sedimentary regressions that, globally, have a retrogradational geometry. Sedimentary regressions is the name given to the set of increasingly smaller marine ingressions and associated sedimentary regressions increasingly important. The set of sedimentary regressions has a progradational geometry.
Geological Cross-Section..........................................................................................................................................Coupe géologique
Corte geológico / Corte geológico / Geologischer Schnitt / 地质剖面 / Геологический разрез / Sezione geologica /
Diagram showing the structure and arrangement of rocks as they would appear in a vertical plane below the Earth's surface.
See: « Geological Map »
&
« Seismic Line »
&
« Stratigraphy »
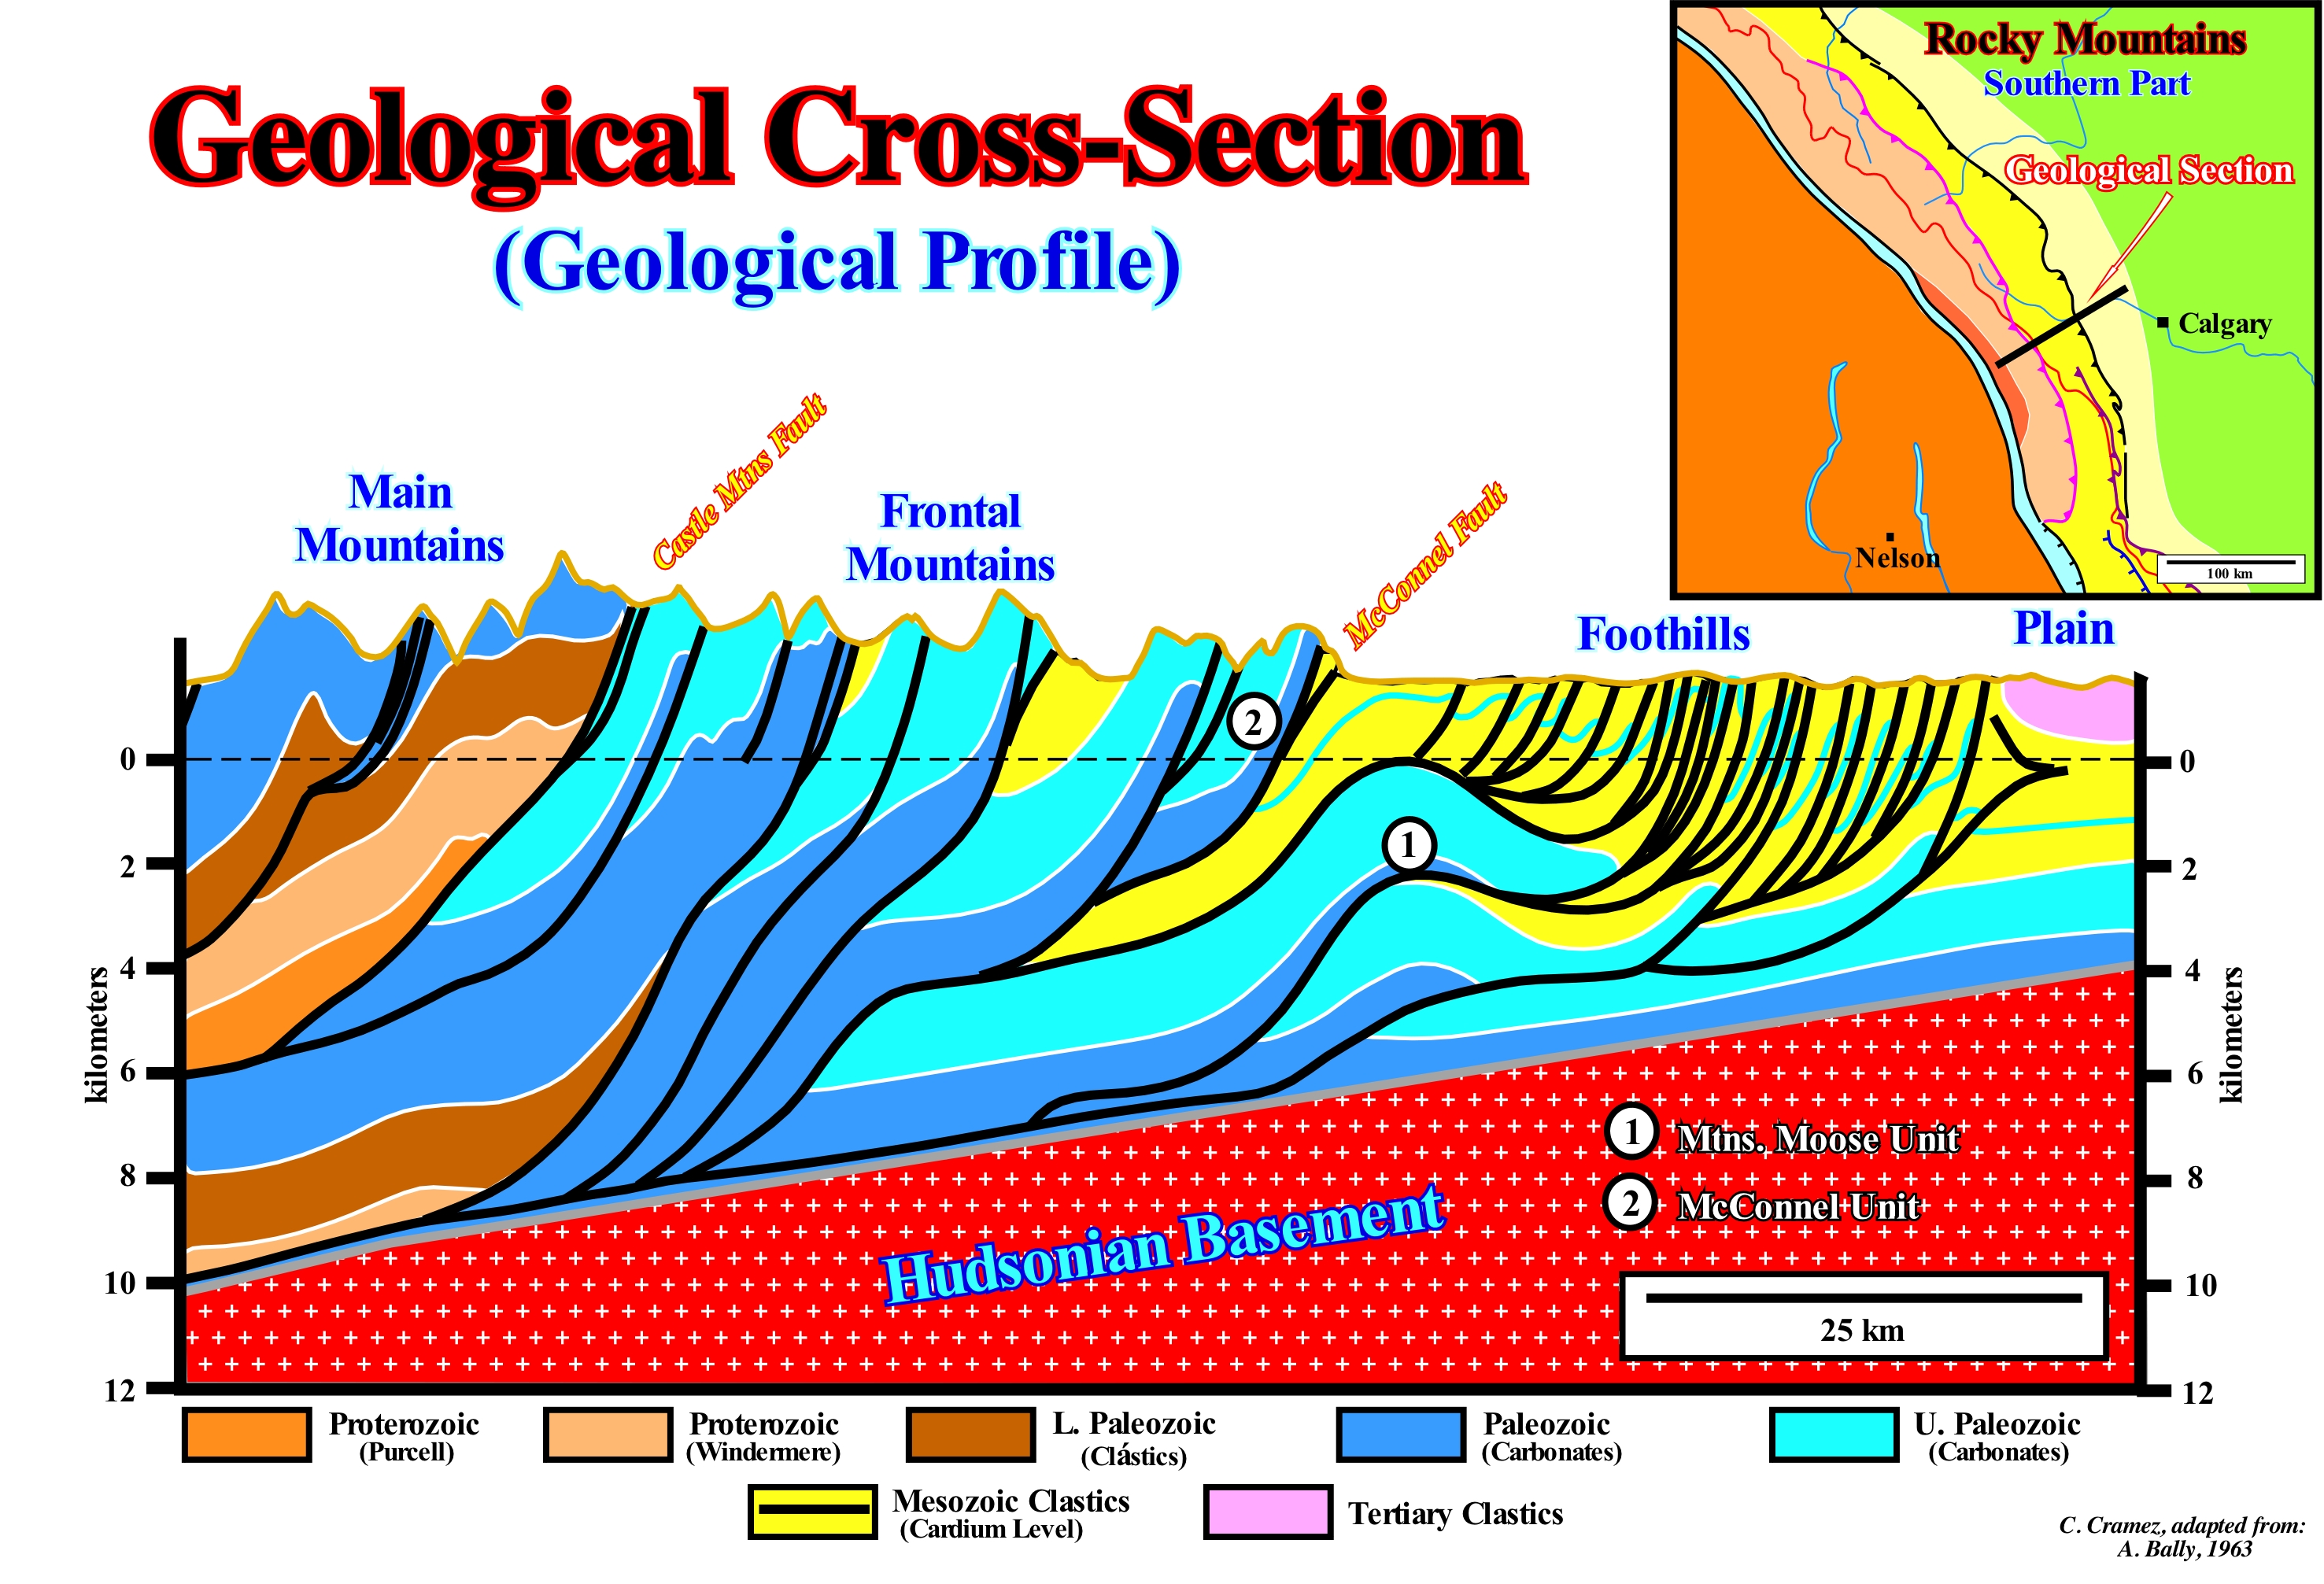
First, never confuse a geological section with a tentative geological interpretation of a seismic line. The scales (vertical and horizontal) of a geological section are metric, which is not the case on a tentative interpretation of a seismic line. In general, unless the seismic line is in depth, the vertical scale is in time (double time). The depth of a geological interface depends, fundamentally, on the velocity with which the seismic waves cross the overlapping sedimentary intervals. Similarly, in the vast majority of cases, geological sections, for obvious reasons, are not drawn at the natural scale of geology (the scale of nature), that is, 1:1. They are almost always anamorphized. The vertical and horizontal scales are different which has important implications in the geological interpretation. Suppose, for instance, an anticline, perfectly, concentric and isopachous in the field (scale 1: 1). If it is represented in a geological section, with a vertical scale is 5 times bigger than the horizontal scale, the anticline will appear very elongated with a thickness at the apex much larger than in the flanks. He is no longer isopachous and a non-attentive observer may even think that the apex represents the more subsident part of the basin. In this geological section, whose vertical exaggeration is about 2 times de horizontal scale, the structure and arrangement of the different sedimentary packages are easy to recognize. The sedimentary shortening is, largely, post-sedimentation. The Hudsonian basement is not involved in deformation. The Paleozoic carbonate sedimentary packages were shortened by a series of thrust faults and over them (right end), there is an envelope of Mesozoic imbrications (many imbrications were certainly cut off by the Moose Mountain thrust(1). As the displacement of theMesozoic clastics of the Cardium formation, for example, exceeds, greatly, the displacement of the frontal thrusts, this implies that the Moose Mountain thrust (1) cut the Mesozoic layers before the more eastern thrusts had formed.
Geological Map.....................................................................................................................................................................................Carte géologique
Mapa geológico / Mapa geológico / Geologische Karte / 地质图 / Геологическая карта / Carta geologica /
Distribution of the geological characteristics of an area such as the different types of rocks, faults, etc. Generally, a geological map is made on top of a topographic map (base map) so people can locate on the map. The base map is usually printed in light colors so as not to interfere with the colors of the geological map, since, on the map, geology is represented by geological colors, lines and symbols. The perception of these characteristics allows an understanding of the geology of the mapped area.
See: « Geological Cross Section »
&
« Stratigraphy »
&
« Formation (geological) »
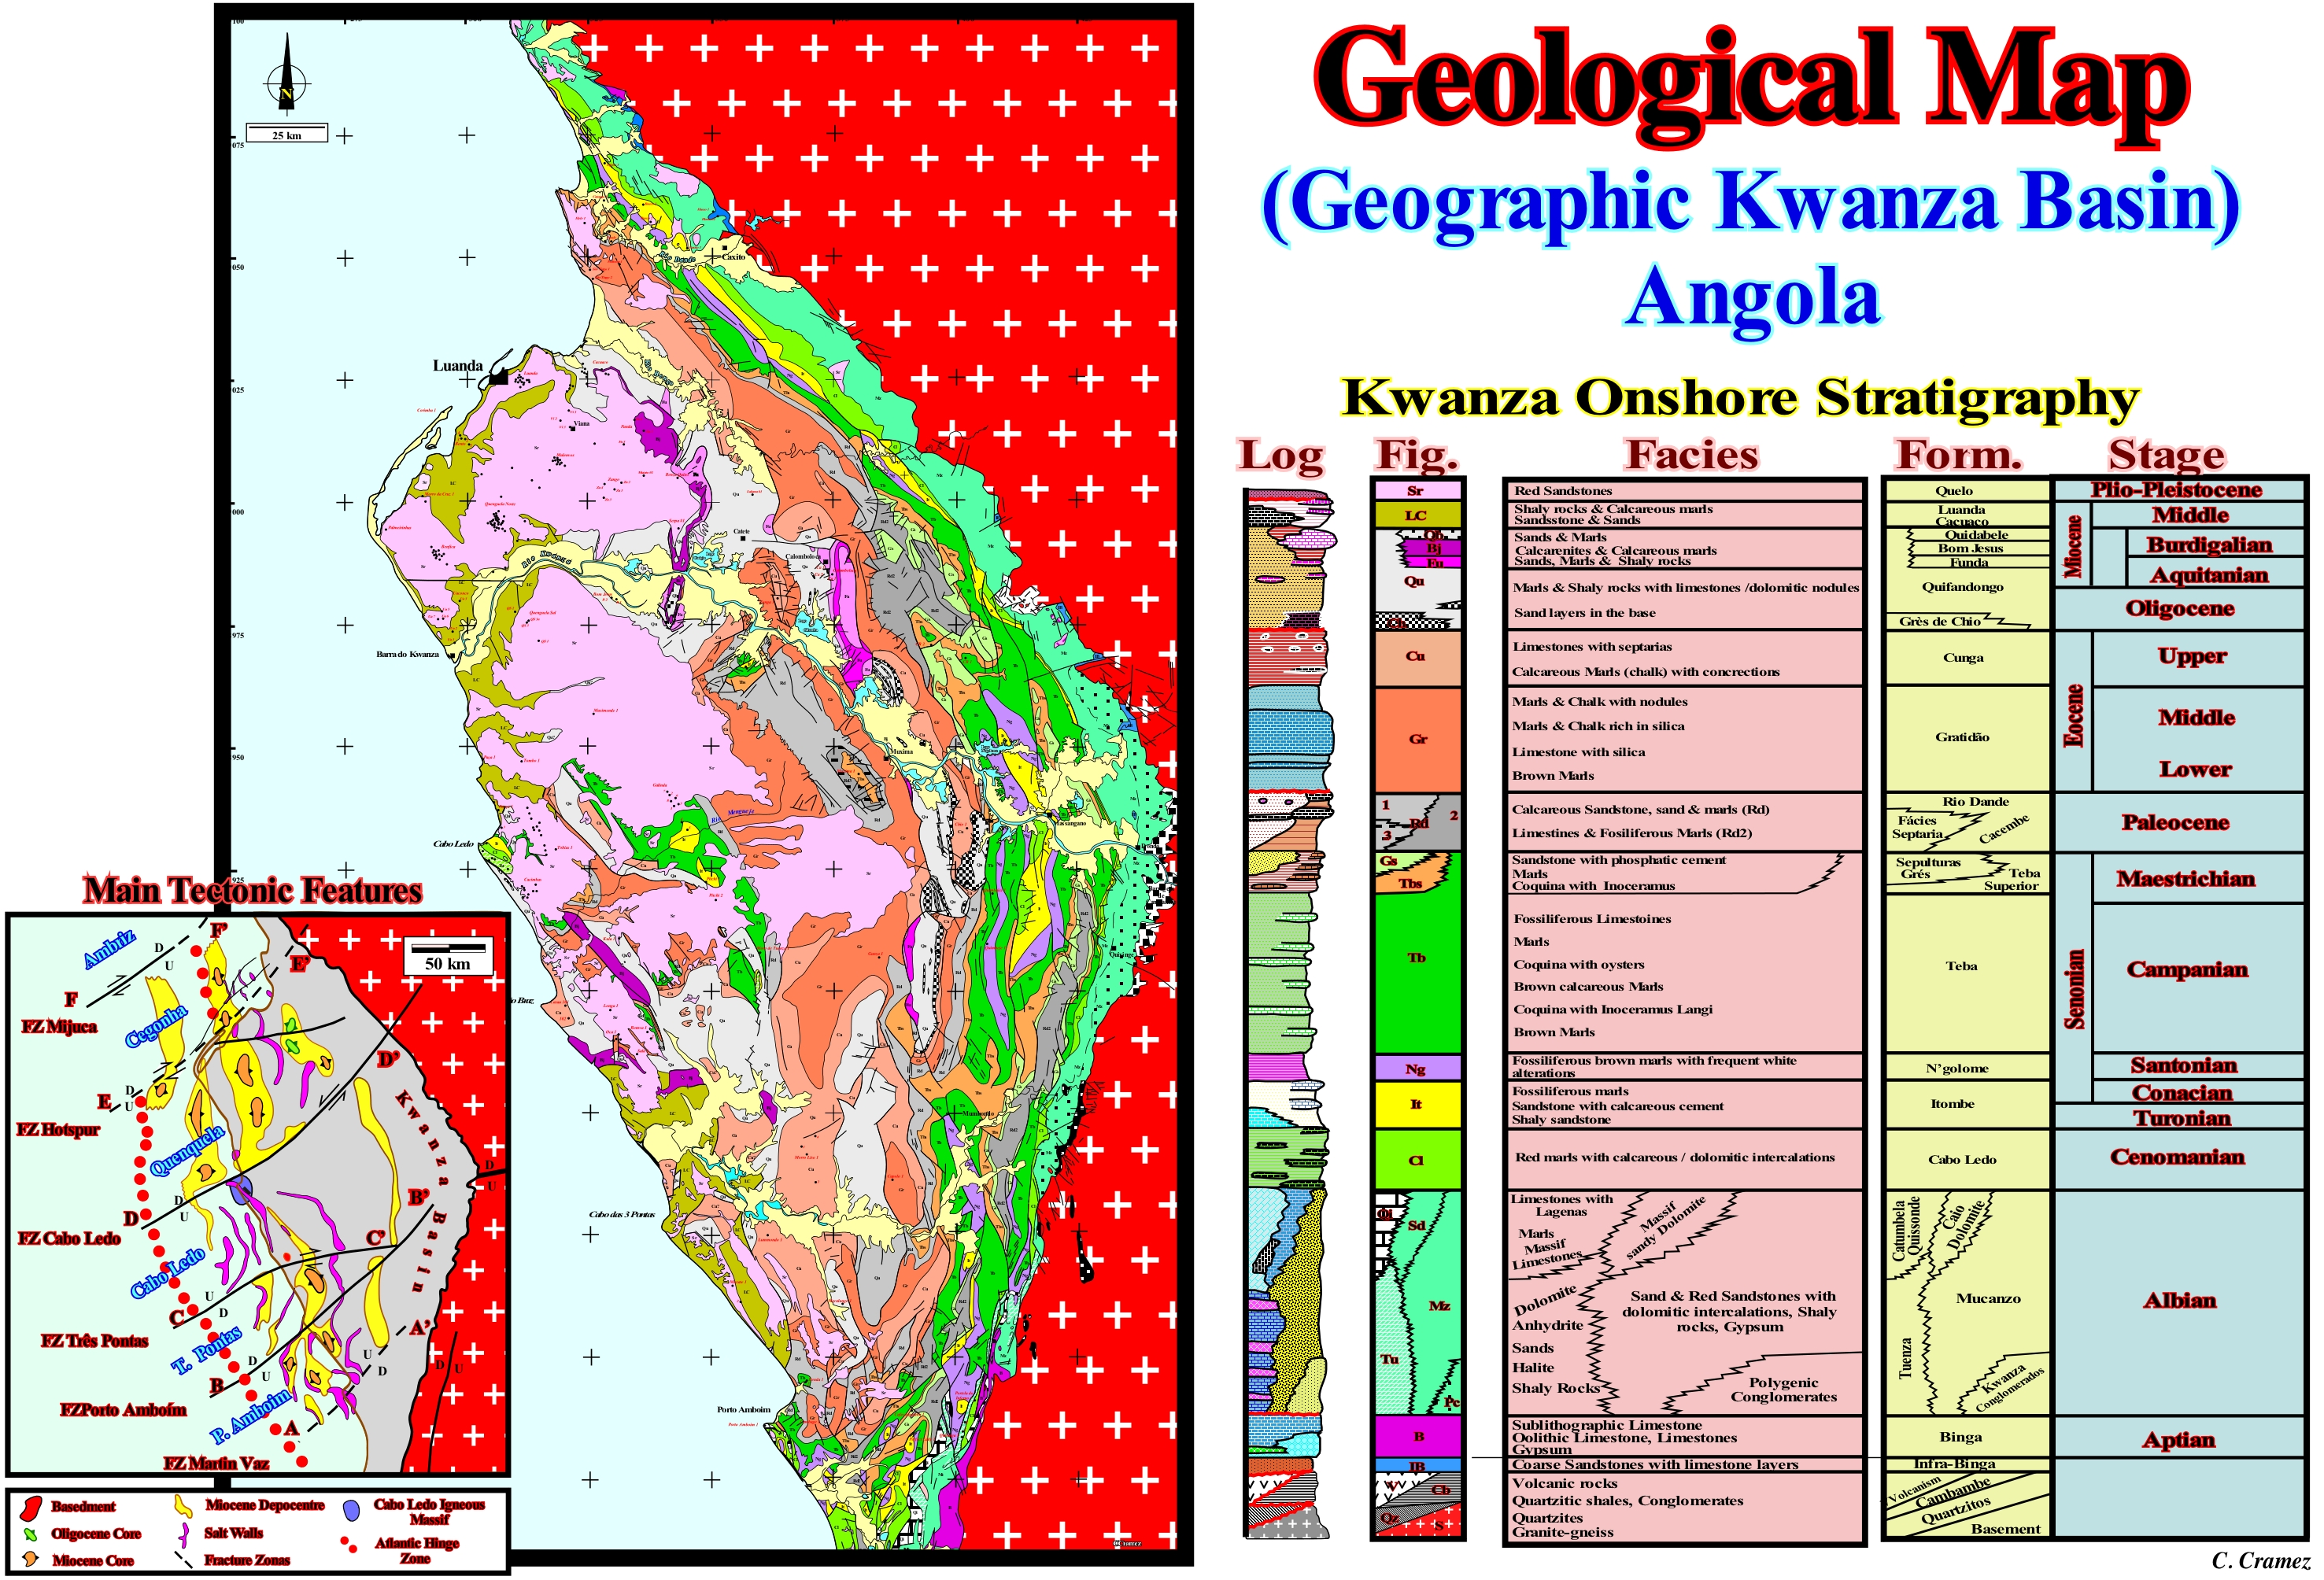
On this geological maps, each colour represents a geological formation. This map was made in the late 60's by the geoscientists of the CFP (Total CAP), which is now called Total SA in which I spent about 40 years. It was dome before the advent of sequential stratigraphy. The base map, which was constructed from field data on the base of the aerial's photographs of the time, allows a location with an error of, more or less, 100 meters. The geometric relationships between the bedding planes and the internal configurations of the different sedimentary packages are not represented. The great majority of the unconformities and structures (extensional), as well as the structural behaviour of the beds, i.e., of the strike and dip allowing define the depicted structures. All the mapped structures are extensional. In this area, apparently, there are no anticlines, synclines or inverse faults (exception made for the structures of Cabo Ledo area, where a gliding of the salt overburden produced, locally, a compensation compressional tectonic regime). All structures are antiforms, synforms and normal faults, what implies a sedimentary lengthening. Such a lengthening of the sediments was induced by differential subsidence, which created the rift-type basins (usually half-grabens) and by thermal subsidence during the Atlantic-type divergent margin developed after the Gondwana break-up. Salt tectonics and, particularly, halokinesis (evaporite flowing without tectonic stresses) contributed to the lengthening of the sediments, which, in certain areas, exceeded more than 30% of the original extent (at the time of deposition).
Geological Model.......................................................................................................................................................................Modèle géologique
Modelo Geológico / Modelo geológico / Geologische Modell / 地质模型 / Геологическая модель / Modello geologico /
Conjecture or geological assumption that can satisfactorily explain a number of geological observations.
See: « Geological Principle »
&
« System »
&
« Geological Cross Section »
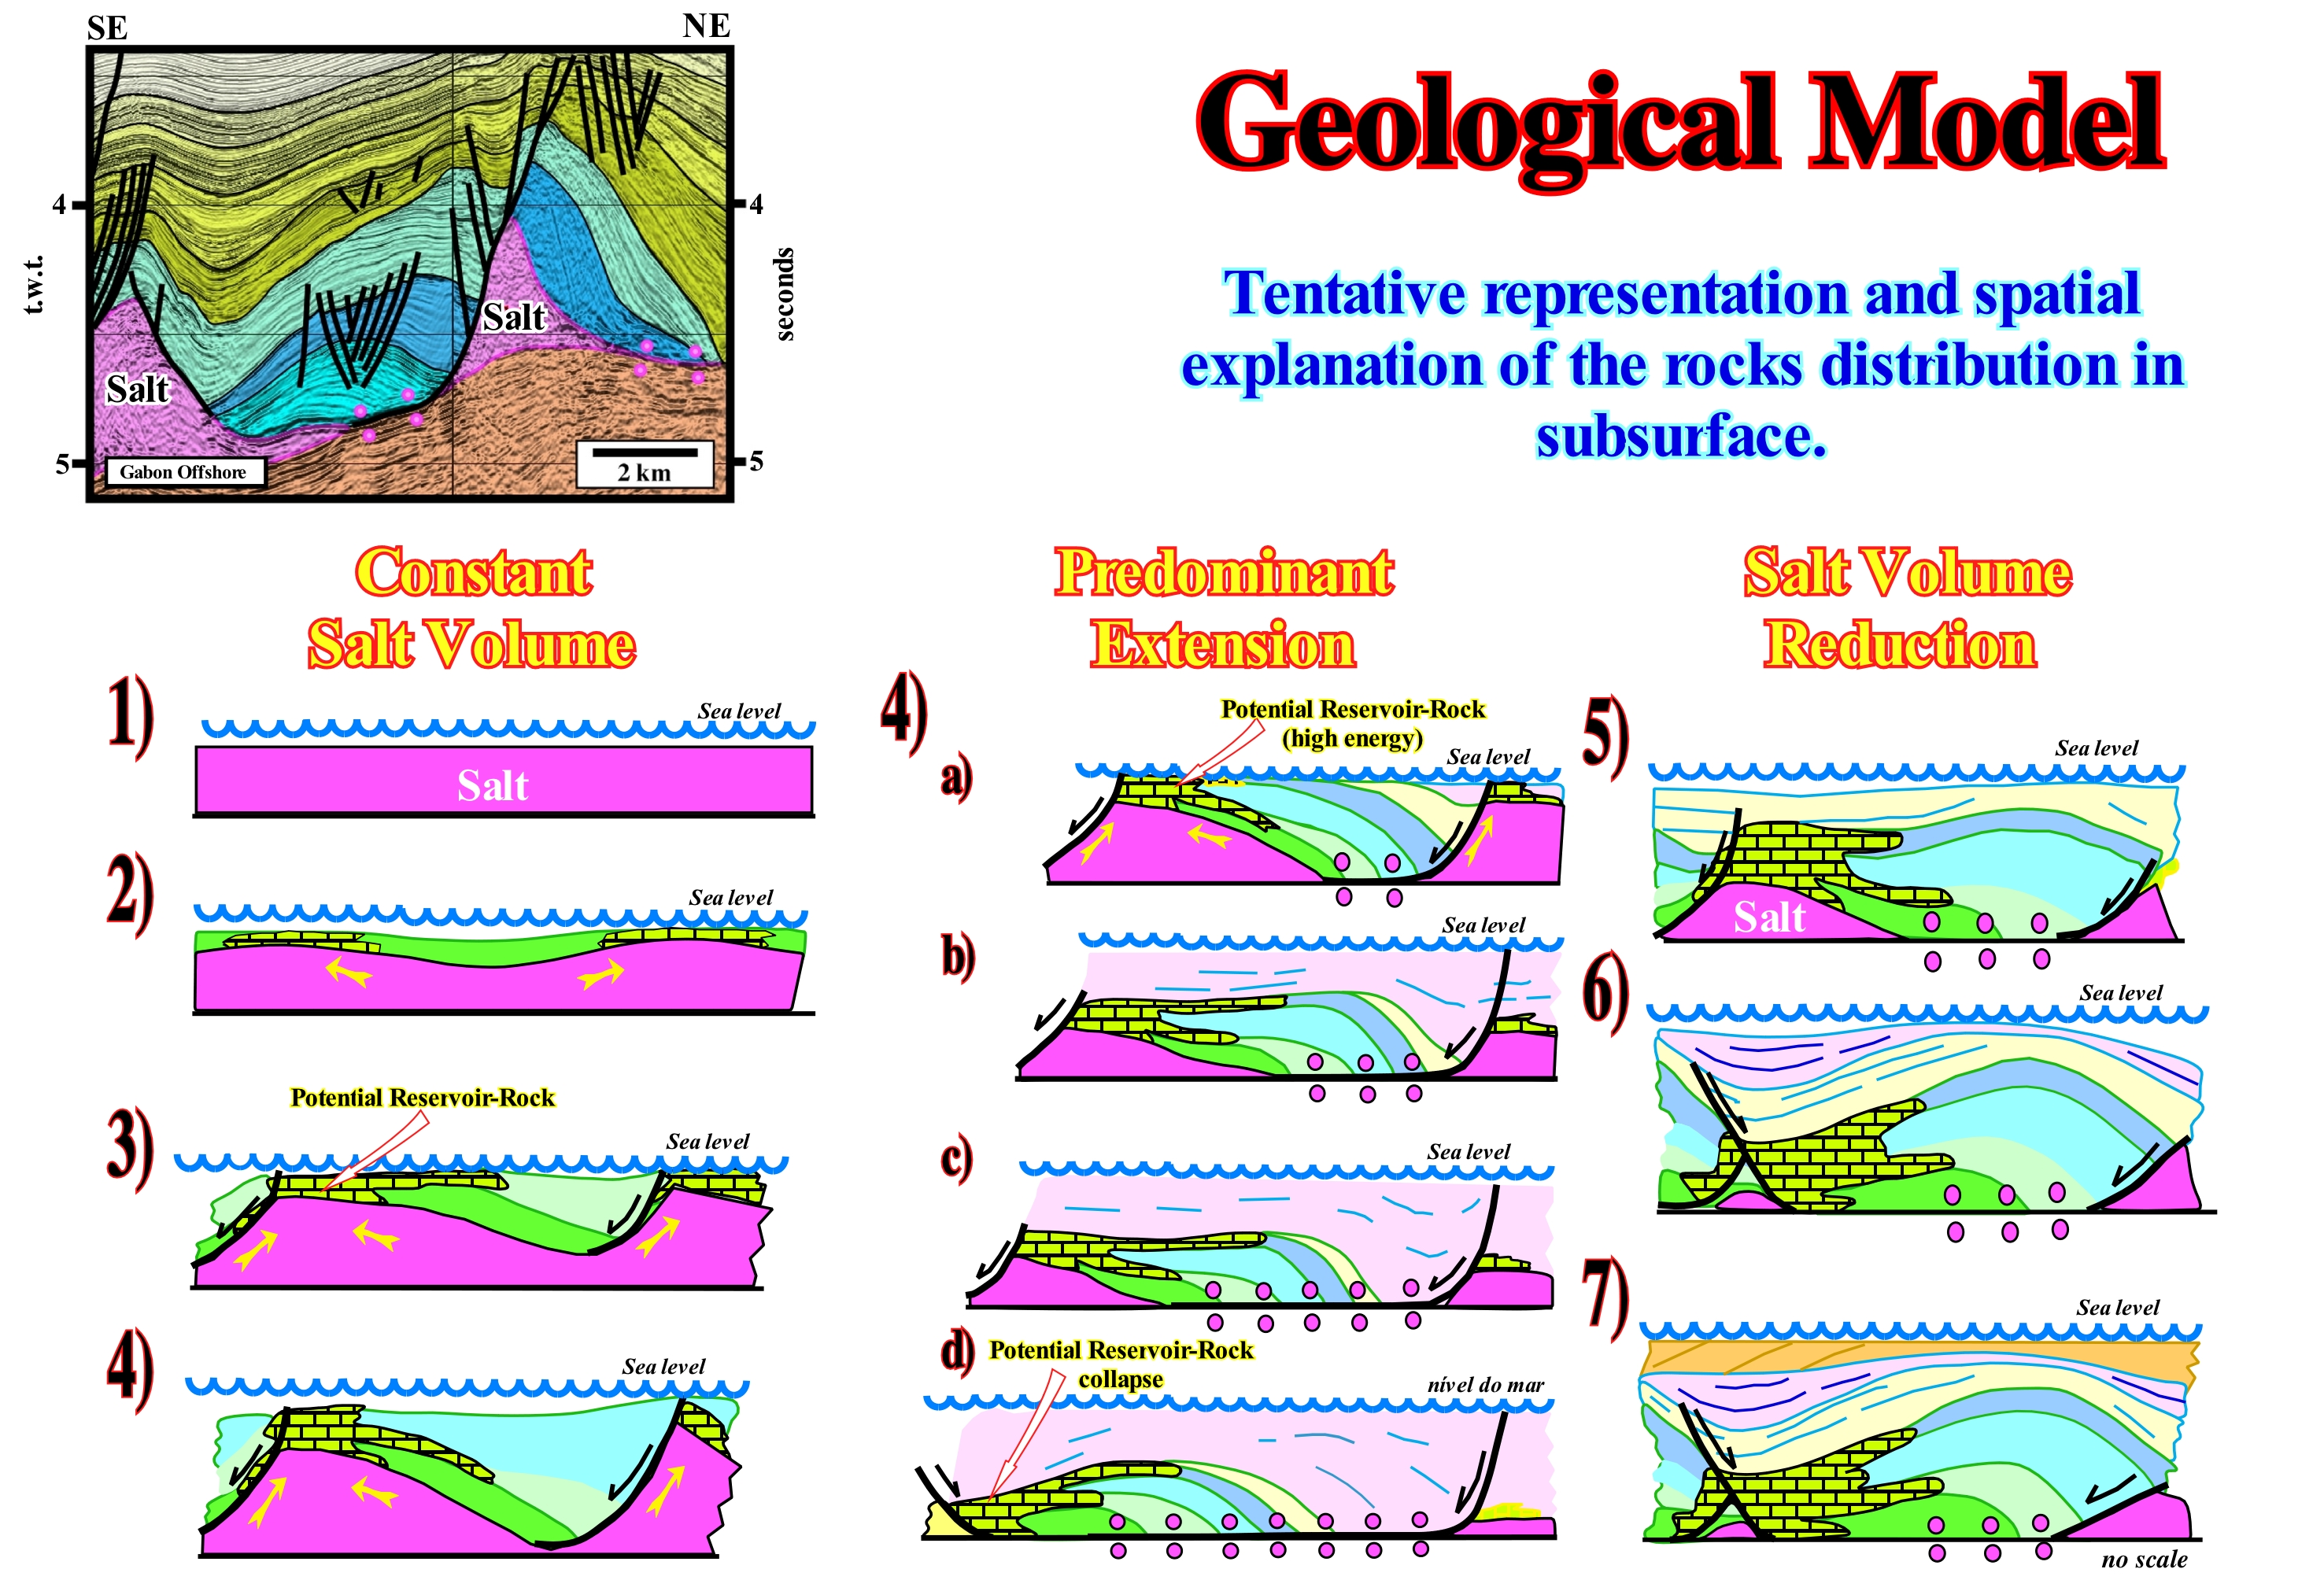
It is important to note that a geological model, such as that illustrated on this figure, has nothing to do with a geological theory, such as Plate Tectonics Theory. Unlike the current usage of the term theory, the formal scientific definition of a geological model corresponds to a mere speculation or a geological guess. A hint or geological conjecture, which can be tested, is what geoscientists call a geological model or hypothesis. A geological theory is anything much more important. It corresponds to a set of coherent geological hypotheses, tested by evidence and reasoning, with a great explanatory power. It explains a great number of observations (field, subsurface, seismic, etc.). Similarly, a geological fact, such as "this rock is a reservoir-rock", can be defined as a statement that is well supported by evidence, reasoning and observations. In this way a geoscientist can not forget that in the definition of geological theory (group of interconnected statements) there are three important aspects of the statements or hypotheses: (i) They have to be based on observations or evidence ; (ii) They have to be based on reasoning and logic and (iii) They have to be coherent and internally consistent. In the example illustrated in this figure, geoscientists using seismic data made a number of observations: (a) Normal curved faults that flattened in more or less continuous salt sutures ; (b) Presence of a salt wedge on the footwall at the bottom of the normal fault plane ; (c) Antiform structures with an anhydrite core and porous carbonate (rock-reservoir) in the outer envelope and (d) A shaly cover with a divergent internal configuration toward the fault. Taking into account these observations, that can be considered as geological facts, the geoscientist advanced a hypothesis or geological model (sketch in the bottom right of the figure), which theoretically explains the observations. The proposed geological model is, among all possible models or hypotheses, the most difficult to refute.
Geological Period....................................................................................................................................................................Période géologique
Período geológico/ Período geológico / Geologischen Periode / 地质时期 / Геологический период / Periodo geologico /
Time unit, on the geological time scale, which is smaller than that of an Era and greater than an Epoch. The Tertiary period, for instance, is the first Cenozoic Era and includes, among others, the Eocene Epoch.
See : « Eon »
&
« Geological Time »
&
« Geological Time Scale »
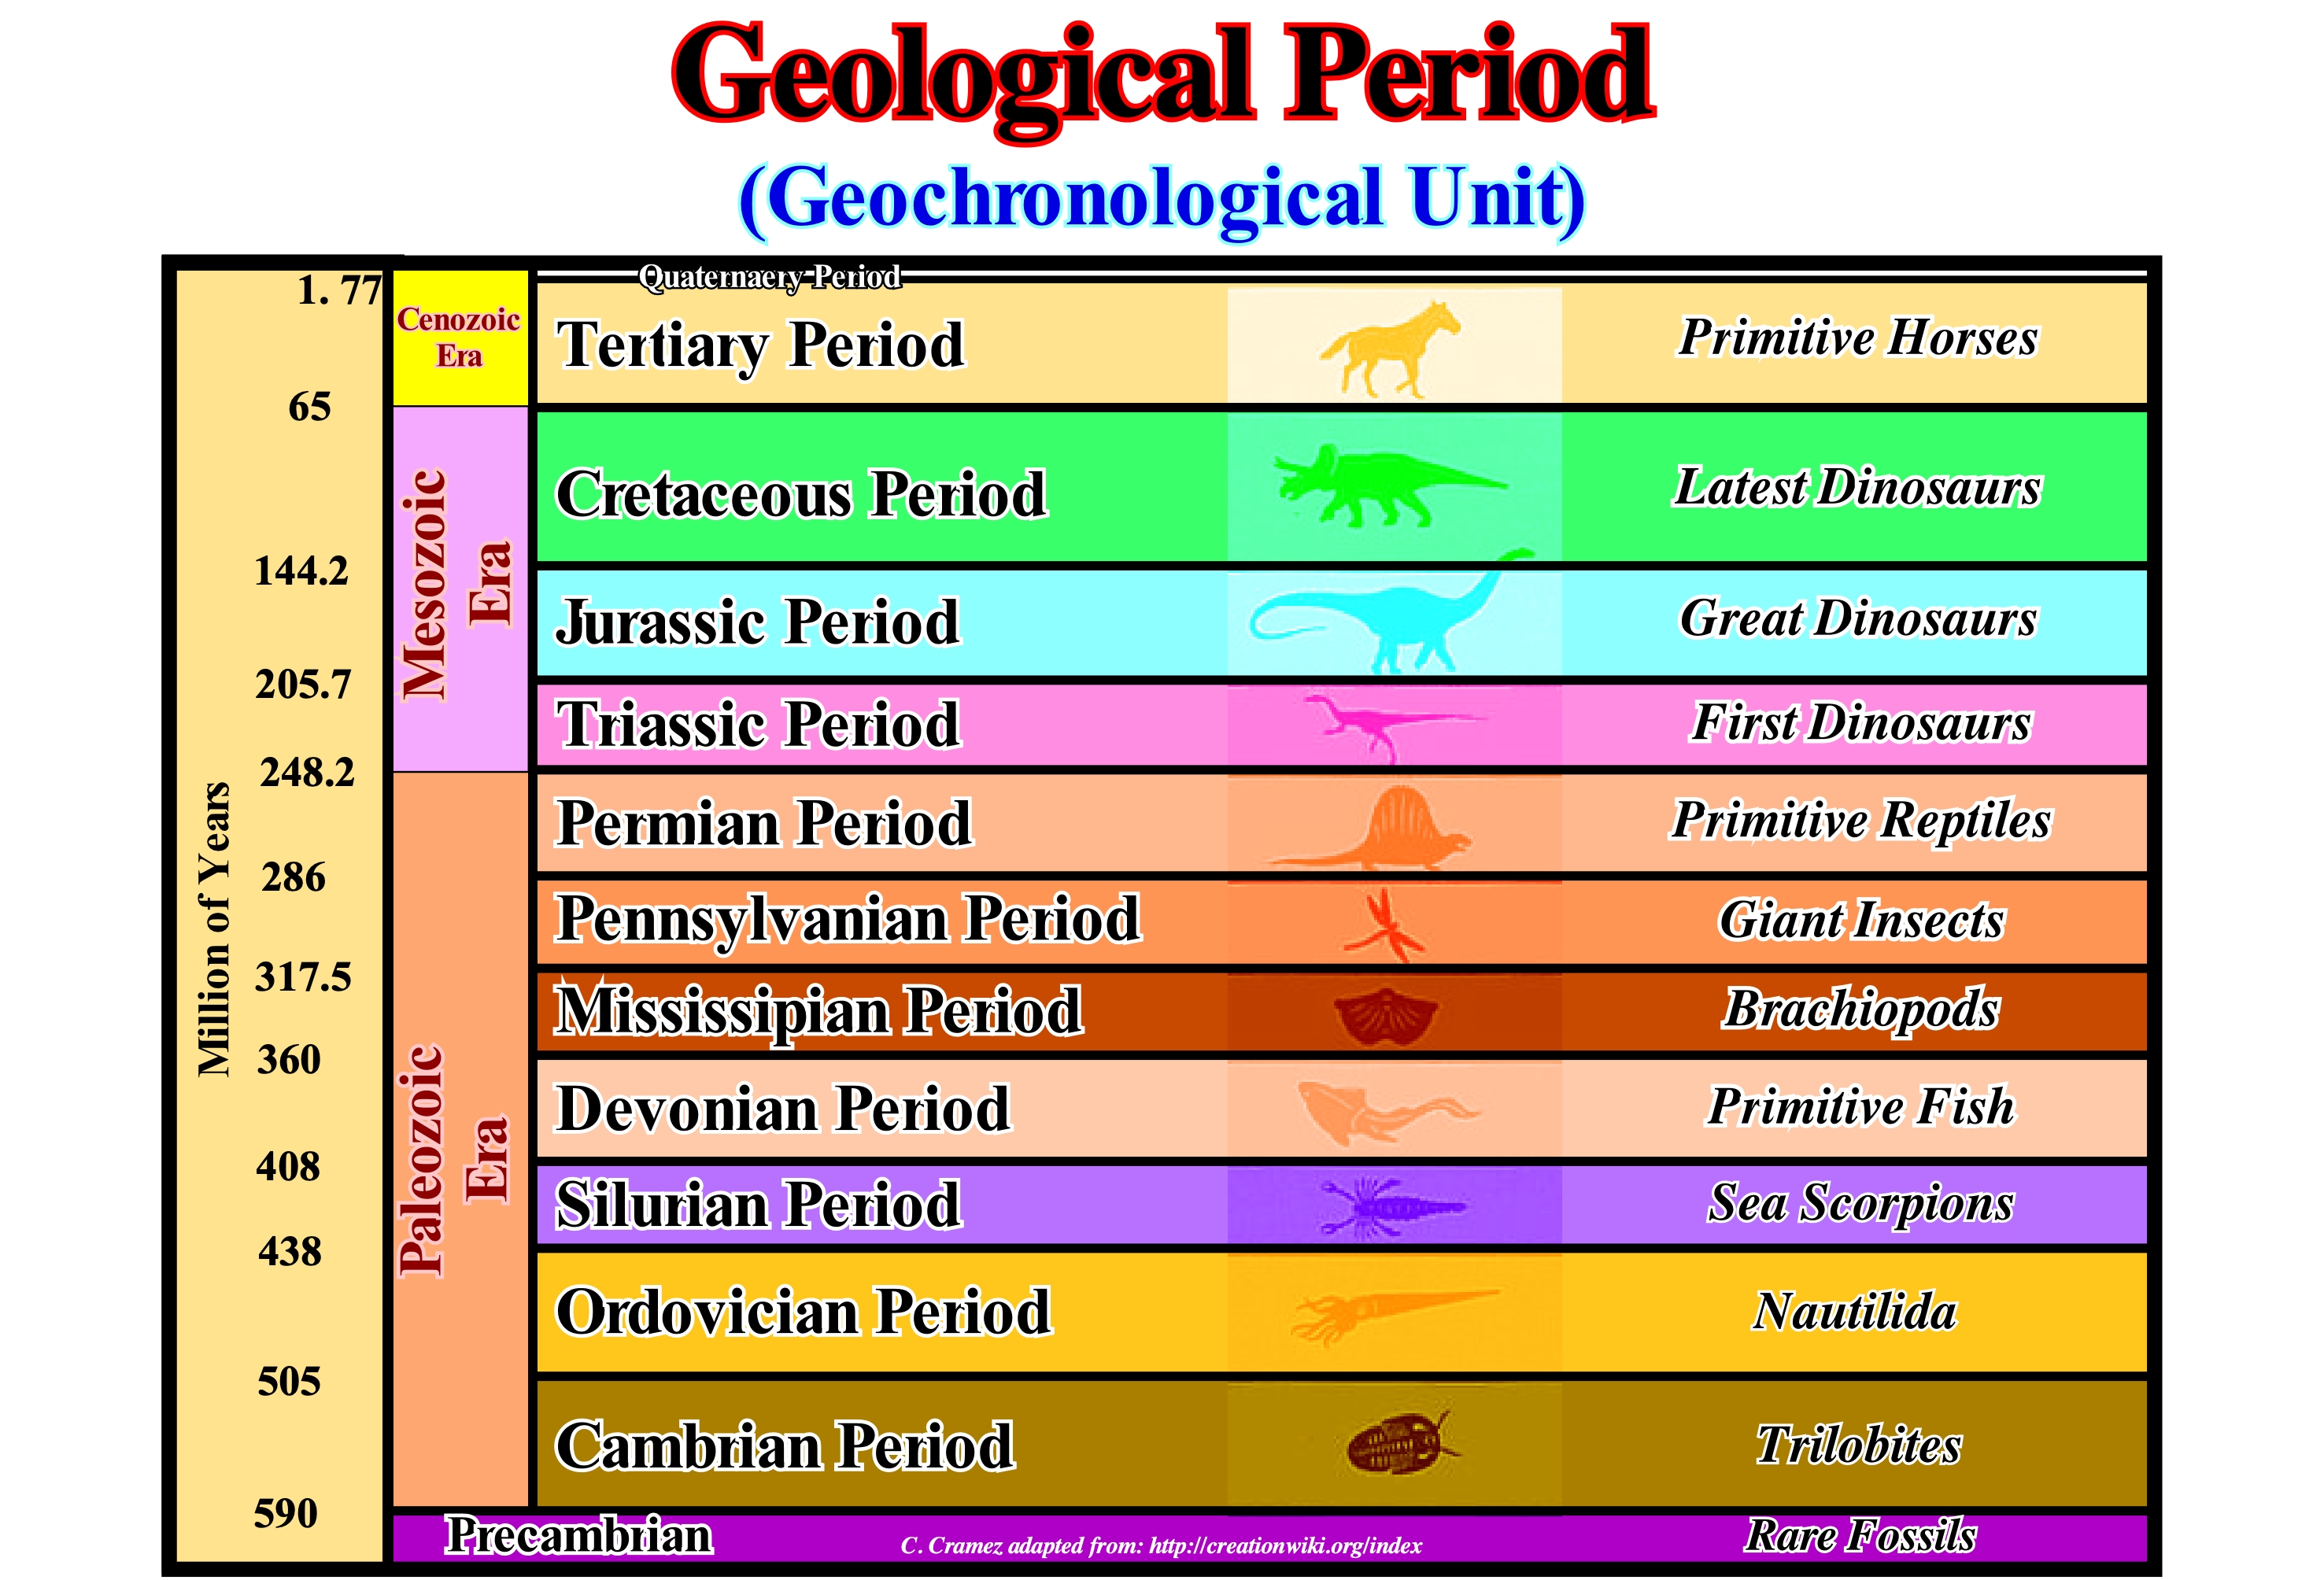
In this figure all the geological periods of the Phanerozoic are indicated (it is present eon in the scale of the geological time, during which there is an abundant animal life). Within the Phanerozoic (0 - 590 Ma) can be considered three Eras: Paleozoic (248.2 - 590 Ma); Mesozoic (65 - 248.2 Ma) and Cenozoic (0 - 65 Ma). In the Paleozoic Era there are seven periods: (i) Permian (248.2 - 286 Ma), which is the time of the primitive reptiles ; (ii) Pennsylvanian (286 - 317.5 Ma), which is the time of the giant insects ; (iii) Mississippian (317.5 - 360 Ma), which is the time of the brachiopods ; (iv) Devonian (360-408 Ma), which is the time of primitive fish ; (v) Silurian (408 - 438 Ma), which is the time of the sea scorpions ; (vi) Ordovician (438 - 505 Ma), which is the time of the nautiloids and (vii) Cambrian (505-590 Ma), which is the time of the trilobites. In Europe, geoscientists group the Pennsylvanian and the Mississippian in a single Carboniferous Period. In the Mesozoic Era, three periods are considered: (a) Triassic (205.7 - 248.2 Ma), which is the time of the first dinosaurs ; (b) Jurassic (144.2 - 205.7 Ma), which is the time of the great dinosaurs and (c) Cretaceous (65 - 144.2 Ma), which is the time of the last dinosaurs. In the Cenozoic Era there are two periods: (A) Tertiary (1.77-65 Ma) which is the time of primitive horses and the Quaternary (0 - 1.77 Ma) which is the time of men. Many geoscientists consider two sub-periods within the Tertiary: (1) Neogene (1.77 - 23.8 Ma) and (2) Paleogene (23.8-65 Ma). The Quaternary Period is, by many geoscientists, included in the Neogene. Do not confuse the geochronological units, such as a Period, which are units of time, with the chronostratigraphic units, which represent the sets of rocks, which were deposited during the geochronological units, such as the Jurassic system. The rocks deposited during the Cretaceous period form the Cretaceous system. When a Series (chronostratigraphic unit) is subdivided use Lower, Middle and Upper, the geochronological unit equivalent, are, i.e. the Time, is divided into Initial, Middle, Late.
Geological Principle......................................................................................................................................................Principe géologique
Princípio geológico / Principio geológico / Prinzip geologischen / 地质原则 / Геологический принцип / Principio geologico /
One of the many principles or hypotheses used by men of science to make the Earth's history understandable, i.e., the geology. All the geological hypotheses are based on the three fundamental principles, taken from the physical and chemical laws of Nicolas Steno. Over time, such principles, like any other scientific hypothesis, have been refuted and thus improved by successive modifications.
See: « Geological Time Scale »
&
« System »
&
« Geological Cross Section »
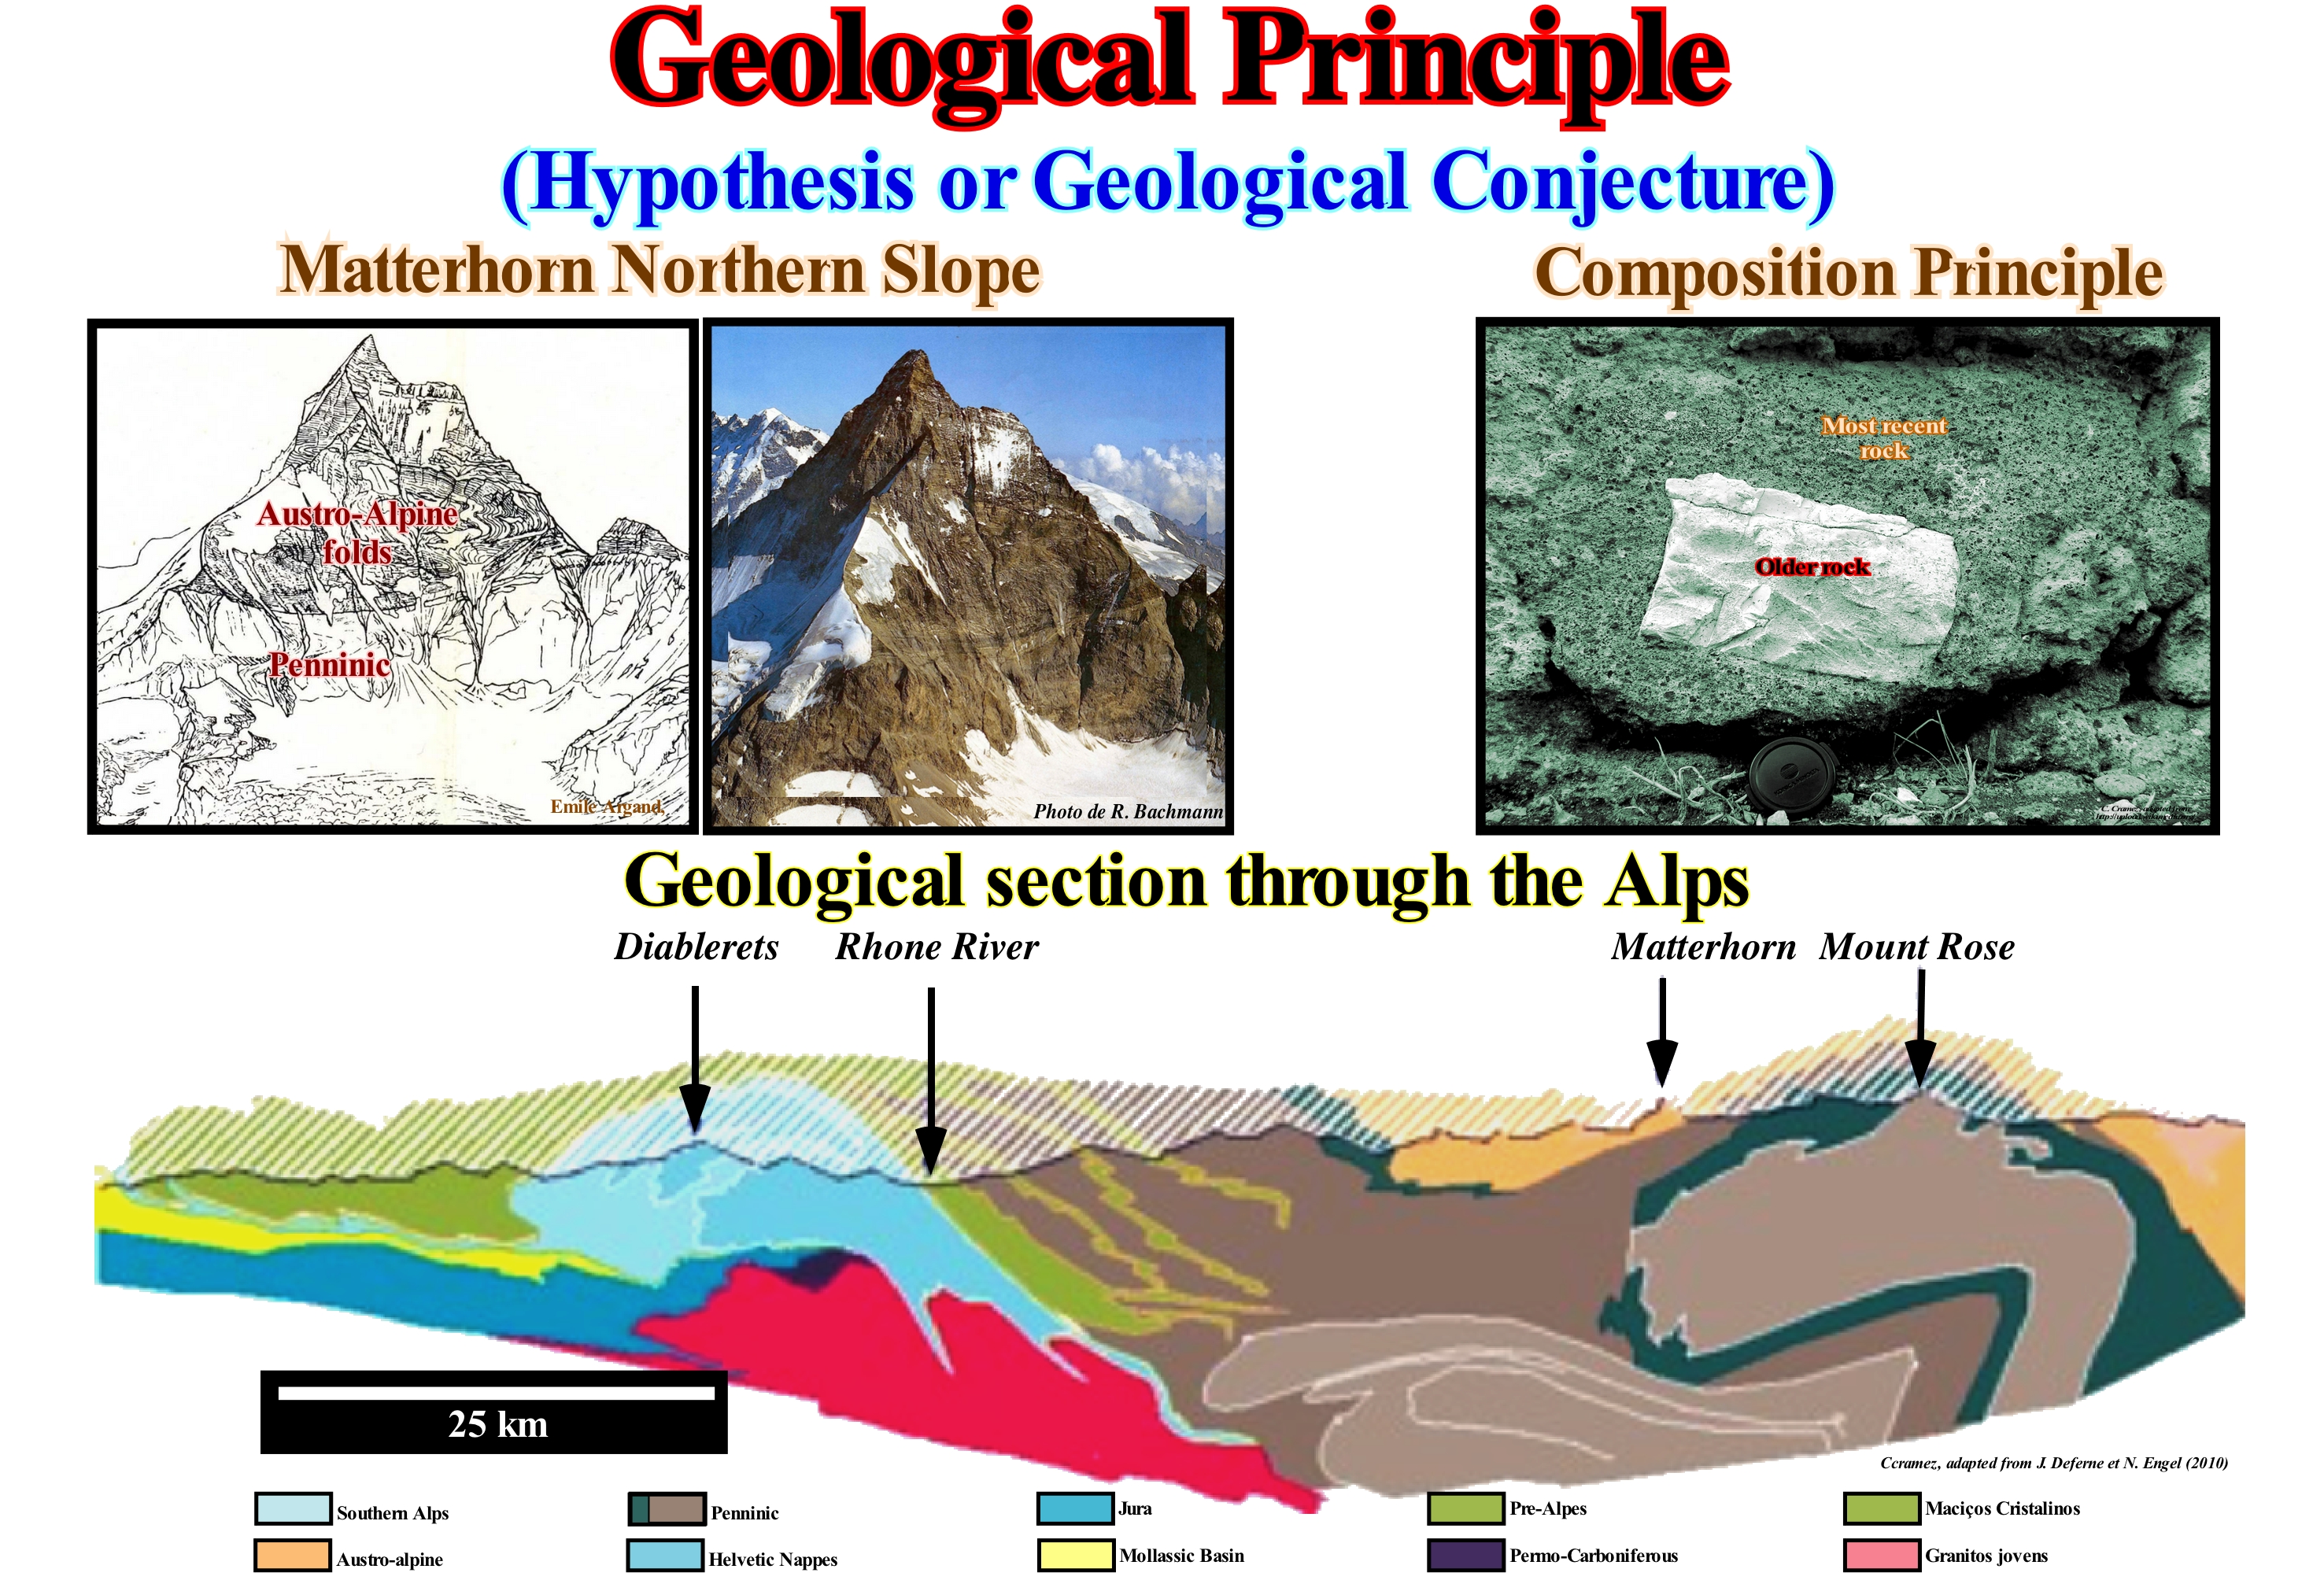
The major geological principles (refutatious conjectures) are:
(1) Superposition Principle - "In an undeformed or slightly deformed sedimentary series the oldest layers are at the base and the most recent layers, successively, above". This principle is still valid today; it has not undergone any modification since Steno (except for the terraces).
(2) Original Horizontality Principle - "The sedimentary layers are deposited horizontally" . This principle was later improved ; we know today that bedding plans are chronostratigraphic surfaces composed of geological environments with different slopes ; alluvial deposits (located upstream of the bay line), deposits of the continental slope and, in particular, Gilbert deltas do not settle horizontally ; taking into account the low value of sediment slopes (except for certain carbonates and submarine slope cones), it may be said that this principle, in its broad lines, is valid ; most of the sedimentary layers settle with slopes lower than 10 °, which is not too far from the horizontal.
(3) Principle of Original Lateral Continuity - "The sedimentary layers are deposited in lateral continuity ; they thin down to zero or they terminate by downlaps or onlaps at the edges of the original sectors of deposition". This principle is still valid today. It admits that the lateral continuity of the sediments may disappear by erosion or due to tectonic movements. The sediments at the time of deposition are connected, but may later be separated, for example, due to the formation of river valleys. Such a discontinuity so evident today was very difficult to explain in the seventeenth century.
(4) Intrusion Principle - The relative age between two igneous rocks, or between an igneous rock and a sedimentary rock, can be deduced by the geometrical relations between them: "An intrusive igneous rock is younger than the one it penetrates".
(5) Composition Principle - A rock is younger than its constituents. It applies to all types of rocks: "A rock represented by fragments on another rock is older than the rock that has them". A granite rock is younger than the inclusions (xenolith) it has. A conglomerate is younger than its pebbles, which are often fragments of older sedimentary rocks.
(6) Intersection Principle - Allows to give an age relative to the lodes, in particular, when they intersect: "The most recent lode move the oldest reefs". This principle can also be used to date fault systems: "Faults are younger than all the rocks they move, and older, than the rocks that fossilize them, in unconformity". On can say: "Young faults displace the older faults ". This principle is valid just when applied to relatively flat observation surfaces. In isochronous structural maps (equal time-duration) or contour map, due to topography, sometimes, the apparently displaced fault is the most recent.
(7) William Smith Principle of the Succession of the Fossils - "The distribution of fossils in rocks is not unpredictable, it follows a definite vertical succession"; it is interesting to note that the author of this principle never admitted the evolution of the species. Today all geoscientists explain such a succession of fossils as a consequence of the evolution of species.
(8) Walther Principle or Law of Correlation of Walther's facies- "Facies that follow each other, vertically, in conforming layers succeed laterally in adjacent environments". In other words, in continuity of sedimentation, if a geoscientist recognizes, laterally, a sandy facies of coastal plain, a clayey facies of continental slope and, finally, a shale facies of abyssal plain, it will recognize, vertically, and from bottom to top , a shaly facies of abyssal plain, a clayey facies of continental slope and, finally, sandy facies of coastal plain.
(9) Goguel Principle- This quite old principle, took a very important place in geology with the works of Goguel (1954), which introduced the second principle of thermodynamics in geology and, particularly, in tectonics: "During deformation, the volume of sediments is, more or less, constant ". This principle is, relatively, approximate. It does not take into account the volume reduction induced by the porosity decreasing with depth and dissolution phenomena, which can, exceptionally, reach 30% of the total volume. In 1933, Lindgreen introduced the same principle in mining geology. He suggested during the formation of a replacement ore, there is no change in either volume or shape of the rock (law of equal volumes).
(10) Uniformitarianism Principle - Geological changes are due, mainly, to the same processes and continuous changes that are observed today: "The Present is the key of the Past";
(11) Catastrophism Principle - Changes that have occurred on Earth were due to the occurrence of major natural disasters.
(12) Dextrorotatory Principle - If a reference system rotates clockwise, the deflection (Coriolis effect) is to the left of the object in the direction of motion.
(13) Drifting of Continents Principle -As continental masses have a small density they float over dense oceanic masses, moving and altering the surface of the planet. This would have been advanced in 1912, by Alfred Wegener, and served as the basis for the principle of plate tectonics.
(14) Plate Tectonics Principles - Continents do not move. The lithospheric plates that contain the continents move. This principle is a reformulation of the principle of drift of the continents of Wegener that explains above all the energetic origin of the movement of the lithospheric plates that constitute the surface of the Earth.
(15) Neocatastrophism Principle - which admits Uniformitarianism as the main guide, but does not exclude occasional catastrophic phenomena have contributed to eventual changes in the Earth's surface ; in other words, Neocatastrophism associates catastrophic ideas with uniformitarianism to explain certain phenomena such as the extinction of dinosaurs.
For three centuries, geoscientists use these geological principles, and many others, such as the Ochkam principle (plurality should not be invoked without necessity: "Pluritas non est ponenda sine needs") etc., to correlate and date the rocks. This principle is the predecessor of the so-called KISS principle ("Keep Kit Simple, Stupid" which in Portuguese can be translated "simplify, stupid." Kant - in the Critique of Pure Reason - accepts the maxim that "rudiments or to be unnecessarily multiplied (entia praeter necessitatem non esse multiplicanda) "and says that this is a regulating idea of pure reason in the theorization of scientists on nature (Kant, 1781/1787, pp. 538-9).
Creationism is not a principle or scientific hypothesis. It can not be refuted and has no application in geology. It is a religious belief that mankind, life, the Earth and the Universe are the creation of a supernatural agent. However, it is often used to reject, for religious reasons, certain biological processes, particularly the principle or theory of evolution.
In stratigraphy, and particularly in sequential stratigraphy, the study of fossils is very important. The identification of guided fossils, which have a wide geographical distribution and a short time interval between their appearance and their extinction, allowed to determine the relative age of the rocks and, thus, to date the main unconformities, that is to say, the main relative sea level falls, which put the sea level lower than the basin edge, which allowed the development of an erosional surface in the coastal edge and in the upper part of the continental slope. Guiding fossils, in addition to having (i) An important spatial and geographic distribution and a reduced stratigraphic and temporal distribution, also have to be (ii) Easily distinguished from others and (iii) Appear in various types of sedimentary rocks. It is the age of the submarine fans and, particularly, the age of the submarine fans of basin that gives, with more precision, the age of the unconformities or its correlative paraconformity in deep water, on which the submarine fan rest. Obviously, taking into account the turbiditic nature of the submarine basin fan, all the fossils that eventually they may contain are unusable once they are transported. However, the fossils found in the pelagic layers, deposited among the submarine basin floor fans, above all, allow, in general, excellent dating. With certain precautions in particular, always taking into account the seismic resolution, that is, the ability to separate two very close seismic events, or the minimum separation between two events before the identity of each is lost, a large part of the aforementioned geological principles can be applied in seismic geological interpretation attempts. We think above all of the Goguel Principle, Walther's Principle or Walther's Facies Correlation and the Ochkam’s Principle (if there are several explanations of a phenomenon, the same conditions, the simplest explanation is the best).
(*) The vertical seismic resolution can be defined as the minimum vertical distance between two interfaces to obtain, in the seismic line, a single reflective event. The lateral seismic resolution is the minimum distance between two more or less vertical interfaces to obtain, in a line, two different and non-continuous reflective events. The lateral seismic resolution is determined by the radius of the Fresnel zone, which depends on the wavelength of the acoustic pulse and the depth of the reflector. In the same way, that light from a pocket lamp crosses the dark and illuminates a particular area (circle or ellipse), seismic energy travels across the terrain in the form of wave fronts and reaches reflective interfaces over discrete zones ( areas of Fresnel). The lateral resolution of a migrated seismic line is greater than that of a non-migrated one, although in the migrated (2D) there is still the problem of line orientation in relation to the slope of the interface, which is not the case in 3D lines.
(**) Several scientists and philosophers disagree with this principle: (i) Chatton (1290-1343), contemporary of Ochkam, stated that "if three entities are not sufficient to verify a statement about something, then a fourth must be added, and so on " ; (ii) Leibniz (1646-1716)," the variety of beings can not be diminished " ; (iii) Menger (1902-1985), "Entities can not be reduced to the point of inadequacy," and "it is useless to do little of what requires more." Obviously none of these statements actually contradict the meaning of the Razor of Ochkam, but rather serve as an alert against over-zeal in applying the principle. One must eliminate the superfluous, but only that.
Geological Province......................................................................................................................................................Province géologique
Província geológica/ Provincia geológica / Geologischen Provinz / 地质区域 / Геологическая провинция / Provincia geologica //
Spatial and temporal geological entity with common geological attributes.
See: « Craton »
Geological Section.....................................................................................................................................................................Coupe géologique (Section)
Secção geológica (corte) / Sección geológica / Geologische - Querschnitt / 地质剖面 / Геологический профиль / Sezione geologica trasversale /
Diagram showing the structure and arrangement of the rocks in a vertical plane, i.e, how they would appear under the Earth's surface if they were cut vertically.
See: « Formation (geological) »
&
« Geological Time Scale »
&
“ Depth Section (seismic) ”
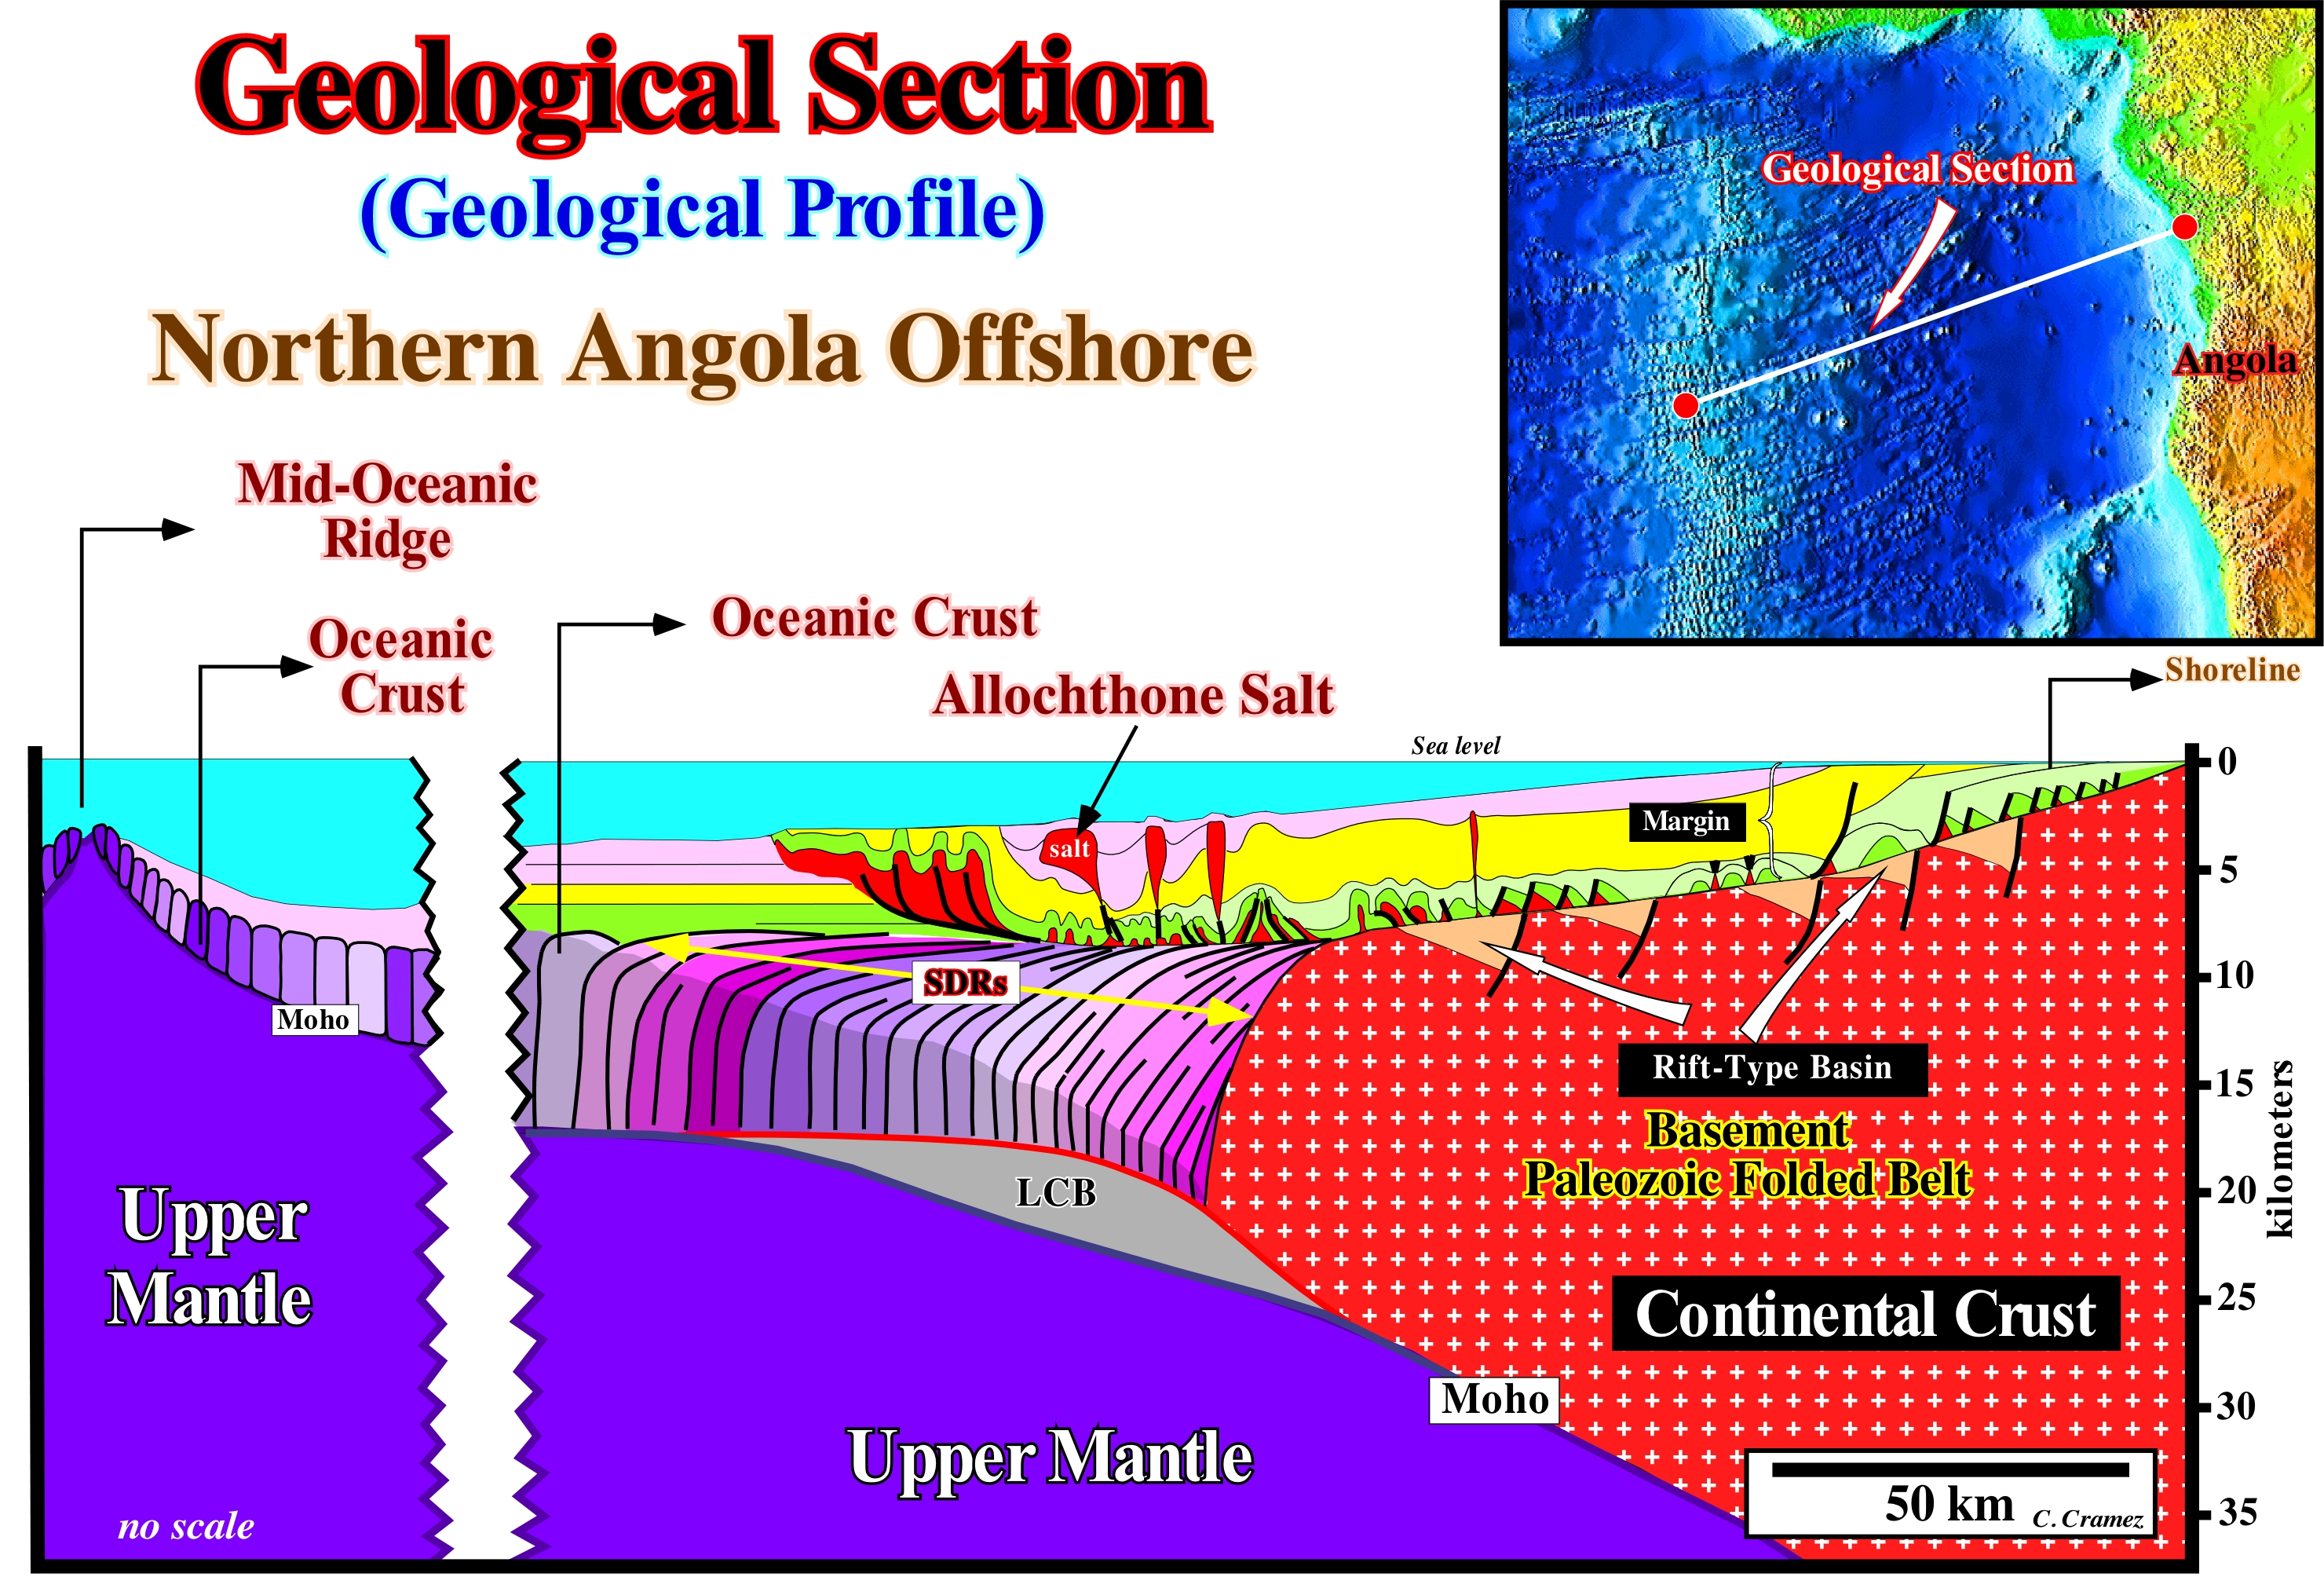
This geological section form the Northern Angola offshore is based on the tentative geological interpretations of several seismic lines, that simulate a regional seismic line representative of this offshore. It illustrates the structure and arrangement of the different rocks that constitute the South Congo geographic basin. Geologically, this offshore corresponds to the stacking of different basins of the classification of the sedimentary basins of Bally and Snelson (1980). From the bottom to top, it is possible le to recognize: (i) A Precambrian basement or a Paleozoic folded belt, which forms the lithosphere of the supercontinent Pangea ; (ii) Rift-type basins that fill the structures (half-grabens) developed during the lengthening the small southern Pangea supercontinent, i.e., the Gondwana, before the breakup of the lithosphere ; (iii) Atlantic-type divergent continental margin, in which due to the deposition of a thick evaporitic interval, it can be subdivided into: (a) Infrasalt Margin and (b) Suprasalt (evaporitic interval included). At the base of the Infrasalt margin, a thick interval of subaerial lavas was deposited (subaerial lavas seems a little bid redundant as volcanic material can just flow out of the water). The sub-aerial lavas were deposited after breakup of the lithosphere. They postdate the formation and filling of the rift-type basins. This geological section suggests the following geological history: (i) Lengthening of the Pangea supercontinent and, particularly, the Gondwana small supercontinent (land mass forming the southern part of the Pangea supercontinent) with the formation and filling of a series of halfgrabens structures (rift-type basins) ; (ii) As the lithosphere became thinned by stretching (probably induced by a thermal anomaly), the igneous activity increased ; (iii) Since the continental crust reached a stretching of about 2, sublithospheric mantle material was injected as gabbro dikes in the upper part of the thinned lithosphere ; (iv) Upon reaching a stretching factor of about 4, the continental crust fractured by injection of volcanism, i.e., the injected material of the sublithospheric mantle became preponderant ; (v) Since the continental crust breakup, lithospheric plates, individualized by rupture, were accreted by the by volcanic spills that formed a volcanic sub-aerial crust (subaerial expansion) ; (vi) Lava flowed from expansion centres (volcanoes and dikes) to the margins formed by the break-up of the lithosphere ; (vii) The vertical overlapping of the sub-aerial lavas has exerted a major overload, which has, gradually, forced the oldest lavas to bury themselves and lean towards the centres of expansion (seaward) ; (viii) The burial of lavas forced, progressively, the expansion centres to sink ; (ix) The stacking of the sub-aerial lavas ends up sinking, completely, the expansion centres and the environment became marine ; (x) As volcanic material can not flow in the water, the volcanic material spewed out by the expansion centres solidified, rapidly, creating the true oceanic crust (pillow lavas) as sea floor spreading progresses ; (xi) The proximal part of the volcanic margin was invaded by the sea allowing the deposition of basal sandstones and evaporites between the subaerial expansion centres and the continent ; (x) The formation and subsidence of the oceanic crust (cooling of the thermal anomaly) causes an absolute (eustatic) sea level rise*** allowing the deposition of sediments of the transgressive phase of the post-Pangea continental encroachment cycle, whose retrogradational geometry is, later, partially, hidden by salt tectonics and halokinesis ; (xii) Since the continents reached the maximum dispersion, more or less, during the Turonian/Cenomanian, the progradational sediments of the regressive phase of the continental encroachment cycle deposited, fossilizing the deposited sediments during the regressive phase.
(*) The absolute sea level is a function of: (i) Tectono-Eustasy that is controlled by the volume variation of the ocean basins in association with oceanic expansion following the break-up of the supercontinents ; (ii) Glacio-eustasy, which is controlled by the volume of water in the oceans as a function of the amount of ice (assuming that the amount of water in all its forms is constant since the Earth's formation, there are about 4.5 Ga) ; (iii) Geoidal-Eustasy which is controlled by the distribution of ocean water caused by variations in the Earth's gravity field (where gravity is stronger than normal, sea level is thrown to the Earth's centre) and (iv) Steric sea level rise or thermal expansion of the oceans, which is controlled by rising ocean temperatures (if the temperature increases, the water density decreases and, for a constant mass, the volume increases).
(**) Assuming that the amount of water in all its forms is constant from the Earth's formation about 4.5 Ga), the volume of the oceanic basins decreased due to the formation of oceanic ridges.
Geological Time..............................................................................................................................................................................Temps géologique
Tempo geológico / Tiempo geológico / Geologische Zeit / 地质时代 / Геологическое время / Tempi geologici /
Time that goes from the Earth's formation (more or less, from 4.7 109 years ago) to the Present. The time between the formation of the Universe (more or less, between 16.5 109 years ago, for a Hubble constant of 18 km / s to 1 My) and the formation of the Earth is, generally, known as cosmological time. Geological time is divided into several intervals during which certain geological events occurred.
See: « Geological Time Scale »
&
« Radiometric Dating »
&
« Relative Time »
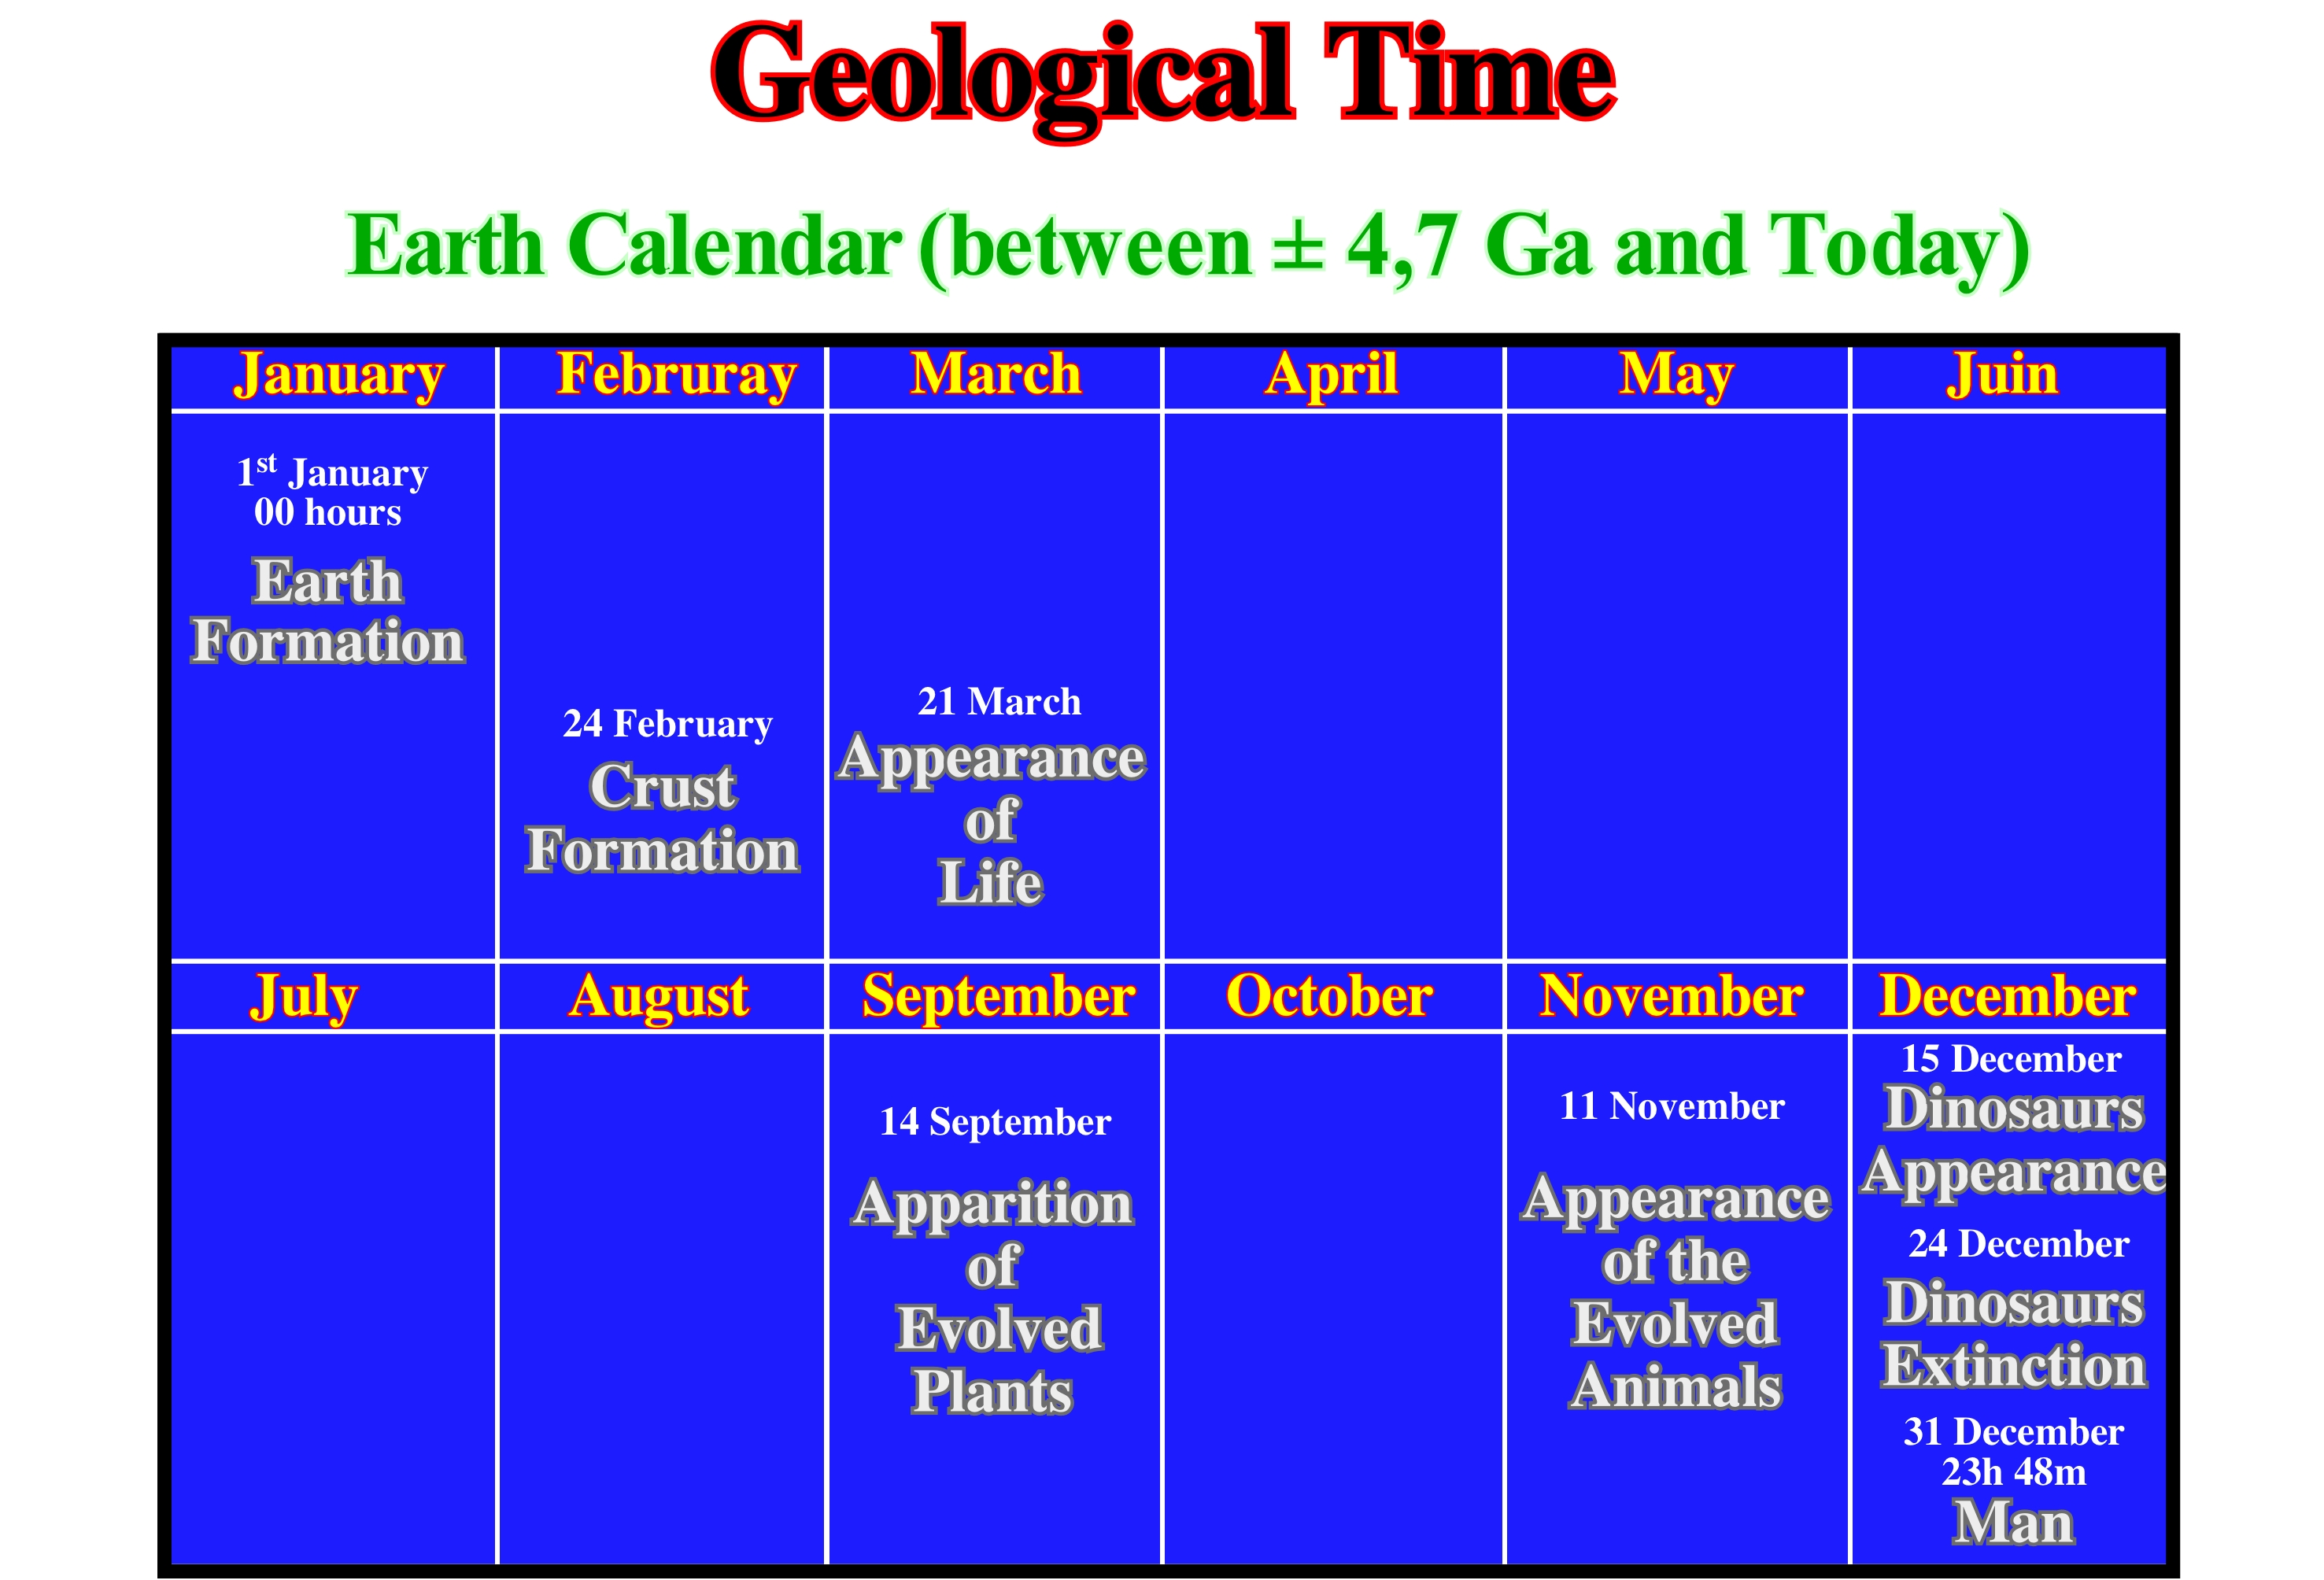
The Universe was born approximately 15 x 109 Ma of a "Primordial Ball" of radiations, whose density and temperature were extremely high and where all the matter and forces (Gravity, Great Nuclear Force, Electromagnetism and Small Nuclear Force) were undifferentiated. The Universe is expanding. Hydrogen (75%) and helium (25%) are the main constituents of the stars. The Universe is, uniformly, filled with weak electromagnetic radiation (equivalent energy to 3° K, zero Kelvin = -273° C). Since the formation of the Universe, time has been divided into Cosmological Time and Geological Time. Many geoscientists divide the Precambrian into Planckian, Gamovian, and Cryptozoic (Hadean, Archaic and Proterozoic). The Planckian and the Gamovian form the cosmological time: (i) The Planckian Era, between 16.5 x 10⁹ and 16.5 x 10⁹ years ago, i.e., between 0 and 5.3 x 10-44 seconds after the Big Bang, is characterized by the appearance of time space, energy and super-force and (ii) Gamovian Era, is limited between 16.5 x 10⁹ and 4.5 x 10⁹ years ago (formation of the solar system). Geological time (not to be confused with cosmological time) is divided into four Ages: (i) Precambrian (Cryptozoic) ; (ii) Paleozoic ; (iii) Mesozoic and (iv) Cenozoic. Any of these times (cosmological and geological) are very difficult to perceive. S. Gould (1990) suggested that not long ago man began to be aware of the immensity of the geological time that preceded him, even if to conceptualize it, he just possesses metaphors Gould (1990). He drew attention to the fact that the reconstruction of Earth's past would be unintelligible if the geoscientists had not used two antagonistic though necessary and complementary concepts: 1) Sagittal (or linear) time, which comes from the Big Bang until today and 2) Cyclic Time, the immanence of the days, seasons, supercontinents, eternally, repeated life, etc. Conceiving time in an abstract and intellectual way is simple. Everyone knows how many zeros must be added to the number 10 to represent billions of years. However, the notion of Geological Time is so strange that we can only apprehend it through metaphors. One of the well-known metaphors is the Earth's calendar, which allows us to see the temporal evolution of major geological events throughout Earth's history. In this metaphor, which is illustrated above, it is assumed that the Earth's age is 1 year. It would have been formed, for instance, on 1st January at 00 hours and 00 minutes. Today it is midnight on 31st of December. In this calendar, the Earth crust would have been formed on 24th of February. Life appeared on 21st of March. The evolved plants appeared on 14th of September. The evolved animals appeared on 11th of November. The appearance of the dinosaurs would have been on 15th of December , and its extinction on 24th of December. The man appeared on 31st of December at 23 hours and 48 minutes, which means that mankind is 12 minute old. The same kind of metaphor can be made for a calendar of the Universe. If the age of the Universe corresponds to one year: a) the Big Bang occurred on 1st of January 2015, for instance ; 2) Galaxies would have been formed on 3rd of January ; 3) Sun on 1st of August ; 4) Planets on 21st of August ; 5) Life appearance on 17th of September ; 5) Vertebrates appearance on 15th of December. The Man would have appeared around midnight on 31st of December. In McPhee's metaphor: "if a simple filing on the nail of the middle finger makes Humanity disappear: (i) The length of the finger corresponds, practically to the Phanerozoic ; (ii) A part of the hand and arm correspond to the Cryptozoic (time interval between ± 540 Ma and 4700 Ma, i.e., the set of Proterozoic, Archean and Hadean), during which the main geological events are spaced in time as in the calendars of the Universe and Earth. Human insignificance was very well translated by Mark Twain in his famous metaphor of the Eiffel Tower: "Man has been here for thirty-two thousand years. That it has taken hundreds of millions of years to prepare the world for it is proof that the world was made for it. I think, I do not know. If we now take the Eiffel Tower to represent the age of the world, the painting film on the top that covers the pinnacle would represent the age of humanity and it is evident to everyone that the tower was not built for that thin film of paint; if you want, I do not know". In Earth's history, geological and biological events are calibrated in sagittal time (arrow) and it is the synergistic result of uni-directional, cyclic, punctual and chaotic events in a world where non-linear processes are frequent and where order alternates with chaos (disorder). The identification of such events is one of the main functions of geoscientists, who must separate events with a global significance of local events and determine the geometric and chronological relations between them and the driving forces that give rise to them.
Geological Time Scale..............................................................................................................................Échelle du temps (Géologique)
Escala do tempo geológico / Escala de tempo (geológico) / Geologische Zeitskala / 地质年代 / Геохронологическая шкала / Scala dei tempi geologici /
Division of geological history into: (i) Eons; (ii) Eras; (iii) Periods ; (iv) Times and (v) Ages, determined from stratigraphy and paleontology.
See: « Geological Time »
&
« Chronostratigraphy »
&
« Radiometric Dating »
Most geoscientists consider that the Proterozoic/Phanerozoic border occurs with the appearance of the first trilobites and Archaeocyatha*. Thus, the Phanerozoic represents the time during which most of the macroscopic organisms, algae, fungi, plants and animals lived. Initially, it was thought the Phanerozoic coincided with the beginning of life. Nowadays, this Eon coincides with the appearance of animals, which have developed an external skeleton, such as the more recent shells and other animals that formed an internal skeleton, such as the vertebrate bones. The time before the Phanerozoic is, generally, called Precambrian, which is qualified as Supereon, Eon or Era, function of geoscientists. Certain geoscientists consider the Precambrian as a Super-Eon, and divide it into the Archean and the Algonkian, which they consider eons. Others divide the Precambrian into four eras: (i) Hadean; (ii) Katarcheozoic ; (iii) Archaeozoic and (iv) Proterozoic (proteros = anterior + zoikos = animals). The first two form the Archaic and the last two form the Algonkian. The Phanerozoic is formed by three eras: (a) Paleozoic ; (b) Mesozoic and (c) Cenozoic. The term "zoic" means animal, as well as "Paleo" means old, "Meso" middle and "Ceno" recent. These divisions reflect the major changes in the composition of the ancient faunas, each of which is characterized by a particular group of animals. The Cenozoic is called "Age of Mammals, as the Mesozoic is called "Age of Dinosaurs" and Paleozoic "Age of Fishes". Of course, this is an oversimplification: In the Mesozoic, for instance, lived many other animals besides of dinosaurs, such as mammals, turtles, crocodiles, frogs and, above all, an extremely large number of varieties of insects. There have been many types of animals that have lived in the past and that do not exist today. The old floras, too, have undergone many changes and not necessarily, at the same time as the animals. If we had the possibility of traveling to the Archaic it would be difficult to think that we were on the same planet that we are now living in. The atmosphere was very different from the one we breathe today. It was, mainly, composed of methane (CH4) and ammonia (NH3) and other toxic gases for the vast majority of living beings on our planet. At that time, the Earth's surface began to cool, enough, for the rocks and lithospheric plates begin to form. The first bacteria and stromatolites** appeared at the end of Archean, more or less, during Katarcheozoic. The sketch illustrated in this figure suggests : (i) In the Hadean the continents and oceans were formed ; (ii) In the Katarcheozoic the first igneous and sedimentary rocks were formed, as well as, the first anaerobic bacteria and stromatolites ; (iii) In the Arqueozoic, aerobic photosynthesis began to take place, the atmosphere began to oxygenate and aerobic respiration appeared ; (iv) In the Proterozoic, appeared protokaryotes, eukaryotes, sexual reproduction, macro-eukaryotes and micro-algae. Since the Earth formation, around 4.5 Ga, until today, the following succession of geological events is, often, proposed: (A) Formation of continents and oceans ; (B) Formation of igneous and sedimentary rock ; (iii) Anaerobic bacteria and stromatolites ; (iv) Aerobic photosynthesis, Oxygenated atmosphere, Aerobic respiration ; (v) Prokaryotes, Eukaryotes, Sexual reproduction, Macroeukaryotes, Microalgae ; (vii) Reptiles, Fish, Primates and Mammals: (vii) Crustaceans, Molluscs, Plants ; (viii) Fish, Ferns, Amphibians ; (ix) Insects, Reptiles, Conifers; (x) Dinosaurs, Mammals, Birds, Angiosperms ; (xi) Extinction of Ammonites and Dinosaurs, Primates ; (xii) Anthropoids and (xiii) Pre-Hominids, Homo Sapiens.
(*) Archaeocyathids are animals known only in the fossil record of the Cambrian, colonial or solitary way of life and supported by a carbonate inner skeleton. The first fossils of archaeocyathids were discovered in the first half of the 19th century in outcrops in Labrador (Canada) and Siberia (Russia), but were described, respectively, as sponges and Calamites, a typical Carboniferous plant. Only in 1862 was recognized they belonged to a proper phylum, designated then as Archaeocyatha. Currently, the taxonomic position of the archaeocyathids is still under debate, with some authors considering the group as a class of the Porifera phylum. The archaeocyathids appeared in the Early Cambrian and were extinguished in the Middle Cambrian.
(**) Layered accretion biochemical structures formed in shallow seas by trap, envelopment, and cementation of sedimentary grains by biofilms, i.e. microbial mats, of micro-organisms, especially cyanobacteria. The definition of stromatolites is subject to many controversies, but in an approximate way, it can be said stromatolites are fossil rocks formed by the activity of micro-organisms in aquatic environments, which, when accumulated on the bottom of low water depths, form a reef species.
Geometric Relationship (Reflector, strata)..............................................................................Relation géométrique
Relação geométrica / Relación geométrica (reflector, estrato) / Geometrischen Beziehung (Reflektor oder Stratum) / 几何关系(反射层或地层) / Геометрическое соотношение (отражателя или слоя) / Relazione geometrica (riflettore o strato) /
One of the geometric configurations of the strata or reflectors within a stratigraphic unit. The sedimentary geometry translates deposition processes and deformations after deposition. It is important to distinguish the sedimentary geometry from the geometry of the termination of the strata. The first allows a prediction of the sedimentary environments, while the second allows the unconformity identification. Equally, it is important to differentiate the original geometric relations (deposition time) of the relations deformed by tectonics.
See: « Stratal Patterns »
&
« Chronostratigraphy »
&
« Sequential Stratigraphy »
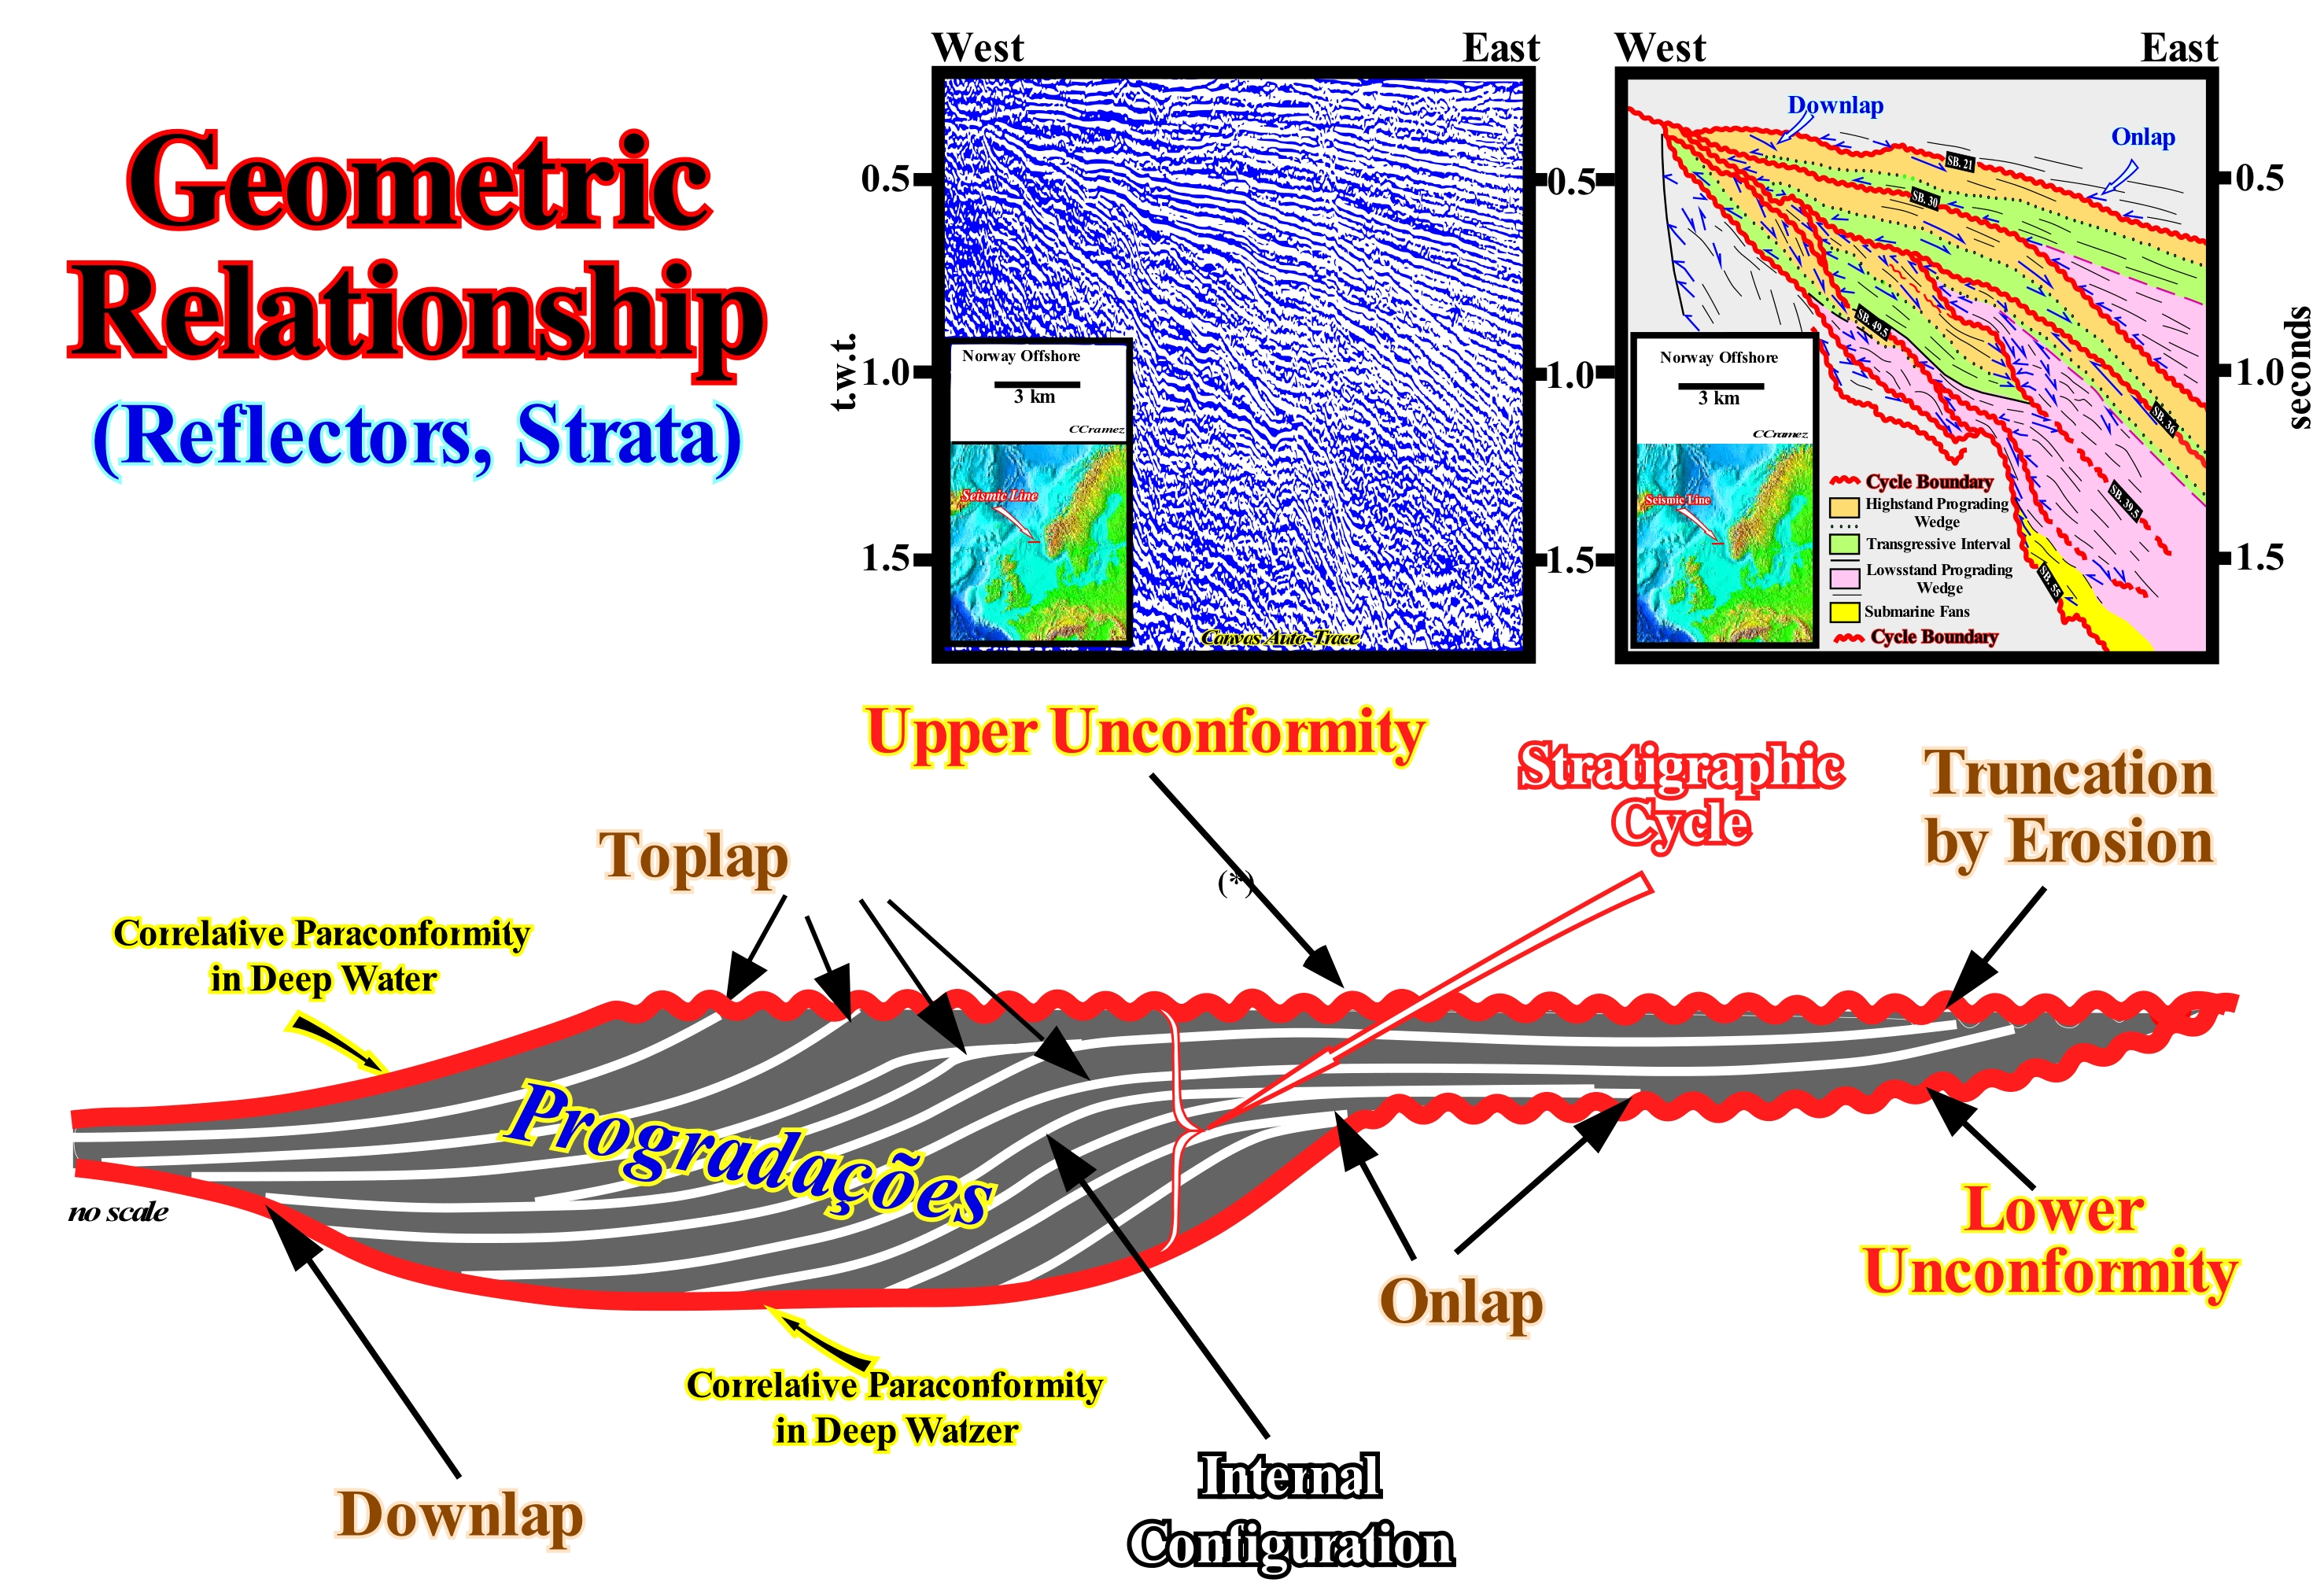
In this sketch are shown the main geometric relations that can be found in a stratigraphic cycle, both in a seismic line and in the field. In a sequence-cycle, which is induced by a 3rd order eustatic cycle, i.e., a cycle having a time-duration between 500 k and 3/5 M, the age difference between the relative sea level falls, obviously, can not be greater to 3/5 My. The relative sea level is a local sea level, referenced at any point on the Earth's surface, whether it is the base of sediment (top of the continental crust) or the sea floor. It is the result of the combined action of absolute (eustatic) sea level (sea level, global, referenced to the Earth's centre) and the tectonics (subsidence of the sea floor, when extensional tectonic regimes are predominant or the uplift of the sea floor, when compressional tectonic regimes are predominant). In other words, to consider a stratigraphic cycle as a sequence-cycle, the age difference between the unconformities or their correlative deep water paraconformities can not be greater than 3/5 My. Generally, the unconformities are not underlined by seismic reflection. They are recognized by the seismic surfaces defined by the reflector (or layer) terminations (lapouts). In the sketch illustrated in this figure, as the ages of the unconformities limiting the sedimentary interval emphasized by chronostratigraphic lines (white line), which may correspond to bedding planes (field) or to seismic interfaces* are not known, it is preferable to consider this interval simply as a stratigraphic cycle. In any case, different geometric relations between the chronostratigraphic lines can be individualized: (i) Onlaps ; (ii) Downlaps ;(iii) Toplaps. Onlaps express the geometric relation between horizontal strata (or seismic reflectors), which terminate against an inclined surface, or express the relation between strata, initially inclined, that end against an initially more inclined surface. Downlaps express the relationship between strata or originally inclined reflectors, which terminate, downstream, against originally or horizontally inclined strata or reflectors. Toplaps express the relationship between strata, or seismic reflectors, against an overlying surface. Different types of onlaps can be considered: (a) Coastal Onlaps ; (b) Distal Onlaps ; (c) Proximal Onlaps ; (d) Marine Onlaps ; (e) True Onlaps, when observed parallel to the depositional dip, which corresponds, generally, to the direction of the sedimentary influx. etc. There are also several types of downlaps: a) Basin Downlaps ; (b) Distal Downlaps and (c) False Downlaps and (d) Platform Downlaps. Basin downlaps are located downstream of the basin edge and particularly beyond the continental slope base. Distal Downlaps are in the direction of the regional terrigeneous influx (locally, and in particular in overbanking deposits, the downlaps are not distal since they are oriented generally perpendicular to the direction of the regional terrigeneous or sedimentary influx). False downlaps area tangential termination of the strata (or seismic reflectors) downstream, i.e., they are horizontalized and remain as independent stratigraphic units that are often so thin that they are not captured by the capacity resolution of the seismic method. Platform downlaps are downlaps in a continental platform that, generally, underline a delta slope located downstream of the depositional coastal break of the depositional surface. The toplaps, which can be developed by erosion (truncation) or by periods without deposition, can be: 1) Coastal ; 2) Marine and 3) Non-marine. Within a given interval, seaward progradation of the shoreline may be marked by sigmoid chronostratigraphic lines (i.e., by progradations**) characterizing a significant (above to seismic resolution) sedimentary aggradation (upbuilding). When the chronostratigraphic lines are oblique, there is no evidence of aggradation, i.e., there is just outbuilding of the shoreline. The tentative geological interpretation of a Canvas auto-trace of a detail of a North Sea regional seismic line, illustrated in this figure, was made at the hierarchical level of the continental encroachment sub-cycles (2nd order eustatic cycles, whose time-duration varies between 50 My and 3/5 My). The reflector terminations define the main seismic surfaces (unconformities and downlap surfaces).
(*) Sedimentary intervals whose thickness is conditioned by the resolution of the seismic lines.
(**) A progradation is one of the chronostratigraphic lines that indicate a dewars displacement of depositional coastal break of the depositional surface. It can be sigmoid, when there is a significant aggradation (outbuilding + upbuilding), or oblique when there is just outbuilding. Function of the geometry of the chronostratigraphic lines, oblique, sigmoid, oblique /tangential or shingled progradations can be considered.
Geometric Relationship (Stratigraphy sequential)..........................................................Relation géométrique
Relação geométrica / Relación geométrica (estratigrafía secuencial) / Geometrischen Beziehung / 几何关系(层序地层学)/ Геометрическое соотношение (стратиграфия) / Relazione geometrica /
One of the many original geometric configurations of the strata, or reflectors, within a stratigraphic unit at the time of deposition and independently of the tectonic deformation subsequent to deposition. Mapping of surfaces defined by geometric relations (terminations of strata or seismic reflectors) is one of the most important data of Sequential Stratigraphy.
See: « Stratal Patterns »
&
« Chronostratigraphy »
&
« Geometrical Relationship (reflector, stratum) »
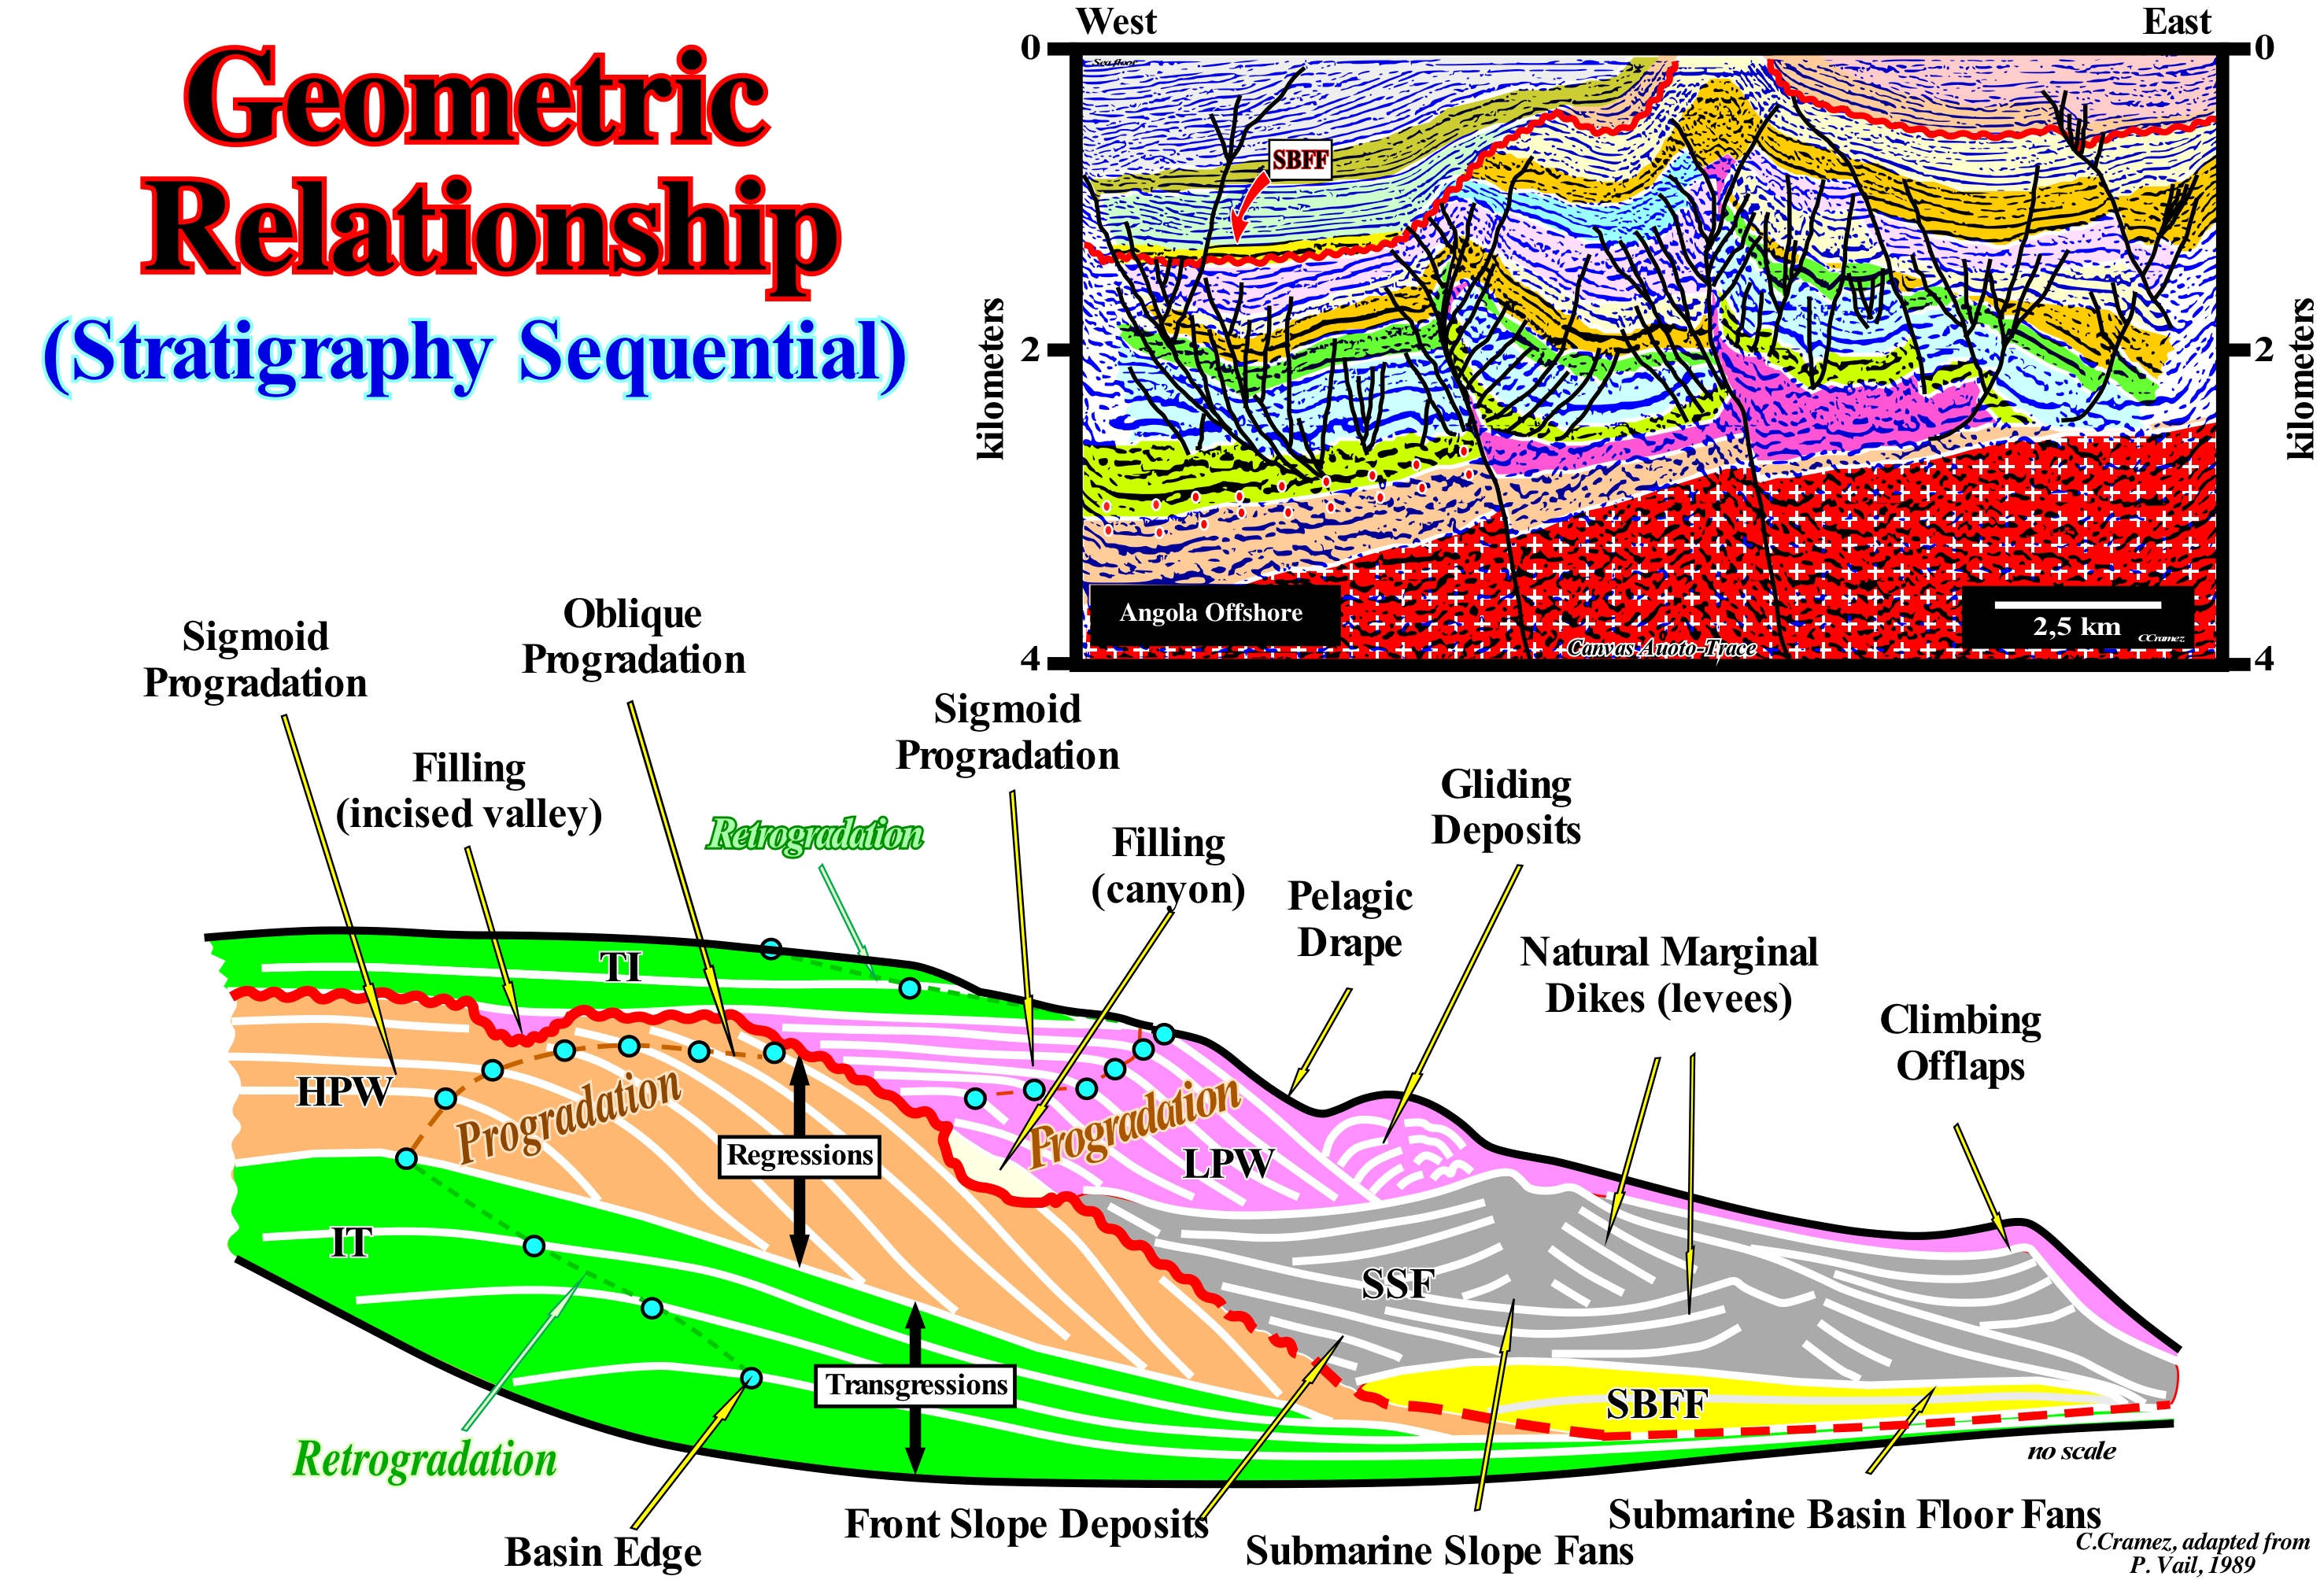
A sequence-cycle is deposited in association with a 3rd order eustatic cycle, whose time-duration varies between 0.5 My and 3/5 My. A sequence-cycle is limited between two unconformities, i.e., between two erosional surfaces or between their correlative deep water paraconformities. Obviously, the age difference between the lower and upper unconformities can not be greater than 3/5 My. When a sequence-cycle is complete, from bottom to top two systems tracts groups are recognized: (i) Lowstand Systems Tracts Group (LSTG), in which there ^are three systems tracts subgroups that from bottom to top are: a) Submarine Basin Floor Fans (SBFF) ; b) Submarine Slope Fans (SSF) and c) Lowstand Prograding Wedge (LPW) and (ii) Highstand Systems Group (LSTG), in which there are, mainly, two systems tracts sub-groups: d) Transgressive interval (TI), at bottom, and e) Highstand Prograding Wedge (HPW), on top. In certain cases, another highstand systems tracts subgroup van be considered: f) Forced Regression (FR). In this sketch, two incomplete sequence-cycles are illustrated. In the lower cycle, the geometric relationships between the reflectors (strata in the field) allow to recognize: (i) The Transgressive Interval (TI), coloured green, during which the shoreline, globally, moves to the continentward, i.e., it retrogrades towards the mainland between two consecutive eustatic paracycles (in this case, the basin edge coincides with the continental edge, stays fixed) and (ii) The Highstand Prograding Wedge (HPW), coloured in light brown, during which, progressively, the shelf is fossilized as the shoreline moves seaward. In the 1st development phase of the highstand prograding wedge (HPW), when the shoreline is individualized from the basin edge, the basin has a shelf. However, in during the the 2nd development phase of the highstand prograding wedge (not present in this sketch), the basin has no shelf and the shoreline coincides, more or less, with the continental edge, which is, also, the basin edge. The lower sequence-cycle ends with a significant relative sea level fall, which displaced the shoreline seaward and downward, producing an erosional surface (unconformity), along which incised valleys and submarine canyons can be developed. In the upper sequence-cycle, the geometric relationships between the reflectors allow to identify from the bottom up: (a) Submarine Basin Floors Fans (SBFF), coloured in yellow, that were deposited during the relative sea level fall* that create an unconformity ; (b) Submarine Slope Fans (coloured in grey) with their turbidite natural marginal dikes (levees) and climbing toplaps (toplaps inclined upstream, in the opposite direction of the currents, associated, generally, with the submarine slope fans and, particularly, with overbanking deposits, i.e., natural marginal turbiditic dikes - seagull wings) ; (c) Lowstand Prograding Wedge (LPW), coloured in light violet, and characterized by a well-defined progradational geometry that fossilizes the submarine canyon fillings ; (d) Submarine Canyon Fillings, which are done during the deposition of the lowstand prograding wedge ; (e) The incised valley fillings which were made during the deposit of the upper part of lowstand prograding wedge ; (f) Sliding deposits associated with instabilities of the continental edge of the lowstand prograding wedge and (g) The beginning of the transgressive interval (TI), coloured in green, which underlines the 1st flooding surface of the coastal plain of the prism low level and of the erosional surface (unconformity).
(*) Sea level, local, referenced at any fixed point on the Earth's surface, whether it be the basis of sediments or the sea floor, and which is the result of the combined action of absolute (eustatic) sea level, which is sea level, global, referenced to the Earth's centre and subsidence, when extensional regimes are predominant, or uplift of the sea floor, when compressional tectonic regimes are predominant. The absolute (eustatic) sea level is a function of: (i) Tectono-Eustasy, that is controlled by the volume variation of the ocean basins in association with oceanic expansion following the rupture of the supercontinents ; (ii) Glacio-eustasy, that is controlled by the volume of water in the oceans as a function of the amount of ice (assuming that the amount of water in all its forms is constant since the Earth formation, around 4.5 Ga) ; (iii) Geoidal-Eustasy, that is controlled by the distribution of ocean water caused by variations in the Earth's gravity field (where gravity is stronger than normal, sea level is thrown to the Earth's centre) and (iv) Steric sea level rise or thermal expansion of the oceans, which is controlled by rising ocean temperatures (if the temperature increases, the water density decreases and, for a constant mass, the volume increases).
Geopectal (Criterion)...............................................................................................................................................................................Géopétique (Critère)
Geopéctico / Geopético (crtério) / Weg nach oben Kriterium / 一路标准 / Геопетальный / Criterio geòpeta /
Criterion from which a geoscientist in the field can infer the original top of a stratum, i.e., determine whether the layers are in the original deposition position or whether they were inverted by a compressive tectonic regime (characterized by an ellipsoid of the effective forces with the main axis, σ1 horizontal).
See: « Stratification (sedimentos) »
&
« Steno's Laws »
&
« Stratigraphy (objectives) »
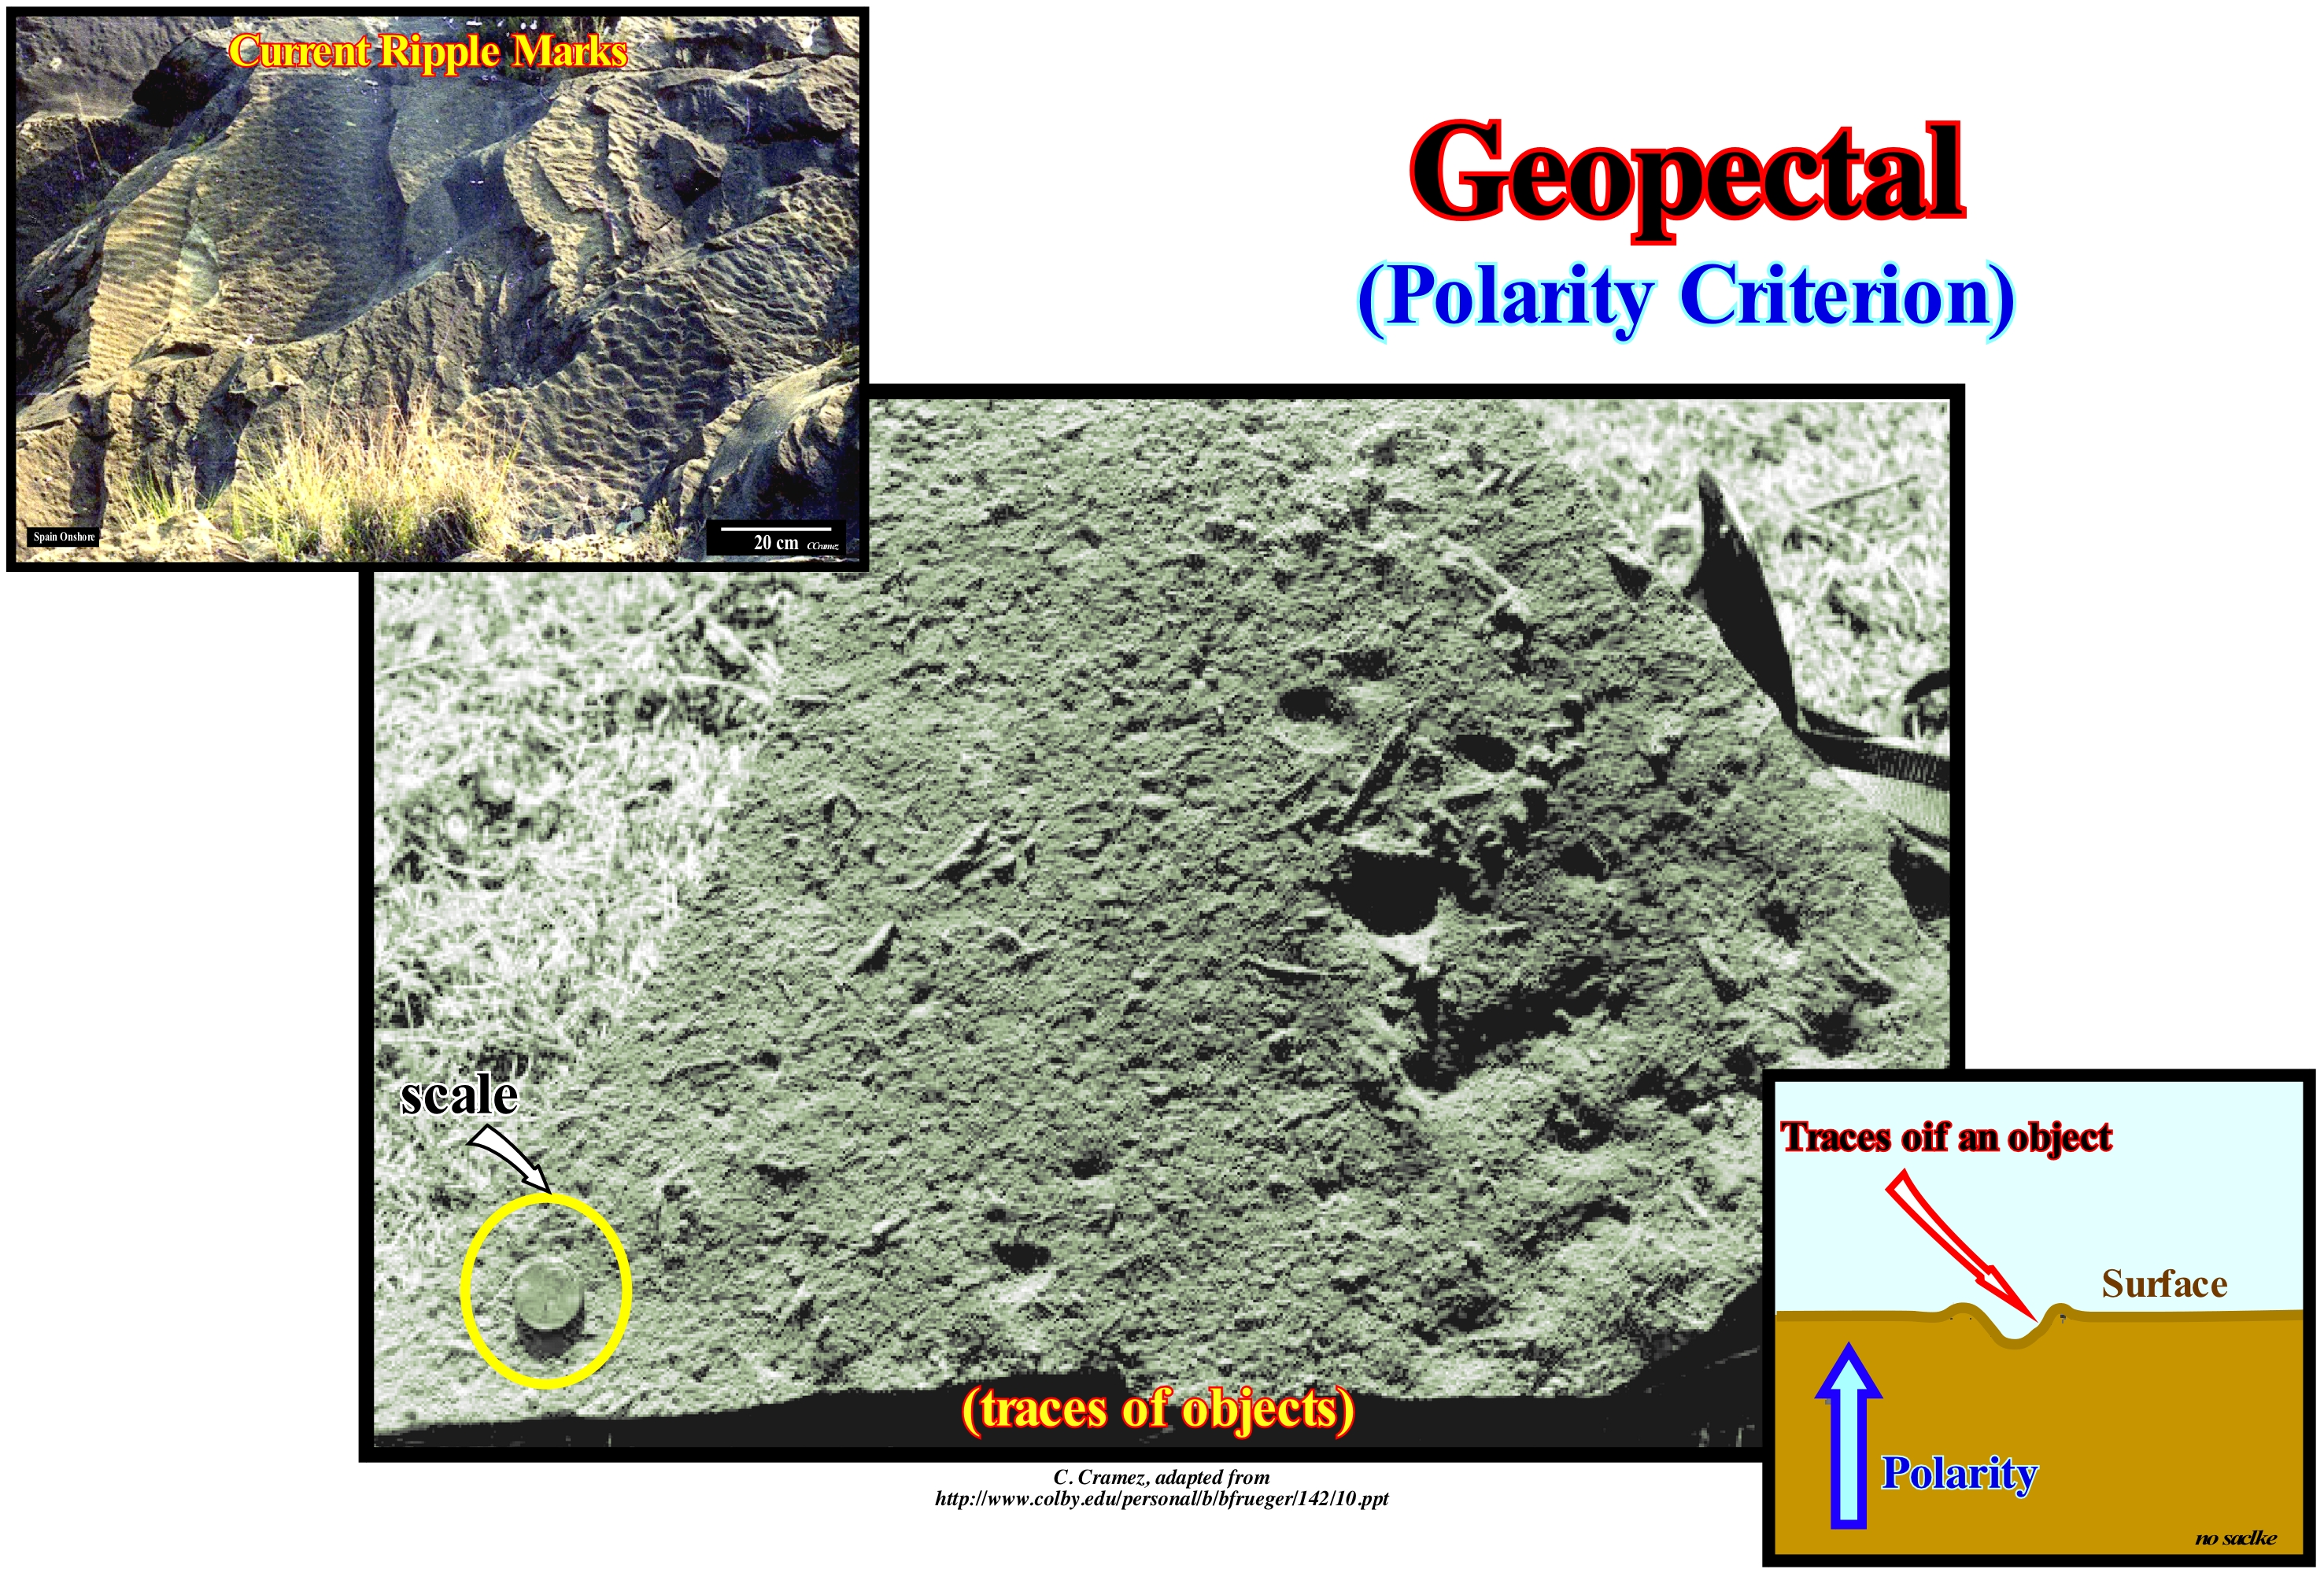
Often, in regions where sediments were shortened by a compressional tectonic regime (σ1 horizontal), geoscientists have difficulty to determine whether a sedimentary series is in its natural order (the older layers covered by younger layers) or, if on the contrary, the series is inverted, i.e,, the higher topographic higher layers are the older. Such a problem is frequent in the field. The scale of the observation is mesoscopic. There is no continuity between the outcrops. One of the most important and easiest geopectal criteria is to see, in an outcrop, whether the layers have a coarsening stratification upward or downward. When the deposition involves a variation of the spatial and temporal granulometry, i.e., grain size (as for example in turbidite depositional systems), the clastic intervals in their original depositional position exhibit, always, a finning upward granulometry. If in an outcrop, the bedding is finning downward, i.e., the layers were inverted by tectonics. However, not all clastic intervals are graded bedding. Geoscientists have discovered other geopectal criteria such as: (i) Marks or Bottom Figures, Ripple Marks, that when preserved on rocks, give us information about the sedimentary environment in which they formed, as well as the original position of the layers and the direction of the currents that produced them) ; (ii) Grooves, Flutings ; (iii) Traces of objects (as shown in this figure) ; (iv) Flame Structures ; (v) Load Structures (deformation of clayey layers due to sinking of a sand layer ; (vi) Desiccation or Retraction Cracks, that may remain conserved in old rocks, formed due to strong evaporation, mainly in shaly and silty sediments) ; (vii) Impressions of the rain drops may be printed ; (viii) Cross-bedding (maximum thickness) ; (ix) Cross-bedding (synform position) ; (x) Oscillation Ripples ; (xi) Fossils Position ; (xii) Prints of rain drops (may be printed on the surface of soft sediments) ; (xiii) Fossils trace, i.e., ichnofossils (animal footprints, reptile lanes, fossilized fecal matter, etc.), which provide information about animal habits, type of food, etc. All of these criteria are based on the mode of gravitational deposition of sediments. In the block of an outcrop, shown in this figure, which is not in its natural geological position, the upper surface corresponds to the top of the layer. The traces of objects are very visible. They have the same morphology as that shown in the depositional model (upper left corner of the figure). In the geological interpretation of the seismic lines, particularly, on folded belts seismic lines in which, sometimes, the seismic intervals are inverted, the orientation of the depositional surfaces can be used as a geopectal criterion. From the continent seaward, a depositional surface (chronostratigraphic line) is formed by three main segments: (i) Upper or proximal sub-horizontal segment (coastal plain and continental shelf) ; (ii) Seaward dipping segment (continental slope) and (iii) Lower or distal subhorizontal segment (abyssal plain). Under normal conditions, downstream of the seaward dipping segment, the lower segment is the subhorizontal. In a noninverted basin, seaward of continental slope sediments, deep-water pelagic and turbidite fans are deposited. Continentward, platform and shallow-water sediments are predominant. So, if in a tentative geological interpretation of a seismic line, shingled turbidites (corroborated by an exploration well) are recognized upstream of the dipping segment (slope shales) of the same chronostratigraphic line, the most probable is the basin is inverted.
(*) When, in a geological map, in particular, of a mountainous region such as, for instance, the Colombia geological map, the oldest terrains are those that form the mountain highs, it is clear that the sedimentary series is inverted.
Geosoufflé (Theory).................................................................................................................................................................................Géo-soufflé (Théory)
Geosoufflé / Teoría del Geo-soufflé / Geo-soufflé Theorie, Geo-blown Theorie / 地缘成熟理论 / Теория геологической пористости / Teoria do Geo-soffiato /
Theory proposed by C. Emiliani (1992) to explain marine ingressions (absolute sea level rise) and marine regressions (absolute sea level falls). The internal heat of the Earth causes a swelling of the oceanic crust that produces a marine ingression. The swelling forces the rocks of the ocean floor to fracture, which induces a hydrothermal circulation to about 5 km of depth. The heat beeing quickly lost, the dorsal (oceanic ridge) collapses produces a rapid marine regression.
See: « Relative Sea Level Change »
&
« Eustasy »
&
« Sea Floor Spreading »
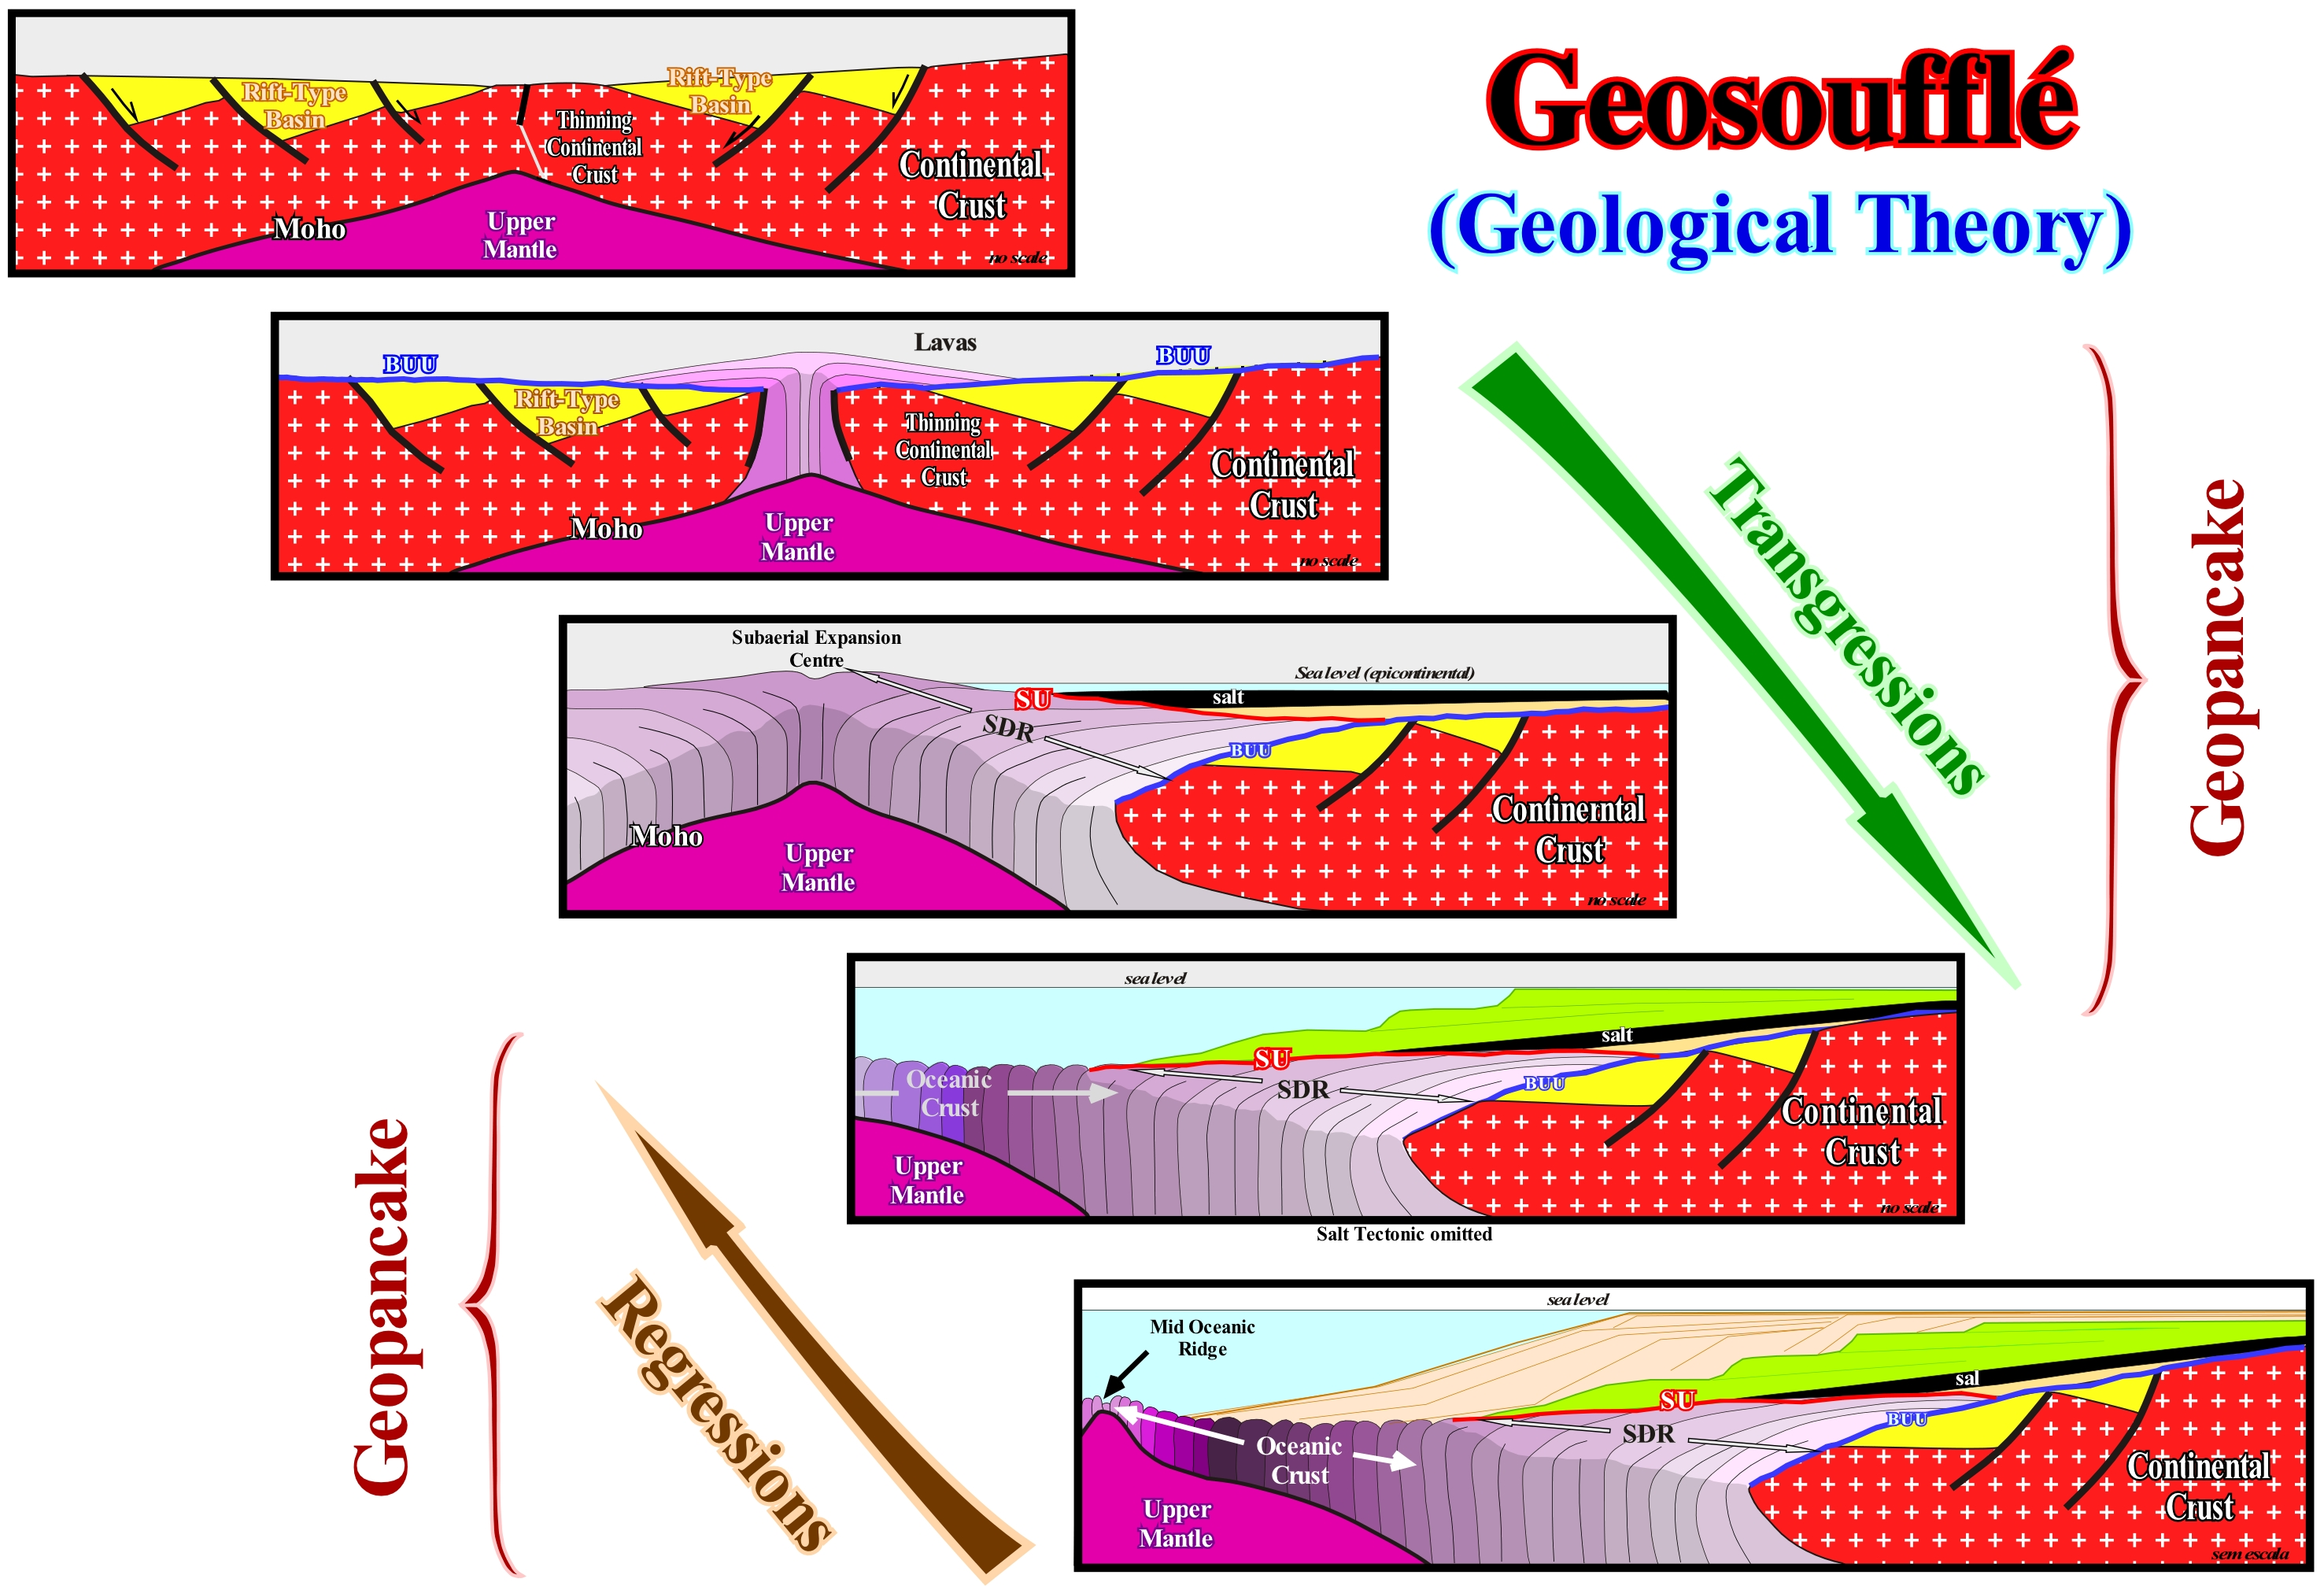
Since the beginning of the Cambrian, the absolute (eustatic) sea level changes (not to be confused with the relative sea level, which is local and referenced either to the base of sediments, i.e., to the top of continental crust or to the sea floor), proposed by P. Vail, form two great cycles with a wave-length of about 400 My. Each of these eustatic cycles is considered as a 1st order eustatic cycle. Its duration is greater than 50 My. Each 1st order eustatic cycle is composed by several 2nd order eustatic cycles (time-duration ranging between 3-5 and 50 My), which are, in turn, composed of several 3rd order eustatic cycles, whose time-duration varies between 0.5 and 3- 5 My, etc. In all these cycles, and particularly in the 3rd order eustatic cycles, marine ingressions during the C. Emiliani transgressions (set of increasingly important marine ingressions and associated increasingly smaller sedimentary regressions) are slower (0.1 cm per 1000 years) than during the regressions (set of decreasing marine ingressions and associated increasingly important sedimentary regressions), which mean value is around 2 cm per 1000 years. This can be explained by the Geosoufflé theory proposed by Emiliani in 1992. Such a theory can be summarized as follows: (i) The internal heat of the Earth causes a slow but significant swelling of the mid-oceanic ridge system producing a marine ingression* (water intrusion resulting in a durable submersion), with a significant displacement of the shoreline continentward ; (ii) The swelling causes the fracturing of rocks on the sea floor establishing a hydrothermal circulation at a depth of 5 km or more ; (iii) Heat is, rapidly, lost and the mid-oceanic ridge system collapses (like a pancake) creating a rapid regression, i.e., a major seaward displacement of the shoreline due to the deposition of sediments filling, roughly, the available space for the sediments (shelfal accommodation). This is what happens at the time of a supercontinent breakup and subsequent sub-aerial and oceanic expansion between the two individualized lithospheric plates, as shown in this figure, which represents, more or less, C. Emiliani's theory of geosoufflé. In modern sequential stratigraphy terms, it can be said, the transgressive phase of the continental encroachment stratigraphic cycle, postdating the supercontinent break-up (Pangea, for instance) corresponds to the marine ingression caused by the swelling of the geopancake. Similarly, the regressive phase of the continental encroachment stratigraphic cycle corresponds to the collapse of the geopancake induced by the cooling created by the hydrothermal circulation. Likewise, sedimentary transgressions** and sedimentary regressions*** associated with increasing and decreasing ice volume during periods of glaciation (glacio-eustasy) have similar dynamics. The sedimentary transgressions are slower (they last, more or less, about 80,000 years). Sedimentary regressions are faster, they last about 10,000 years. In fact, it takes much longer to deposit the ice on the continent than to melt it. The heat exchange between the ice caps and the ocean cools the surface of the water, which becoming cooler and denser sinks. It is replaced by warmer water coming from the bottom. The formation of ice caps requires cooling of the entire water column, which is not the case during deglaciation or thawing, which spreads on the surface a layer of poorly salted water. As followed in this glossary, the term marine ingression is used to denote the displacement of the shoreline continentward, when sea level rises significantly. The term sedimentary regression designates a displacement of the shoreline independently of the sea level. The displacement takes place during the stability period of sea level between the sea ingressions. In a marine ingression there is no deposition. Deposition (clastic) occurs. always, during a sedimentary regression. The set of increasingly large marine ingressions and increasingly smaller sedimentary regressions form, collectively, what most geoscientists call sedimentary transgressions or simply transgressions.
(*) As the amount of water in all forms is considered constant since the Earth formation, as the volume of the oceanic ridges increases, obviously, the volume of the ocean basins decreases inducing a significant rise in absolute (eustatic) sea level , i.e., a marine ingression.
(**) Set of increasingly smaller sedimentary regressions that collectively have a retrogradational geometry.
(***) Set of increasingly important sedimentary regressions, that collectively have a progradational geometry.
Geostrophic (Current)...........................................................................................................................................................Géostrophique (Courant)
Geostrófica/ Geostrófica (corriente) / Geostrophische (Storm) / 地转(电流) / Геострофический поток / Corrente geostrofica /
Ocean current that flows to the long of lines that do not correspond to the maximum of slope, due to the Coriolis effect. The movement of water, resulting from the balance between the force of gravity and the deflection caused by Coriolis force, is a geostrophic current. Geostrophic currents contribute greatly to the formation of large oceanic surface currents (gyres).
See : « Coriolis Effect »
&
« Surge Current »
&
« Surface Currents »
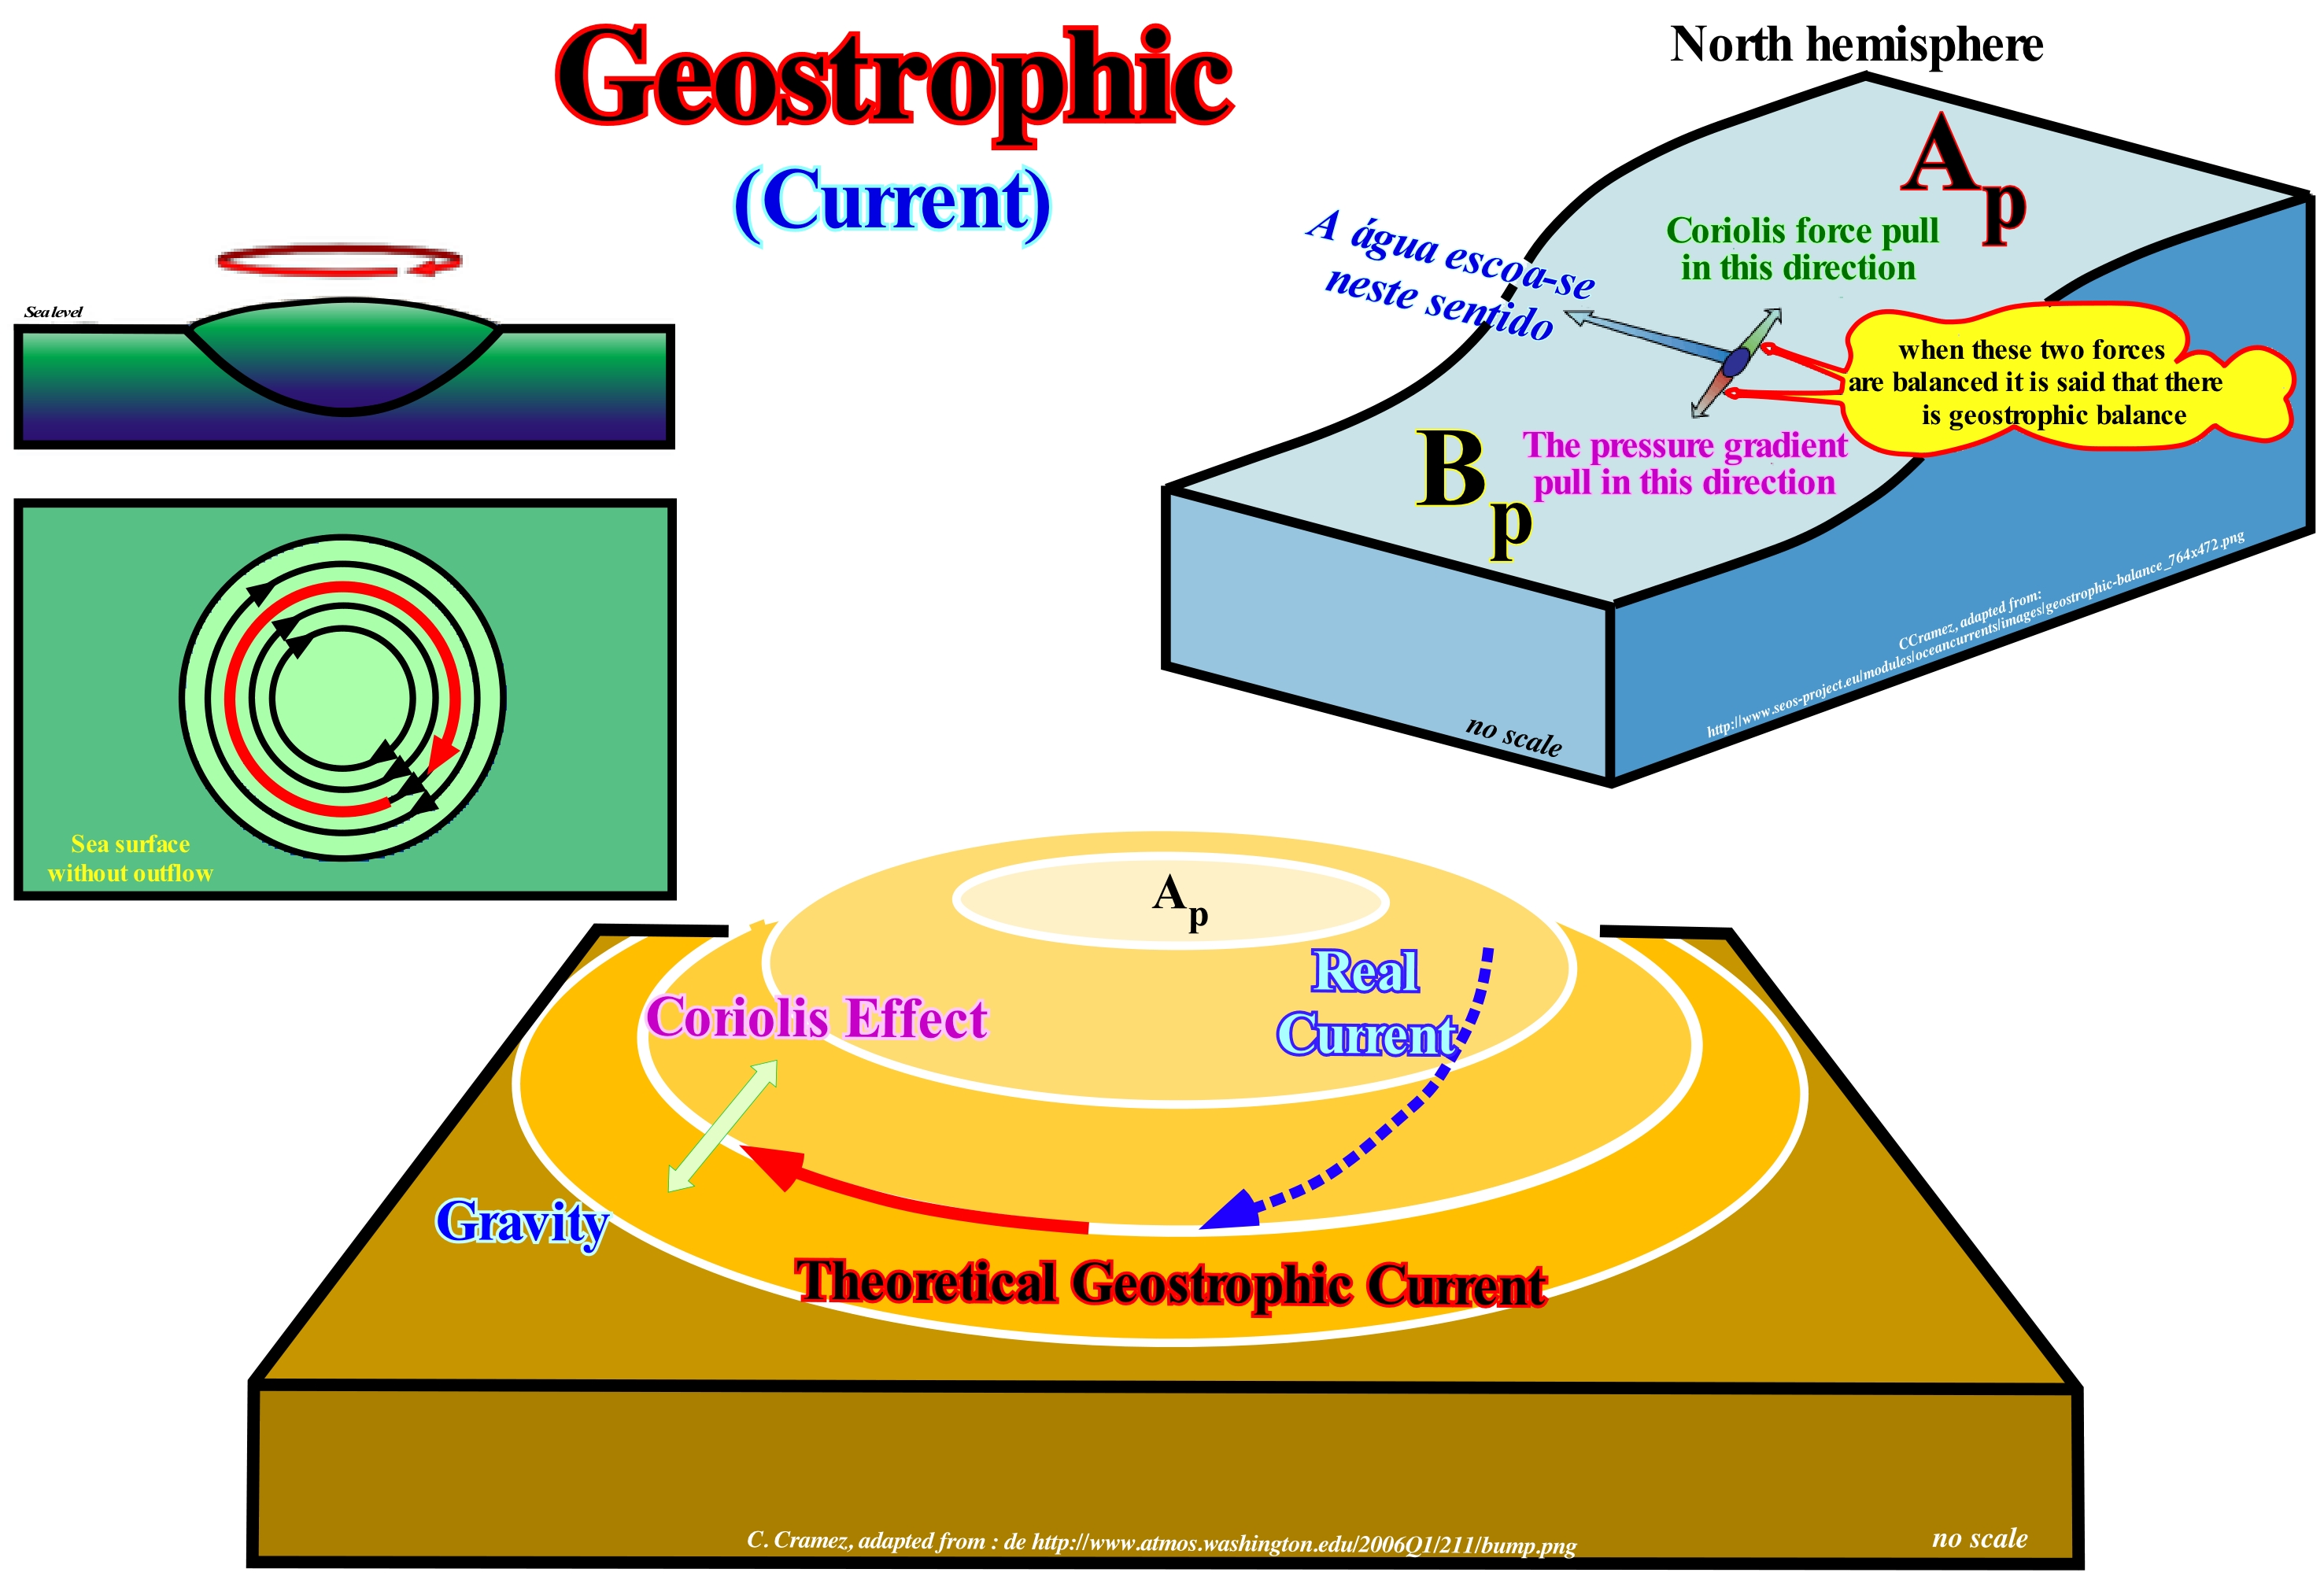
If locally the surface of the oceans is inclined there is a variation of the hydrostatic pressure along horizontal surfaces in depth (horizontal pressure gradients) and water tends to move from high pressure areas (where sea level is higher, or from the area with the highest water column) for the low pressure areas (lower sea level, i.e., the areas with the smallest water column) in order to eliminate the horizontal pressure differences. The force that gives rise to this movement is designated by the force of the horizontal pressure gradient. Initially, there is an accelerated downward movement of the water along the pressure gradient. until Coriolis force, which acts on moving water, is balanced by the force of the horizontal pressure gradient. Under such conditions, the current is in geostrophic equilibrium and is called the Geostrophic Current. So, under conditions of geostrophic equilibrium, the force of the pressure gradient and the Coriolis force* cancels out and the movement of water has a constant velocity or geostrophic velocity (law of inertia). It can be said that a geostrophic current results from the equilibrium between the gravitational forces and the Coriolis effect. The gravitational effect is controlled by the slope of the sea surface and the density of the water is controlled by horizontal changes of temperature (thermohaline) and salinity (halocline). Geostrophic currents are waves of inertia in the oceans (mechanical wave type that occurs in rotating fluids and unlike surface gravitational waves seen on beaches or in baths, inertia waves run through most of the fluid, not only the surface). Geostrophic currents move the water horizontally. As heat and salinity are involved, the geostrophic circulation is a type of thermohaline circulation. Thermohaline circulation is a somewhat more general term. It encompasses both the circulation of water bodies horizontally and vertically. Thermohaline circulation controls the vertical distribution of temperature and salinity in the oceans. It is responsible for vertical movements of the water that fans deep ocean masses. A geostrophic stream of water or wind is a theoretical current that would result from an exact balance between the Coriolis force and the force of the pressure gradient. This condition is called geostrophic equilibrium. The geostrophic current is parallel to the isobars (constant pressure lines). This balance, rarely, remains exactly in nature. The actual current almost, always, differs from the geostrophic current due to other forces such as soil friction or the centrifugal force of curved fluid flow. The (real) current would be equal to the geostrophic current if there were no friction and if the isobars were perfectly in a straight line. Outside the tropics**, most of the atmosphere, for example, has a flow close to the geostrophic runoff. Low atmospheric pressures and converging ocean currents tend to raise sea level (plus or minus 1 m). High atmospheric pressures and divergent sea currents tend to bring the surface of the sea level to about 1 m. Water flows from the highs to the lows,. However, it does not flow along the maximum slope, but along contour lines due to the Coriolis effect. As far as air is concerned, when the air is relatively cold, it slowly descends and compresses the air underneath, causing greater pressure. Although caused by cold air, it causes a warm, sunny weather, because the descending air prevents the formation of clouds, originating a clear sky. When the hot air rises, it creates, underneath it, a zone of low pressure which means bad weather, because when the water vapor cools it turns into clouds that can produce rain, snow, etc.
(*) The force of Coriolis arises as a consequence of observing the movements of a current (air, water) in a non-inertial coordinate system (a coordinate system fixed on the surface that rotates with it). Newton's laws of motion are valid for inertial reference systems (without acceleration). To use them in a non-inertial system one can adapt Newton's laws by introducing fictitious forces. A fixed passenger of a car that describes a circular curve of a certain radius with a certain speed. An external observer verifies that the car and the passenger are subjected to a centripetal acceleration that continuously changes the direction of its speed. The passenger attached to the car is, however, at rest in relation to a coordinate system also attached to the car. To express this resting condition (or null resultant force), using the laws of Newton, it is necessary to adopt the existence of a centrifugal acceleration in such a way that the resulting force is zero. In the case of the movement of air or water according to a coordinate system that rotates along with the Earth, two fictitious forces appear: centrifugal force and Coriolis force.
(**) Geographical parallels that delimit the zone where the zenith projection of the sun's rays occurs at least once throughout the year, to the north of the Tropic of Cancer and to the south of the Tropic of Capricorn the Sun never reaches the zenith of the observer.
Geostrophic (Wind)........................................................................................................................................................................Géostrophique (Vent)
Geostrófico / Geostrópico (viento) / Geostrophischer vent / 地转(电流) / Геострофический ветер / Vento geostrofico /
Theoretical wind resulting from the exact balance of Coriolis effect and pressure gradient (physical quantity describing the direction and rate of the faster pressure change around a particular site). The geostrophic wind moves parallel to the isobars, that is to say, the constant pressure lines (at a given altitude).
See : « Atmosphere »
&
« Coriolis Effect »
&
« Equilibrium »
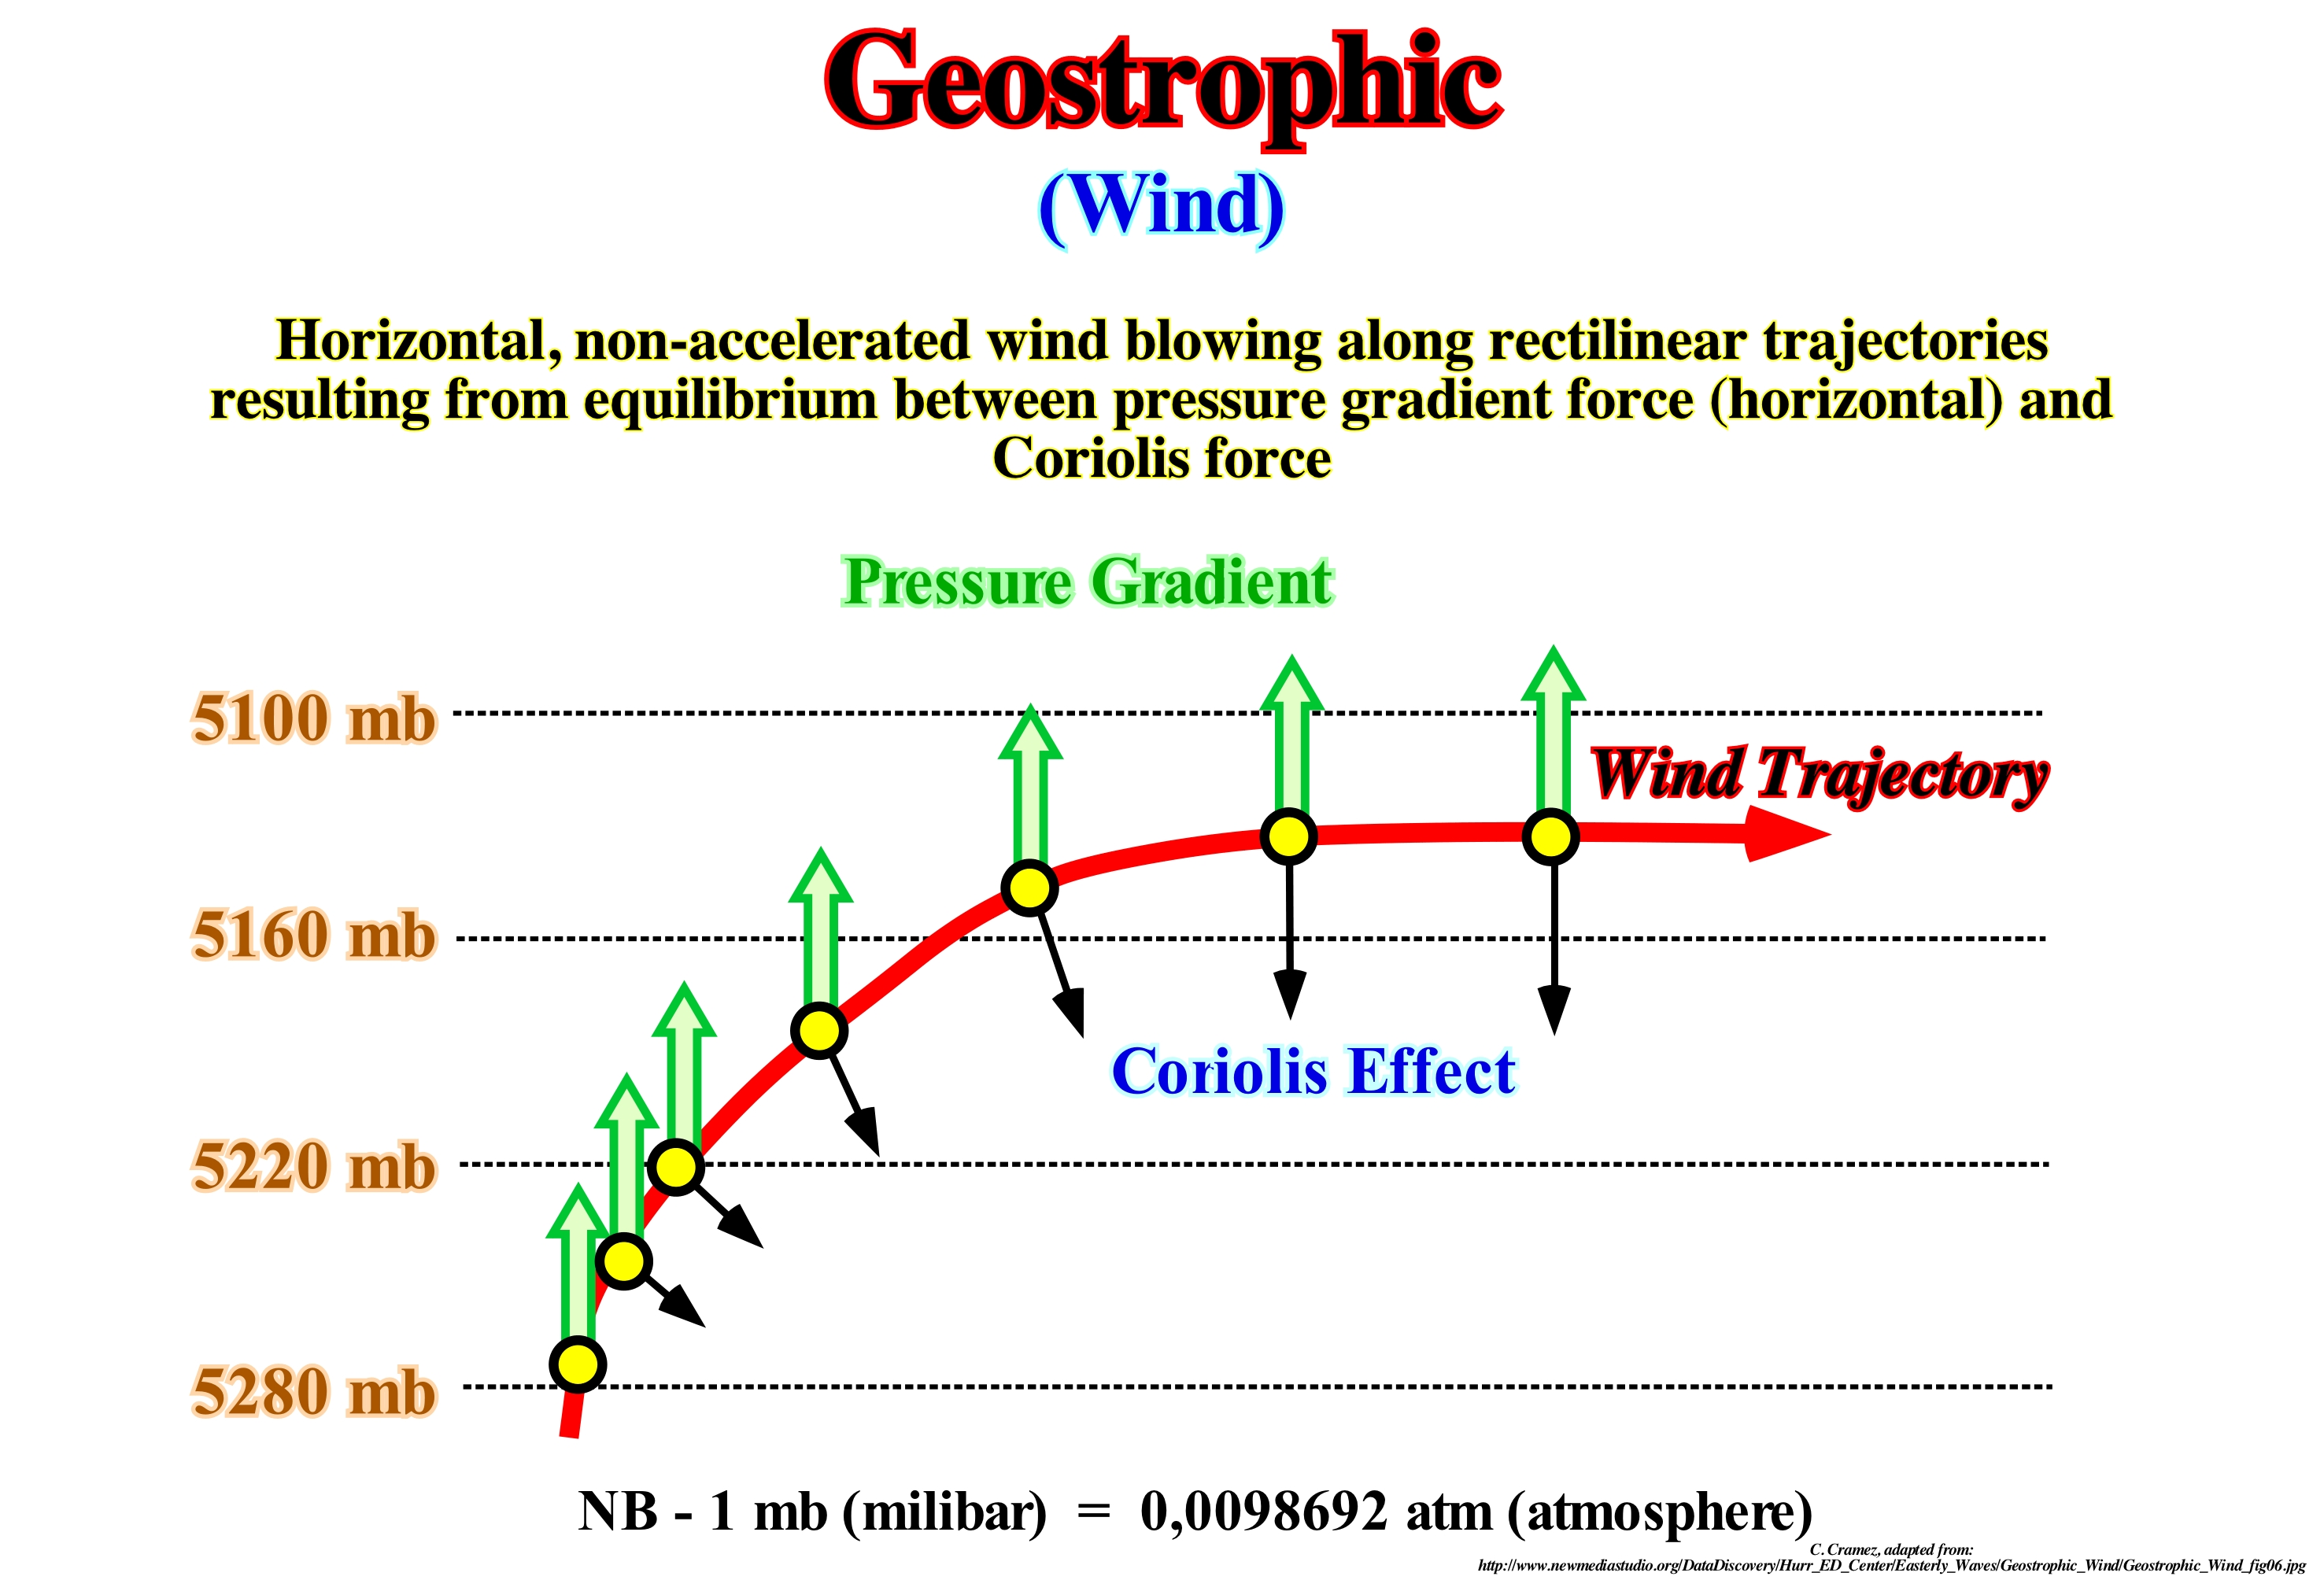
The geostrophic wind is a theoretical wind that would result from an exact balance between the Coriolis force* and the force of the pressure gradient. This condition is called geostrophic balance. The geostrophic wind is parallel to the isobars (constant pressure lines at a given altitude). This balance rarely remains in nature. The actual wind differs almost, always, from the geostrophic wind due to other forces such as the soil friction or the centrifugal force connected to the curved flow of the fluid. The (real) wind would be equal to the geostrophic wind if there was no friction with the surface of the ground and if the isobars were perfectly in a straight line. Outside the tropics, most of the atmosphere has a flow close to the geostrophic runoff. Of course, because of the pressure gradient force, air moves from high pressure areas to low pressure areas. Since the air begins to move, the Coriolis force deflects it. The deviation is to the right in the Northern hemisphere and to the left in the Southern hemisphere. As the air moves from the high pressure zone, its speed increases, as does the Coriolis effect. The deviation increases until the Coriolis force and pressure gradient enter into geostrophic equilibrium. From that moment, the air flow is no longer from the high pressure area to the low, but according to an isobar (constant pressure line at a given altitude). This explanation assumes that the atmosphere begins in a state of geostrophic imbalance. Geostrophic balance helps to explain why in the Northern hemisphere low pressure systems spin counter-clockwise and high-pressure systems clockwise. Everything in the Southern hemisphere is reversed. All geostrophic flow into the atmosphere (air) or into the ocean (water) corresponds to a zero frequency inertia wave.
(*)The force of Coriolis arises as a consequence of observing the movements of a current (air, water) in a non-inertial coordinate system (a coordinate system fixed on the surface that rotates with it). Newton's laws of motion are valid for inertial reference systems (without acceleration). To use them in a non-inertial system one can adapt Newton's laws by introducing fictitious forces. A fixed passenger of a car that describes a circular curve of a certain radius with a certain speed. An external observer verifies that the car and the passenger are subjected to a centripetal acceleration that continuously changes the direction of its speed. The passenger attached to the car is, however, at rest in relation to a coordinate system also attached to the car. To express this resting condition (or null resultant force), using the laws of Newton, it is necessary to adopt the existence of a centrifugal acceleration in such a way that the resulting force is zero. In the case of the movement of air or water according to a coordinate system that rotates along with the Earth, two fictitious forces appear: centrifugal force and Coriolis force.
Geostrophic Equilibrium...................................................................................................................Équilibre géostrophique
Equilíbrio Geostrófico / Equilibrio geostrófico / Geostrophische Gleichgewicht / 地转平衡 / Геострофический баланс / Equilibrio geostrofico /
State of motion of an ideal fluid (nonviscous fluid, characterized by surface forces perpendicular to the boundaries of each element), in which the Coriolis force accurately balances the horizontal pressure force at all points. During a cyclone, in extratropical latitudes, the atmosphere, often, approaches a state of geostrophic equilibrium.
See: « Coriolis Effect »
&
« Geostrophic (current) »
&
« Ocean Current »
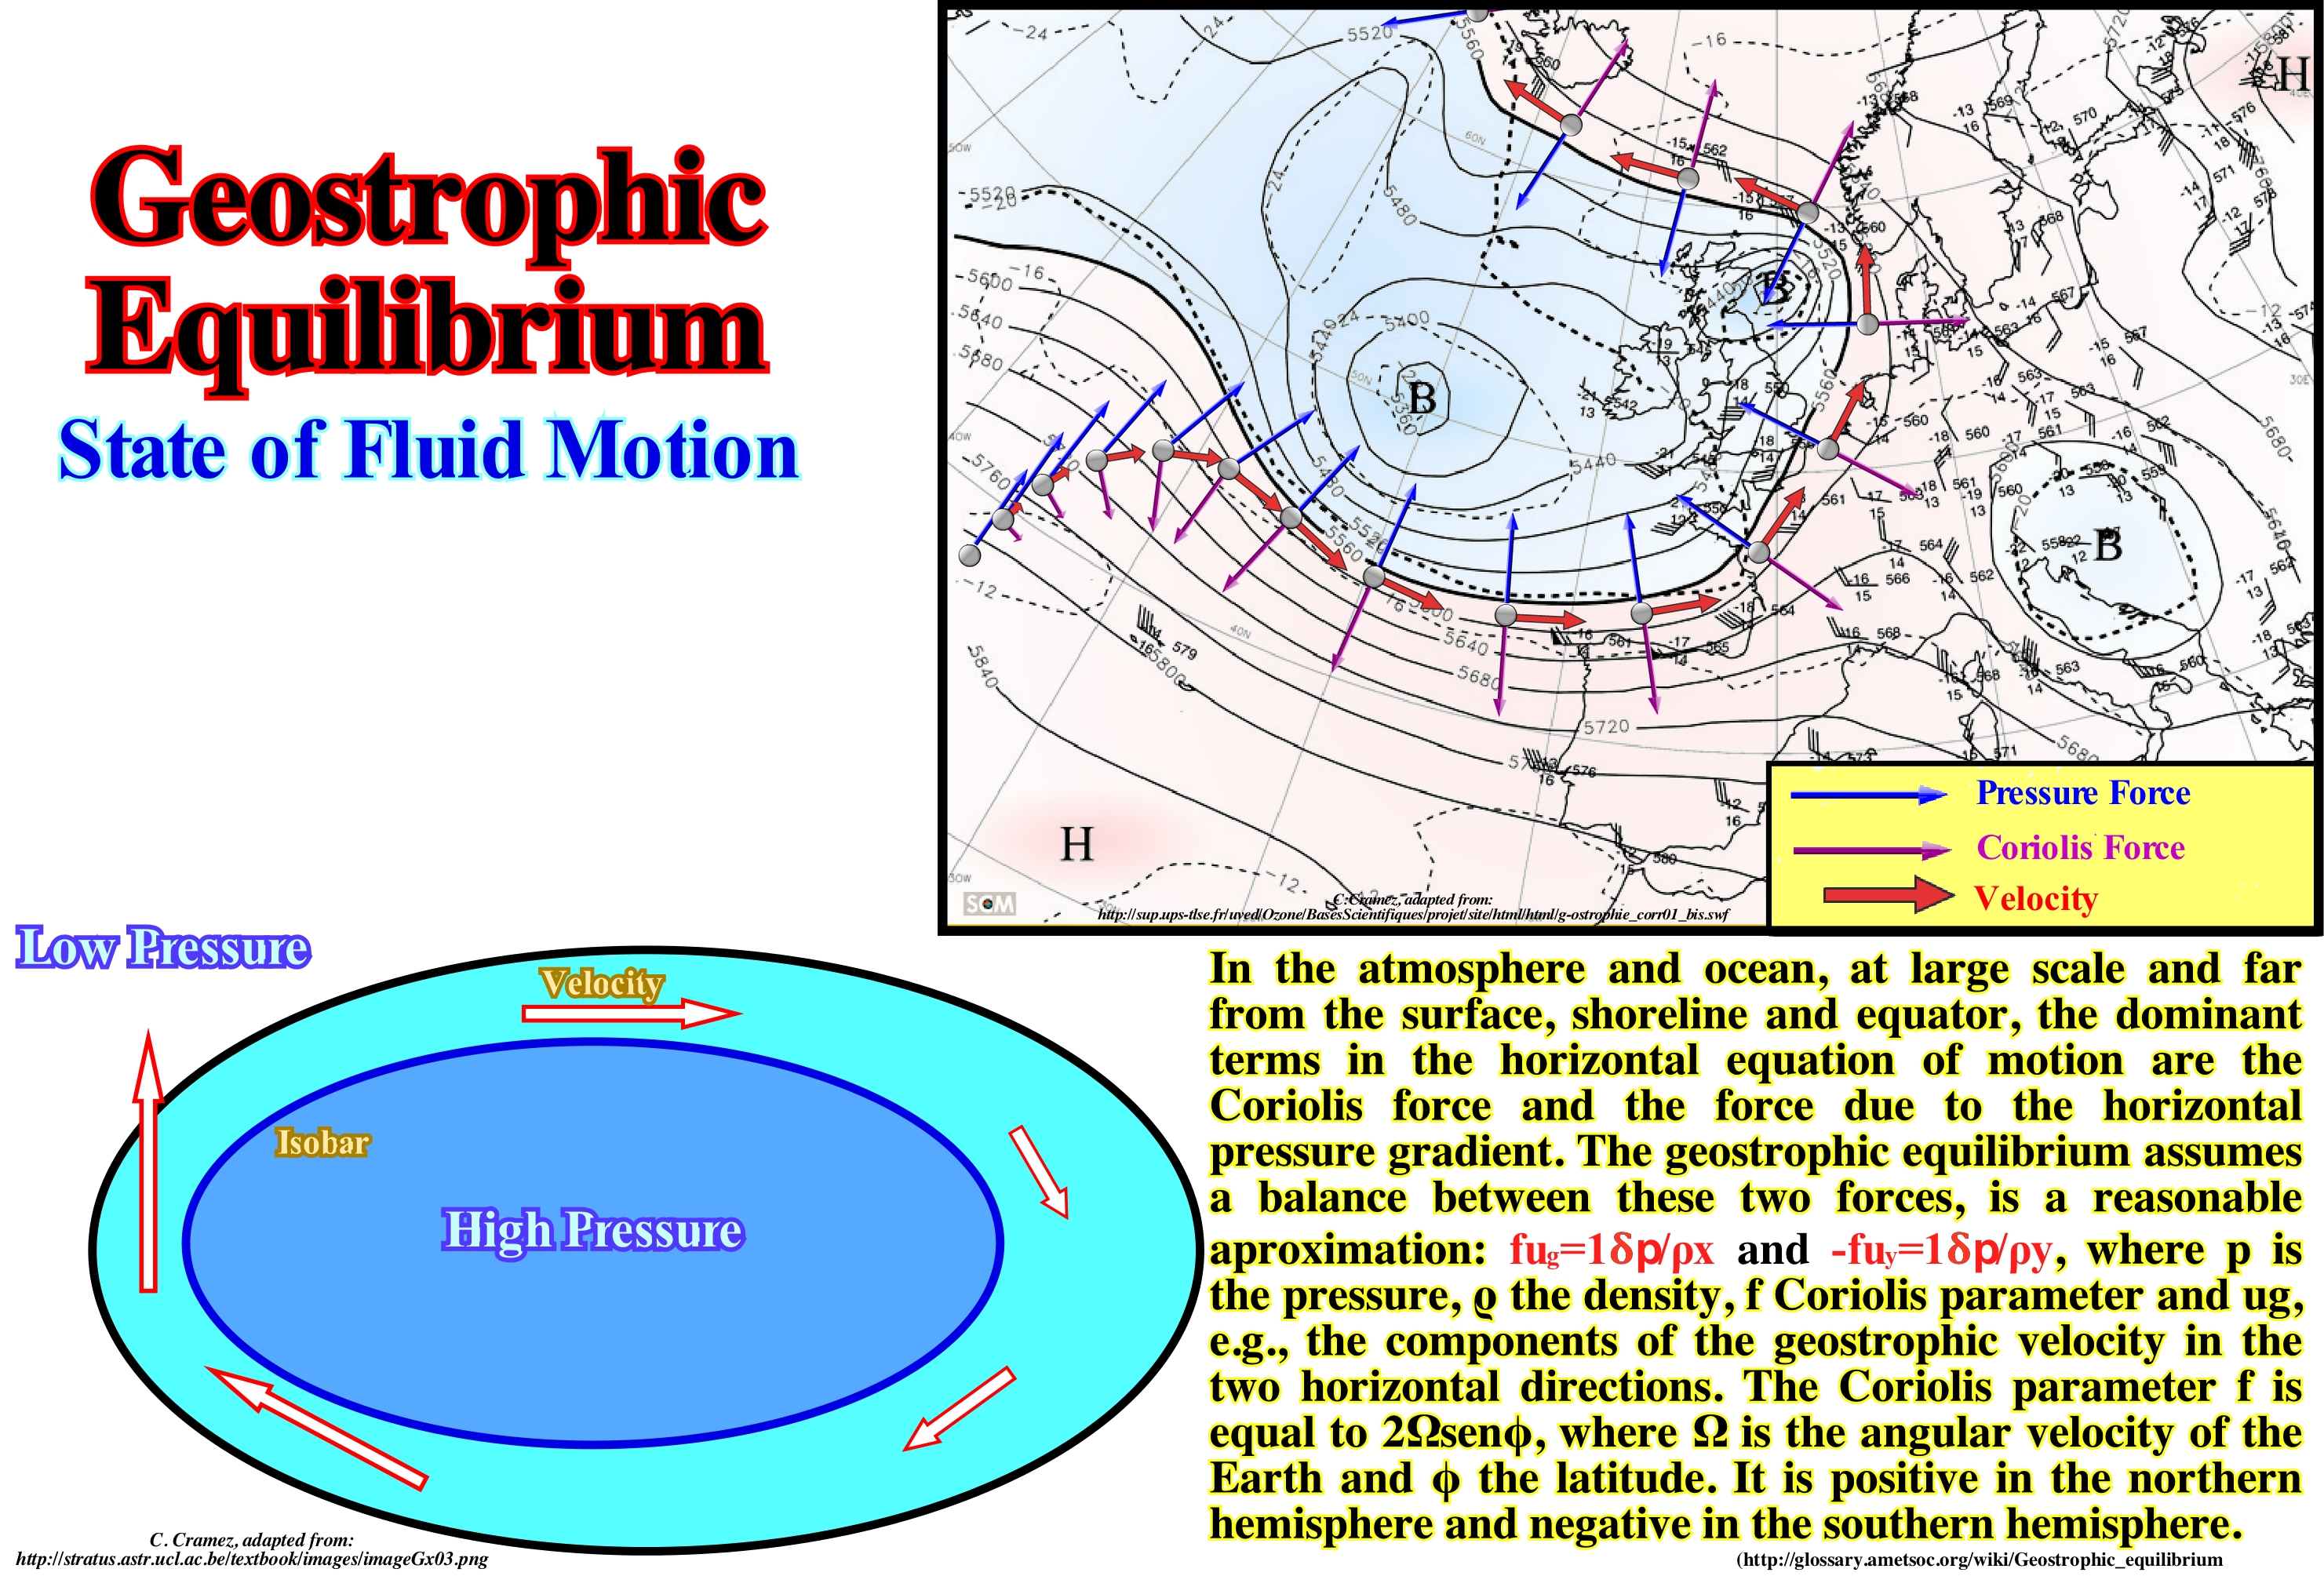
At the large scale, in the atmosphere, in the ocean and outside the equator, the dominant terms in the equation of horizontal motion of air or water are: (i) Coriolis force* and (ii) The force caused by the horizontal pressure gradient, i.e., the pressure difference between two points. The geostrophic balance presupposes a balance between these two forces (Coriolis and horizontal pressure gradient). The Coriolis parameter is positive in the Northern Hemisphere and negative in the Southern Hemisphere. When this equilibrium is reached, the fluid is in geostrophic equilibrium. Geostrophic balance explains why the wind is clockwise around high pressure in the Northern Hemisphere, as shown in this figure, and counter-clockwise around a low pressure in the Southern Hemisphere. Wind, which shifts from a high pressure to a low pressure in order to cancel out the pressure difference due to the Coriolis effect, is shifted to the right in the Northern Hemisphere as it comes from the high pressure. As the wind approaches the low pressure it is shifted to the left producing a counter-clockwise movement around the centre of the low pressure. The winds that move from the highs to the low pressures under the influence of Coriolis force are the geostrophic winds. The geostrophic wind is the theoretical wind that would result from an accurate balance between the Coriolis effect and the force of the pressure gradient. It is directed, in parallel, to the isobars (lines of equal or constant pressure). This balance, rarely, remains exactly. The true wind often differs from the geostrophic wind due to other forces such as soil friction. The real wind would be equal to the geostrophic wind if there were no friction and if the isobars were perfectly straight. Despite this, much of the atmosphere, outside the tropics, is close to the geostrophic flow most of the time. The geostrophic flow in air or water is an inertial wave of zero frequency (affects the entire mass of the fluid and results from the tendency to return to the initial state). Low atmospheric pressures and converging ocean currents tend to raise sea level surface by more than 1 meter. High atmospheric pressures and divergent ocean currents tend to lower sea level by about 1 meter. Due to the Coriolis effect, water flowing from high to low does not flow along the maximum slope, but along contour lines (isolines, isograms or lines of the same value, which are curves connecting that a function has the same value). It is these currents that geoscientists call geostrophic currents. Despite this, much of the atmosphere outside the tropics is close to the geostrophic flow most of the time and is a valuable first approximation. In the same way (http://cursos.unisanta.br/ oceanografia/correntes _marinhas.htm), as the winds tend to move, more or less, circularly due to the effect of Coriolis, that deflects its original movement, when blowing in the ocean surface causes an accumulation of water in the central portion of the large wind belts at the mid-latitudes of each hemisphere. This phenomenon occurs due to Ekman's spiral, which demonstrates that the resulting average flow of water has a direction perpendicular to that of the wind. This convergence of water to a certain region has two consequences: (i) Elevation of the water level leading to a water hill and (ii) Thickening of the surface layer. The water hills, characteristic of regions of surface water convergence, are small, and rarely exceed 2 meters. However, the response of water to this ocean topography is as it happens on land, that is, running downhill because of the force of gravity. Such a movement does not occur in a straight line, but is deflected by the Coriolis effect, to the right in the Northern Hemisphere and to the left in the Southern Hemisphere. The water movement, resulting from the balance between the force of gravity and the deflection caused by the effect of Coriolis, is also called geostrophic current and is one of the main components that contribute to the formation of large oceanic surface currents.
(*) The inertial force of Coriolis or pseudo-force of Coriolis is a pseudo-force or inertial force (not a force in the definition of the term) perceived only by observers in solidarity with noninertial references animated of rotation movement in relation to an inertial referential that move away or approach the centre of this rotation. The pseudo-force of Coriolis is felt only when an object is in motion in relation to the non-inertial frame under consideration. It is always perpendicular to the speed and also to the axis of rotation of the noninertial system in relation to the inertial. In Newtonian mechanics, it is said that a reference system is non-inertial when it does not follow Newton's motion. Given an inertial reference system, a second reference system is noninertial, when describing an accelerated motion relative to the first.